American Runners Have Never Been Slower (Mega Study)
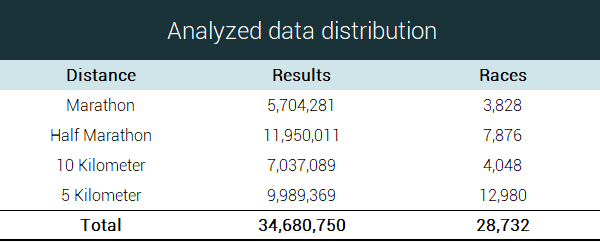
For this Mega Study, we have analyzed 34,680,750 results from 28,732 different races.
American race runners are steadily getting slower across all four major race distances - 5 Kilometer, 10 Kilometer, Half Marathon, and Marathon.
In this study, we analyze how Americans’ health influences their running performance.
Feel free to use any material from this page, as long as you refer to this original source.
Key result
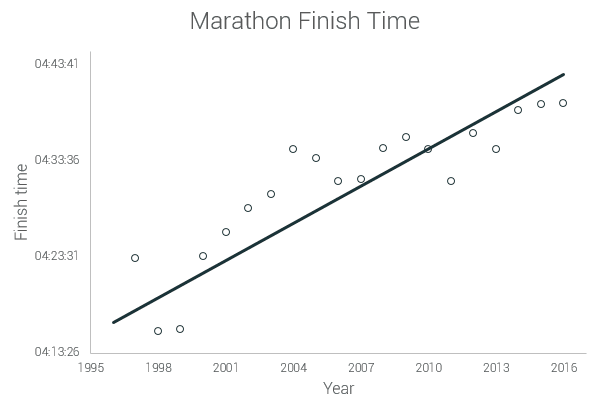
The graph below shows the finish time trend of the marathon runners in the period from 1996 to 2016. And the year 2016 was the slowest in history.
Now, a short background of the study.
Why this study?
The deteriorating American health has been a popular topic for quite some time. We wanted to see if this trend is reflected in running race finish times.
The amount of data
This is the most exhaustive study of running race results in history. Our key conclusions are at least 99% statistically significant for all of the most popular running race distances. Throughout this article, our primary focus will be on marathon results, though our results are confirmed through identical analysis of Half Marathon, 10 Kilometer, and 5 Kilometer race results.
Omitted data
- Our initial database includes results from 1902-2017 (May). We limited our analysis to 1996-2016.
- We included only races with an average number of finishers greater than 2,000 (for all four distances).
- For our gender analysis, we excluded entities without a valid gender entry.
- The dataset includes only finishers.
- The trimmed database (the foundation of our analysis) contains 24,763,389 results for the finish time trends (1996-2016) and 23,725,787 for the health correlations (2000-2016).
Basic Terminology & Methodology
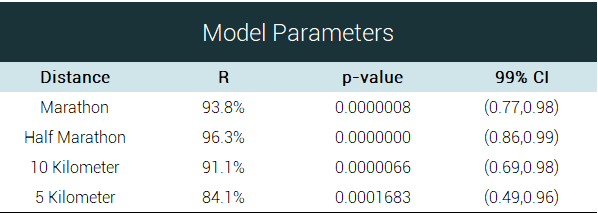
All of our results are at least 99% statistically significant.
Correlation coefficient (R) - this coefficient shows the degree in which two variables have a linear dependency. R has values between -1 and 1. The closer the value is to either -1 or 1 the stronger the linear connection. For this analysis, we have used the Pearson Correlation Coefficient formula:

P-value - a p-value, which is less than 0.01, means that our results are statistically significant with a confidence level of 99%.
Confidence interval (CI) - an interval in which the error terms of the model lies with 99% certainty. If intervals don’t contain the value 1, they are considered to be statistically significant. For this analysis, we have used Fisher’s Z’ score transformation, where Z’ is by definition normally distributed.
Results From The Analysis
Americans are getting slower.
Across all of the major race distances.
The only ones not getting slower are the top elite runners.
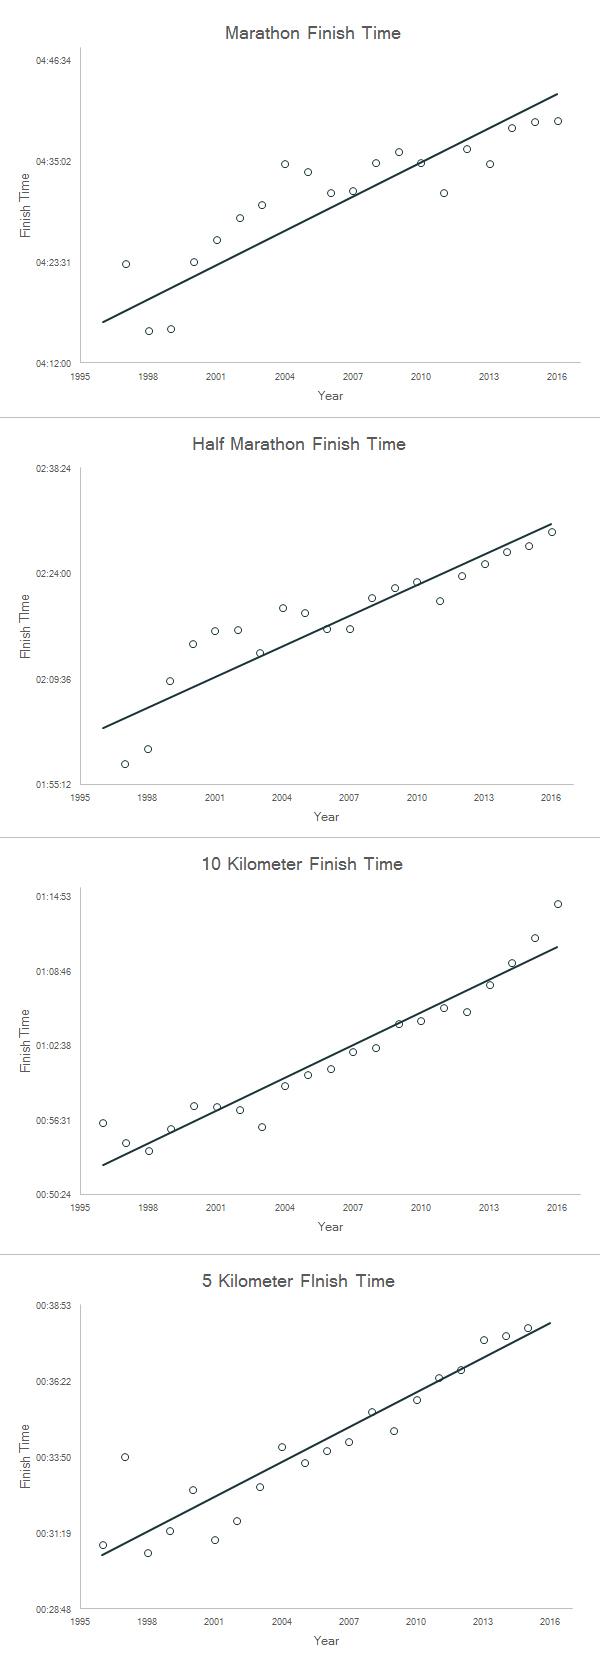
Our conclusions are presented with more than 99% statistical significance (see p-values below) and with very strong correlation (R) values.
Myths On Why Americans Are Getting Slower
It has been a popular belief that the increase of the average marathon finish time is due to the fact that participating in running competitions is gaining popularity. With the popularity increase, the number of not so fit participants rises, and the average finish time increases.
This argument is not exhaustive.
Let alone that in the last two years (2015 and 2016) numbers of participants are declining and the finish time in all the four major race distances is still growing.
Nonetheless, there are some often used arguments, which we disprove.
The proportion of women participants is increasing, and women are slower in general
Thоugh this is a logically sound argument, our research shows that the rise in the numbers of female participants has less effect (46%), in the slowing of pace than the decrease in the speed of men (54%). This is so because men are becoming slower much faster than women’s number of participants is rising.
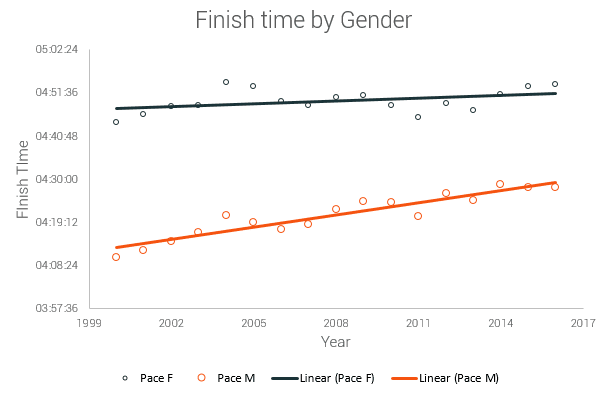
For this piece of analysis, we used the Wald test for significance of the difference in slopes of two samples. The p-value we obtained is 0.000074, which means that the slopes of the two trends are statistically different with more than 99% level of confidence.
Therefore, this argument is invalid.
In connection with this finding we have estimated that if this trend continues, female and male runners will have the same pace by 2045.
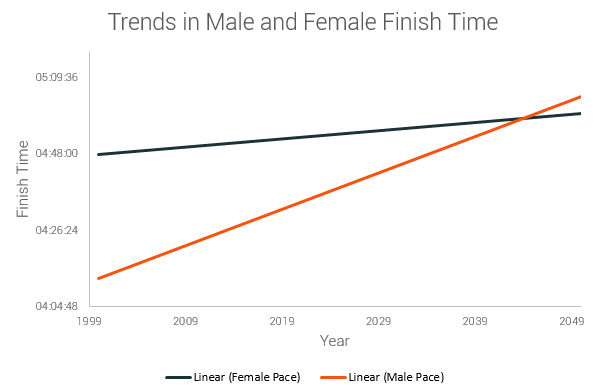
Due to physiological differences between men and women, this is not likely to happen. See our previous study on marathon pacing for men and women.
People with inappropriate fitness level just walk the race
With an average walking pace of about 19 and a half minutes per mile, one could walk 5 Kilometers in 1 hour, 10 Kilometers in 2 hours, a Half Marathon in 4 hours and a Marathon in 8 hours.
If there is an increasing number of people who walk the race, the percentiles of the walking speed finishing time should decrease (i.e. smaller percentage finish for a lesser amount of time).
Across all distances, the proportion of “runners” finishing slower than with the average walking pace is rather consistent. There’s no statistically significant difference.
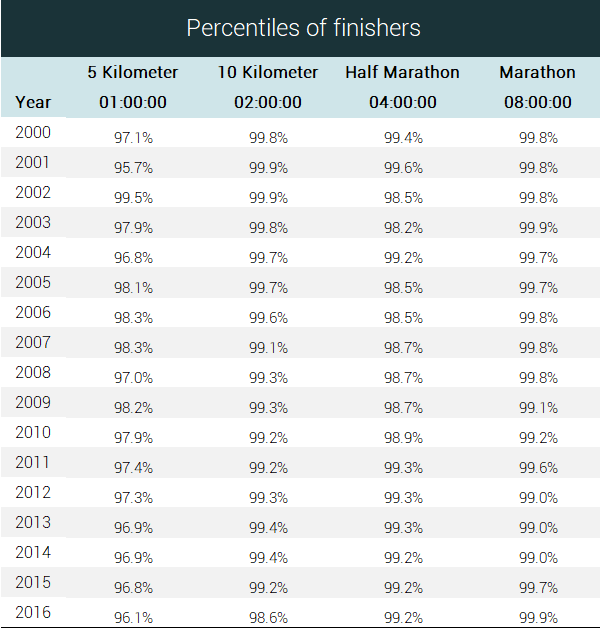
Therefore, this argument is invalid.
Just the slow are getting slower
We made a two-fold analysis on that claim. The main argument is that most of the new participants who enter the race are slower than the core competitors and they drag the average down.
First, the main argument is that most of the new participants who enter the race are slower than the core competitors and they drag the average down.
This is a sensible argument, which is in sync with the trends. That is why we calculated the average finish times of the 100th, 1000th, 2000th and 5000th competitor in the races from our database. If the claim were true, then the finish time of the faster competitors shouldn't change much year after year and the time of the slower finishers should change a lot.
We have made distinct analysis for men and women. These are the data and the trends.
First for female participants
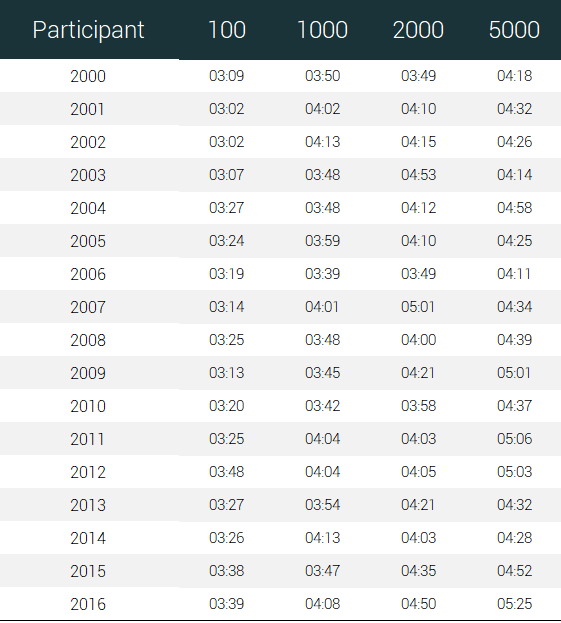
and the trends are as follows
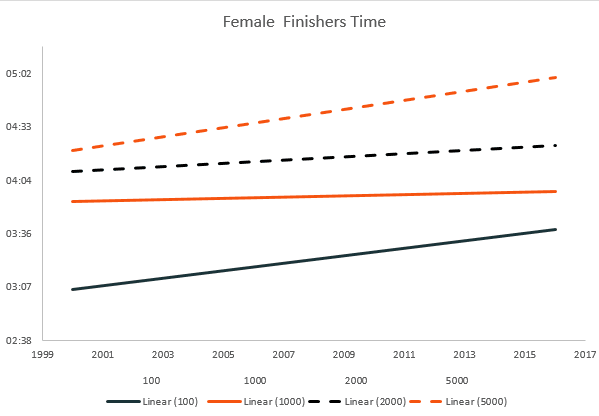
The fastest female participants have slowed down on average with 9.87% over the last 17 years.
For the male participants, the data is the following
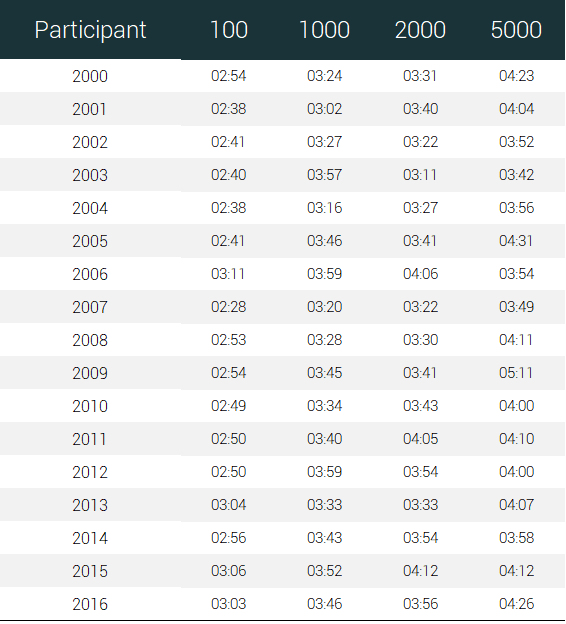
and the corresponding trends
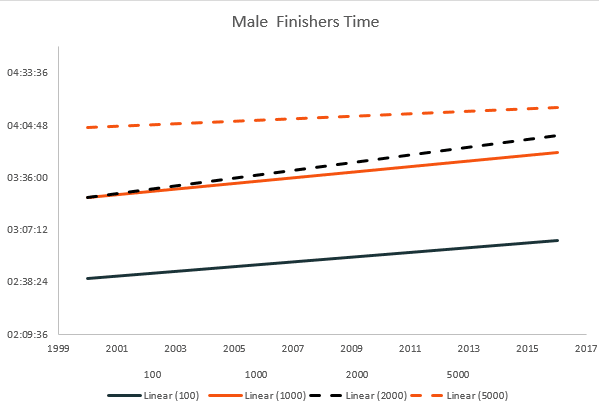
The male fastest participants have increased their finish time with 9.94% over the last 17 years.
We can clearly see that the slowing down is on every level.
Second, we've made a percentile analysis. If just the slow are getting slower than the participant in the lower percentiles (the faster finishers), should show much less change in their finish time than their slower counterparts. These are our findings
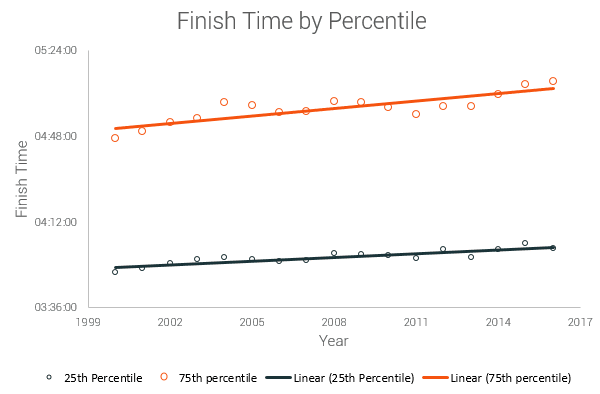
We see that everyone is slowing down. Moreover, when we performed a Wald test for the slopes of those two trends we discovered that they are not significantly different (with 99% level of confidence). Our p-value for this test is 0.0084.
Therefore we consider this argument to be also invalid.
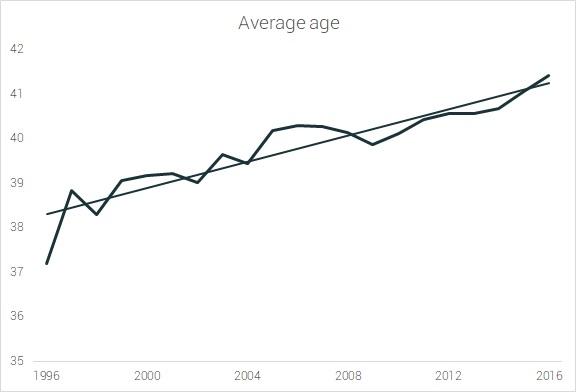
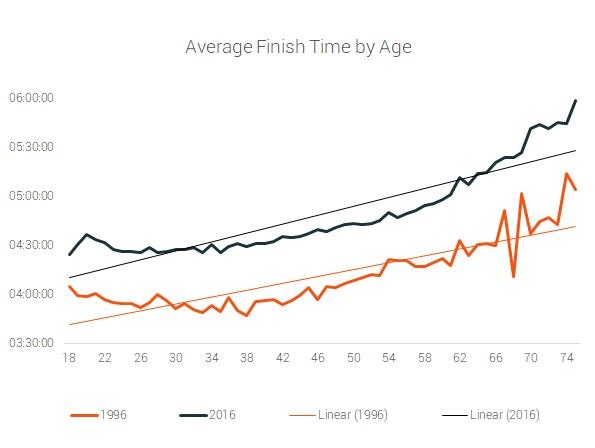
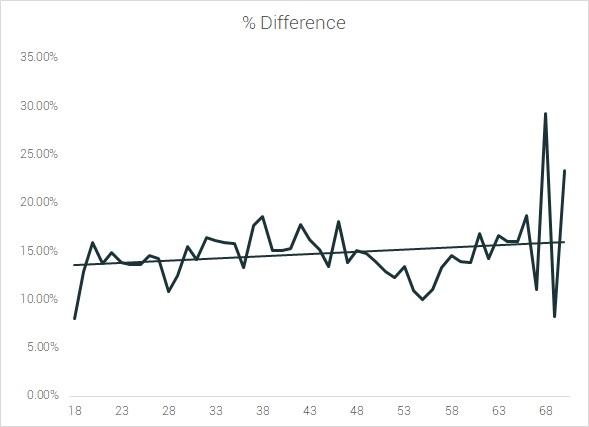
The average age of the participants is increasing and Older = Slower
So, what is making Americans slower?
We have examined and found some interesting correlations, but it is important to note the lack of evidence for a causal relationship. The study takes into account the number of participants and the national average rates of the following health parameters:
- Adult obesity;
- Teenage obesity;
- Diabetes and Hypertension;
- Average annual Medical expenditure;
The source of the data for the four health-related parameters is State of obesity, as confirmed by the Center for Disease Control and Prevention.
We correlated the average race finish time with each of those parameters and saw clear trends. These correlations proved to be strong, 99% statistically significant, consistent, plausible, coherent and replicable in different circumstances.
Nevertheless, these are just correlations. We can not infer from the national statistics the health condition of the race runners. Is it deteriorating or improving? Also, in no way we argue that these are the only possible explanations and reasons for the observed effect.
How does the % of obese Americans influences their performance?
We won't go into too much detail here and we'll just show the relationship between obesity rates and marathon finish time.
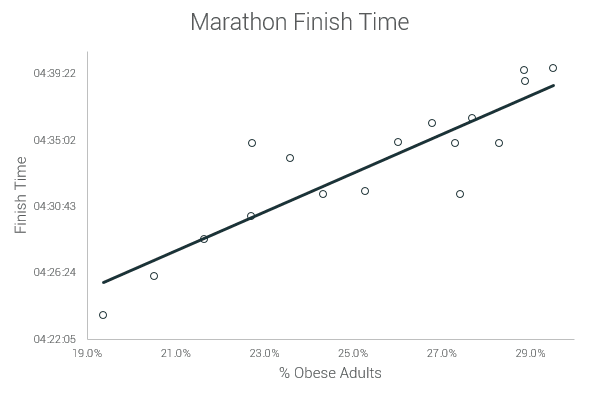
This trend is valid for all distance's results, and even more so for the shorter ones:
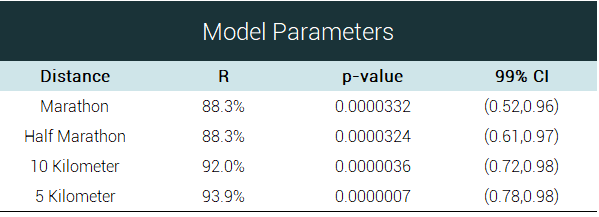
We have confirmed this trend also by examining the effect of obesity rates to the finish time after 3 years - the results are similar. They are even more significant for the mid-range distances.
This accounts for the coherence of the study and the lasting effects of obesity.
We have obtained analogous results for all the up aforementioned parameters (in both time frames). All the relationships are statistically significant with more than 99% level of confidence.
Playing the Devil's Advocate
It would be convenient to leave things here and leave out all ambiguity. Nevertheless, it is important to examine and show the full picture. We analyzed the finish times of the 100th, 1,000th and 10,000th slowest participant (separately for men and women) for every year. Here are the results.
The slow participants are slowing down at a much higher rate than the faster ones. So the fast ones can not compensate.
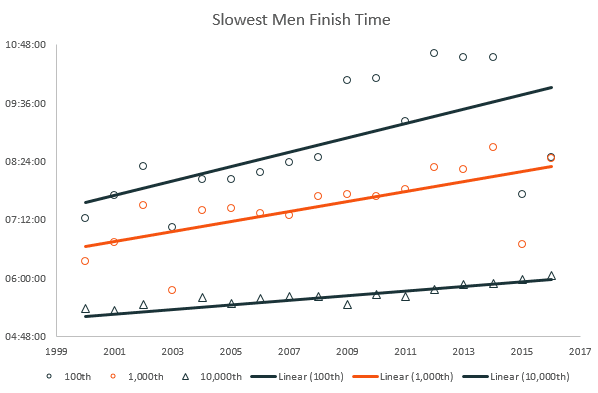
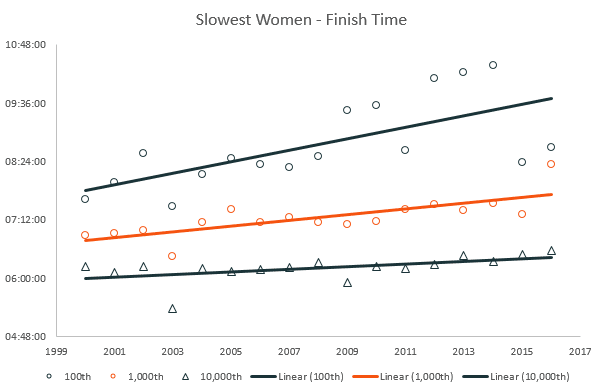
For the last 17 years the average rate of slowing down of the slowest men is 21.2% and for the women, this rate is 13.4%. Which means that there is some merit for blaming the newcomers for the trend we have established.
We can not be sure, that the reason is that the individuals are slowing down. A very real possibility is that the rise in the number of participants is a downside for the faster runners. This might be a reason for them to explore other options and to turning to other types of endurance racing - ultramarathons, triathlons, cross fit or something else.
Also, this trend might be a good thing as more and more people get involved in physical activity. But there is also the argument that the popularity of marathon running and endurance racing is attracting people who are not healthy enough to meet the challenge. This is also a serious health risk.
Conclusions
- The average American runner has never been slower (across gender and distance);
- This effect is not due to the increase in female participants or "runners" - people who run slowly or walk the race;
- Signs of poor health are highly correlated to the decrease in speed. Though we cannot with certainty say that these are the causes for the slowdown. And if they have causal nature that they show the full picture.
About The Researchers
The study was led by Jens Jakob Andersen and assisted by Vania Andreeva Nikolova. Andersen is a former competitive runner and statistician from Copenhagen Business School. Nikolova holds a Ph.D. in Mathematical Analysis.
Finding the right running shoes
At RunRepeat.com, our goal is to help runners find the right pair of running shoes at the best price. Remember, running shoes come in many forms, some shoes are specific to road running, some are better built for trail runners, and there are even running shoes to help with overpronation. Ultimately, we're here to help you find the right shoes easily and quickly by delivering the most objective and unbiased shoe reviews. We buy all the shoes on our own, wear test them and lab test them.
RunRepeat covers athletic footwear in other categories like hiking boots, hiking shoes, everyday sneakers, and training footwear, from popular brands like Merrell, Asolo, Nike, Vans, PUMA, Adidas, and Under Armor to mention a few.
Once in a while, we do in-depth studies on running too. Learn more about everything RunRepeat does on our about page.
Use of content
- We are happy to give interviews on the topic at any time. Reach out to Jens at jens@runrepeat.com.
- For web usage, any minor text sections, all data, and all graphics may be used as long as a reference is added to this original piece.
- For print usage, reach out to jens@runrepeat.com.
A full infographic can be downloaded from below. Signs of poor health are highly correlated to the decrease in speed. Though we cannot with certainty say this is the reason for the slowdown.
Feel free to use any material from this page, as long as you refer to this original source.

