133 stats on 5K running races in the US
The data for this statistics page is a result of the collaboration between the IAAF and RunRepeat.com. The stats about the 5-kilometer runs has been compiled and presented by Vania Nikolova, Ph.D. in Mathematical analysis.
If you want to read more running statistics and compare your finish time with the rest of your fellow US citizens, you can use our calculator.
5K races participation stats for the United States
Number of 5k race participants in the United States per annum: 2,616,876
- Participation in 5Ks has increased by 740% between 2000 and 2016 (from 330,316 participants per year to 2,776,331)
- In the last 3 years, there's a decline of 6% (from 2,776,331 participants to 2,616,876).
- Parkrun 5K data was not included as the timing on these races is started for the entire group and not as individuals cross a dedicated start line.
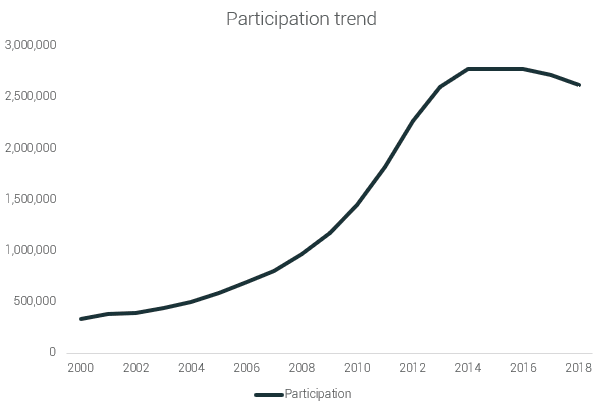
| Year | 2009 | 2010 | 2011 | 2012 | 2013 |
| Participation | 1,174,033 | 1,447,015 | 1,814,174 | 2,264,431 | 2,599,994 |
| Year | 2014 | 2015 | 2016 | 2017 | 2018 |
| Participation | 2,775,884 | 2,775,137 | 2,776,331 | 2,715,633 | 2,616,876 |
Percentage of female runners in 5-kilometer races: 61.2% (1,601,696 out of 2,616,876 runners)
- In the last 18 years, there are more female than male runners in the 5K races.
- Female participation has increased by 876% since 2000 (from 164,077 to 1,601,696 participants per year)
- Male participation has increased by 511% (from 166,239 to 1,015,180 participants per year).
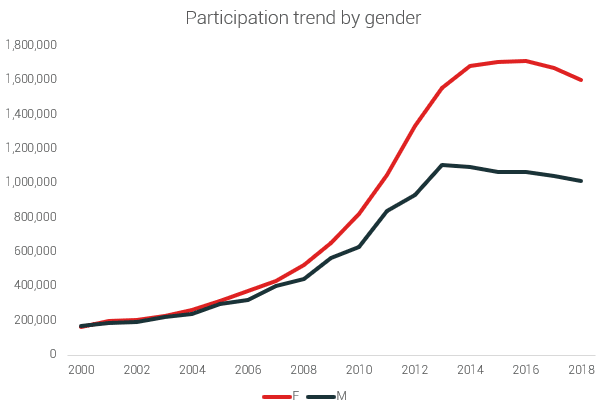
- Female participation has declined by 6% since 2016 (from 1,710,395 to 1,601,696 participants)
- Male participation is in decline since 2013. It has declined by 8% since then (from 1,104,688 to 1,015,180 participants).
|
Year |
2009 | 2010 | 2011 | 2012 | 2013 |
| Female participation | 650,552 | 820,531 | 1,049,746 | 1,331,213 | 1,553,959 |
| Male participation | 566,751 | 626,484 | 837,339 | 933,218 | 1,104,688 |
|
Year |
2014 | 2015 | 2016 | 2017 | 2018 |
| Female participation | 1,683,388 | 1,702,696 | 1,710,395 | 1,668,291 | 1,601,696 |
| Male participation | 1,092,496 | 1,066,462 | 1,065,936 | 1,038,607 | 1,015,180 |
- Increase in the proportion of women runners: More than 10% over the past 19 years.
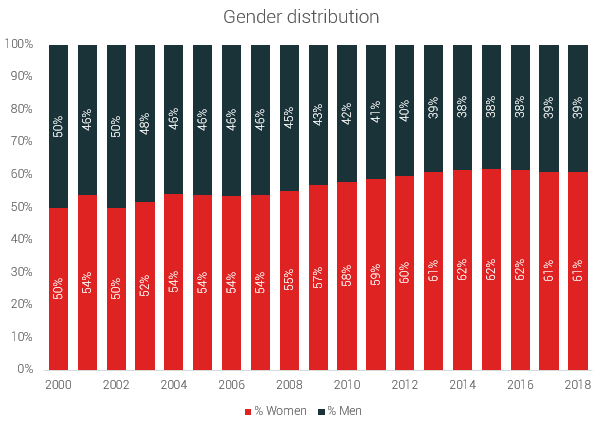
| Year | 2009 | 2010 | 2011 | 2012 | 2013 |
| % Women | 56.7% | 57.7% | 58.7% | 59.5% | 60.8% |
| % Men | 43.3% | 42.3% | 41.3% | 40.5% | 39.2% |
| Year | 2014 | 2015 | 2016 | 2017 | 2018 |
| % Women | 61.5% | 61.7% | 61.6% | 61.0% | 61.0% |
| % Men | 38.5% | 38.3% | 38.4% | 39.0% | 39.0% |
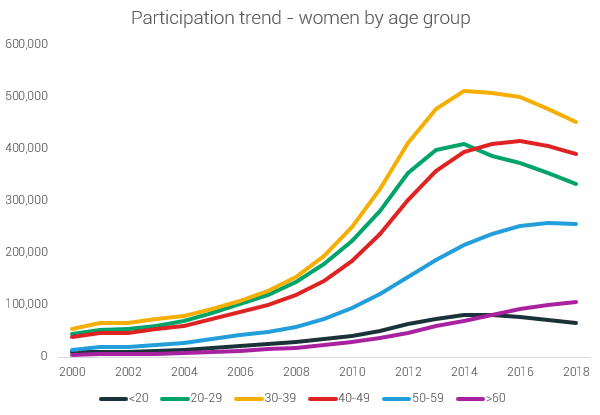
- The biggest decline in participation in the last 5 years is among the women in their 20s and 30s.
- The only age group that has increased continuously is of the participants over 50.
| Year | 2009 | 2010 | 2011 | 2012 | 2013 |
| <20 | 5.2% | 5.2% | 5.0% | 4.9% | 5.2% |
| 20-29 | 24.2% | 24.0% | 24.2% | 24.3% | 22.2% |
| 30-39 | 29.1% | 29.3% | 29.5% | 29.9% | 29.0% |
| 40-49 | 23.3% | 23.4% | 23.5% | 23.2% | 24.0% |
| 50-59 | 13.1% | 13.1% | 13.0% | 12.8% | 14.1% |
| >60 | 5.0% | 5.0% | 4.9% | 4.8% | 5.5% |
| Year | 2014 | 2015 | 2016 | 2017 | 2018 |
| <20 | 5.0% | 4.9% | 4.6% | 4.5% | 4.1% |
| 20-29 | 20.9% | 20.1% | 20.0% | 19.7% | 19.1% |
| 30-39 | 28.6% | 27.9% | 27.4% | 27.0% | 27.2% |
| 40-49 | 24.5% | 24.6% | 24.4% | 24.1% | 24.1% |
| 50-59 | 15.1% | 15.9% | 16.3% | 16.7% | 17.0% |
| >60 | 6.0% | 6.7% | 7.2% | 7.9% | 8.5% |
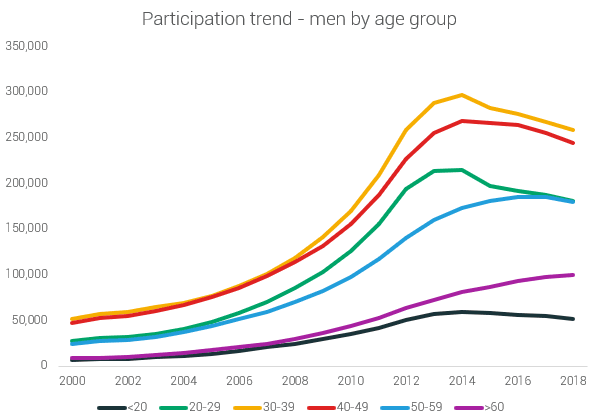
- The sharpest decline in male participation is among the participants between 20 and 50.
- There's an increase among the male participants over 60.
| Year | 2009 | 2010 | 2011 | 2012 | 2013 |
| <20 | 29,156 | 34,654 | 42,055 | 50,835 | 57,021 |
| 20-29 | 103,353 | 126,022 | 156,017 | 194,298 | 213,159 |
| 30-39 | 140,969 | 169,655 | 209,012 | 258,229 | 288,003 |
| 40-49 | 132,021 | 155,344 | 187,649 | 226,849 | 255,203 |
| 50-59 | 81,851 | 97,144 | 116,982 | 139,931 | 159,914 |
| >60 | 36,131 | 43,663 | 52,714 | 63,076 | 72,734 |
| Year | 2014 | 2015 | 2016 | 2017 | 2018 |
| <20 | 59,376 | 58,165 | 56,477 | 54,485 | 51,218 |
| 20-29 | 214,294 | 197,683 | 192,072 | 187,061 | 180,464 |
| 30-39 | 296,804 | 282,928 | 275,955 | 267,508 | 259,002 |
| 40-49 | 268,122 | 266,187 | 263,714 | 255,803 | 244,037 |
| 50-59 | 173,295 | 180,395 | 184,772 | 184,784 | 180,242 |
| >60 | 80,604 | 87,082 | 92,945 | 97,701 | 100,216 |
5 kilometer races - finish time statistics in the US
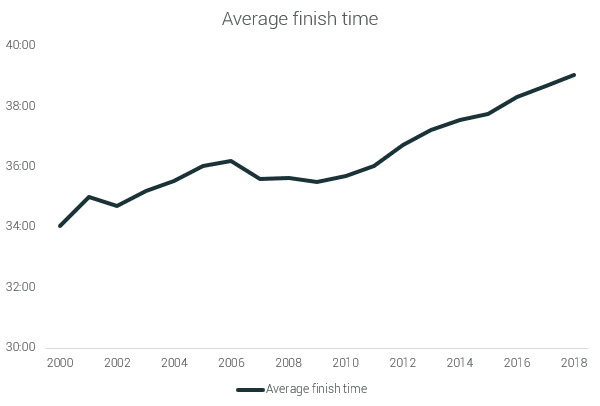
Average 5k finish time: 39:02 mins
- The average finish time of 5K runners has increased by 14.7% (from 34:02 min to 39:02 min).
| Year | 2009 | 2010 | 2011 | 2012 | 2013 |
| Average finish time | 35:30 | 35:42 | 36:02 | 36:44 | 37:12 |
| Year | 2014 | 2015 | 2016 | 2017 | 2018 |
| Average finish time | 37:34 | 37:45 | 38:19 | 38:41 | 39:02 |
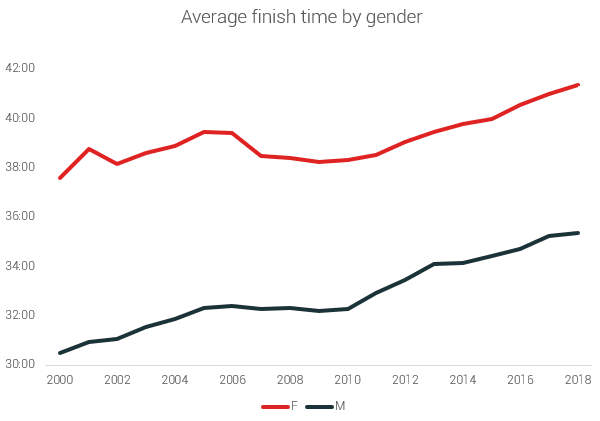
- Average 5k finish time for men: 35:22 min
- Average 5k finish time for women: 41:21
- Both of the sexes have slowed down.
- Men have slowed down more - 15.9% (from 30:30 min to 35:22 min).
- Women have slowed down by 10% (from 37:36 to 41:21 min).
| Year | 2009 | 2010 | 2011 | 2012 | 2013 |
| Female | 38:13 | 38:20 | 38:31 | 39:02 | 39:27 |
| Male | 32:12 | 32:17 | 32:56 | 33:27 | 34:06 |
| Year | 2014 | 2015 | 2016 | 2017 | 2018 |
| Female | 39:47 | 39:59 | 40:34 | 40:59 | 41:21 |
| Male | 34:09 | 34:26 | 34:42 | 35:15 | 35:22 |
- The younger female participants have slowed down more than the older ones in general.
- The youngest female participants have slowed down by 12% (from 34:30 to 38:38 min).
- The ones in their 20s have slowed down by 8.1% (from 35:51 to 38:44 min).
- The ones in their 30s have slowed down by 10.7% (from 36:21 to 40:13 min).
- The ones in their 40s have slowed down by 7.3% (from 38:51 to 41:40 min).
- The participants in their 50s have slowed down by just 0.3% (from 43:48 to 43:57 min).
- The participants over 60 have slowed down just by 1.5% (from 47:58 to 48:41 min).
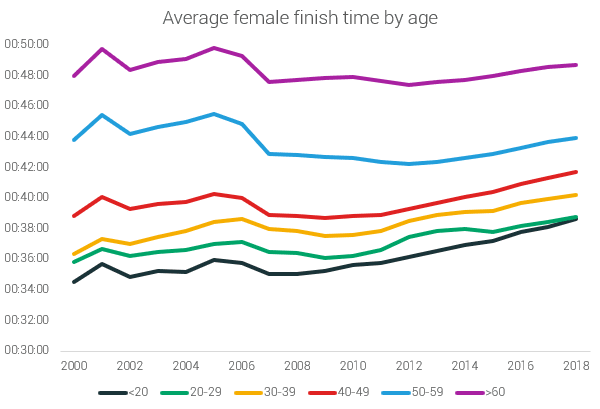
| Year | 2009 | 2010 | 2011 | 2012 | 2013 |
| <20 | 35:15 | 35:37 | 35:46 | 36:08 | 36:34 |
| 20-29 | 36:05 | 36:14 | 36:38 | 37:29 | 37:52 |
| 30-39 | 37:32 | 37:35 | 37:49 | 38:30 | 38:53 |
| 40-49 | 38:42 | 38:49 | 38:54 | 39:18 | 39:42 |
| 50-59 | 42:40 | 42:38 | 42:22 | 42:12 | 42:22 |
| >60 | 47:50 | 47:56 | 47:40 | 47:24 | 47:34 |
| Year | 2014 | 2015 | 2016 | 2017 | 2018 |
| <20 | 36:56 | 37:13 | 37:45 | 38:06 | 38:38 |
| 20-29 | 37:59 | 37:48 | 38:12 | 38:27 | 38:44 |
| 30-39 | 39:07 | 39:10 | 39:39 | 39:57 | 40:13 |
| 40-49 | 40:05 | 40:22 | 40:56 | 41:20 | 41:40 |
| 50-59 | 42:35 | 42:51 | 43:18 | 43:38 | 43:57 |
| >60 | 47:44 | 47:57 | 48:18 | 48:33 | 48:41 |
- Men - all age groups have slowed down similarly.
- The youngest participants have added 15.5% to their average (from 27:15 to 31:28 min).
- The participants in their 20s have slowed down by 13.1% (from 29:27 to 33:19 min).
- The ones in their 30s - by 15.4% (from 30:00 to 34:36 min).
- The ones in their 40s - by 16.5% (from 30:23 to 35:24 min).
- The ones in their 50s - by 12.9% (from 32:24 to 36:24 min)
- The ones over 60 - by 16.9% (from 34:49 to 40:42 min).
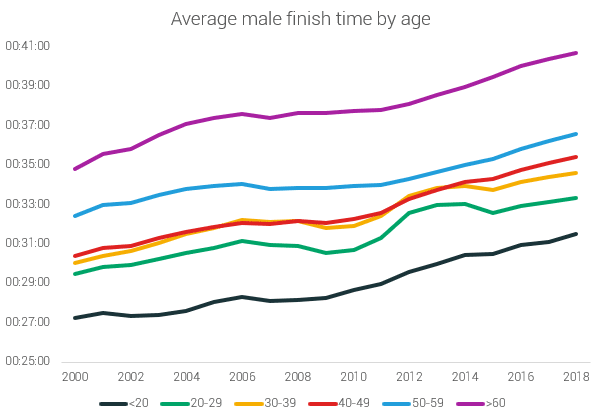
| Year | 2009 | 2010 | 2011 | 2012 | 2013 |
| <20 | 28:16 | 28:38 | 28:56 | 29:35 | 29:59 |
| 20-29 | 30:33 | 30:42 | 31:18 | 32:33 | 32:58 |
| 30-39 | 31:48 | 31:54 | 32:23 | 33:24 | 33:50 |
| 40-49 | 32:04 | 32:15 | 32:35 | 33:17 | 33:45 |
| 50-59 | 33:48 | 33:55 | 33:59 | 34:18 | 34:37 |
| >60 | 37:39 | 37:44 | 37:46 | 38:05 | 38:31 |
| Year | 2014 | 2015 | 2016 | 2017 | 2018 |
| <20 | 30:25 | 30:30 | 30:57 | 31:05 | 31:28 |
| 20-29 | 33:00 | 32:32 | 32:54 | 33:06 | 33:19 |
| 30-39 | 33:56 | 33:44 | 34:09 | 34:23 | 34:36 |
| 40-49 | 34:07 | 34:17 | 34:45 | 35:06 | 35:24 |
| 50-59 | 34:58 | 35:19 | 35:48 | 36:12 | 36:34 |
| >60 | 38:57 | 39:27 | 40:00 | 40:23 | 40:42 |
Age stats for US 5K runs
Average age of 5k runners: 40.1 years old
Average age of male 5k runners: 40.9 years old
Average age of female 5k runners: 39.6 years old
- There is a decline in participants in their 30s and an increase in participants over 50.
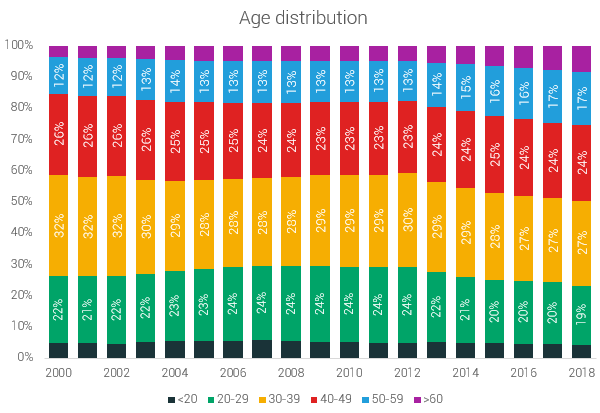
| Year | 2009 | 2010 | 2011 | 2012 | 2013 |
| <20 | 5.2% | 5.2% | 5.0% | 4.9% | 5.2% |
| 20-29 | 24.2% | 24.0% | 24.2% | 24.3% | 22.2% |
| 30-39 | 29.1% | 29.3% | 29.5% | 29.9% | 29.0% |
| 40-49 | 23.3% | 23.4% | 23.5% | 23.2% | 24.0% |
| 50-59 | 13.1% | 13.1% | 13.0% | 12.8% | 14.1% |
| >60 | 5.0% | 5.0% | 4.9% | 4.8% | 5.5% |
| Year | 2014 | 2015 | 2016 | 2017 | 2018 |
| <20 | 5.0% | 4.9% | 4.6% | 4.5% | 4.1% |
| 20-29 | 20.9% | 20.1% | 20.0% | 19.7% | 19.1% |
| 30-39 | 28.6% | 27.9% | 27.4% | 27.0% | 27.2% |
| 40-49 | 24.5% | 24.6% | 24.4% | 24.1% | 24.1% |
| 50-59 | 15.1% | 15.9% | 16.3% | 16.7% | 17.0% |
| >60 | 6.0% | 6.7% | 7.2% | 7.9% | 8.5% |
- For this reason, there is an increase in the average age of participants.
- The average age of female participants has risen more than males.
- For women, there is an increase of 12.4% in their average age (from 35.25 to 39.6 years)
- For men - an increase of 5% (from 38.97 to 40.92 years).
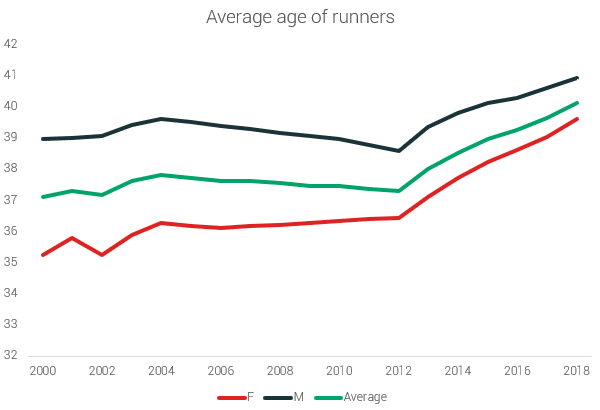
| Year | 2009 | 2010 | 2011 | 2012 | 2013 |
| F | 36.26 | 36.35 | 36.39 | 36.44 | 37.11 |
| M | 39.06 | 38.98 | 38.76 | 38.58 | 39.36 |
| Average | 37.47 | 37.46 | 37.37 | 37.30 | 37.99 |
| Year | 2014 | 2015 | 2016 | 2017 | 2018 |
| F | 37.72 | 38.22 | 38.62 | 39.04 | 39.60 |
| M | 39.80 | 40.14 | 40.30 | 40.61 | 40.92 |
| Average | 38.52 | 38.95 | 39.26 | 39.65 | 40.12 |
Recreational records in 5K runs in the United States
American recreational 5k record: 15:37
American recreational female 5k record: 16:34
- The record recreational finish times have actually gone slightly down over the last 10 years.
- The fastest women are now 4 seconds faster.
- The fastest men have improved by 11 seconds.
- And overall - by 7 seconds.
| Year | 2009 | 2010 | 2011 | 2012 | 2013 |
| F | 00:16:38 | 00:16:38 | 00:16:37 | 00:16:36 | 00:16:37 |
| M | 00:15:48 | 00:15:47 | 00:15:44 | 00:15:41 | 00:15:43 |
| Average | 00:16:09 | 00:16:09 | 00:16:07 | 00:16:05 | 00:16:06 |
| Year | 2014 | 2015 | 2016 | 2017 | 2018 |
| F | 00:16:36 | 00:16:35 | 00:16:35 | 00:16:35 | 00:16:34 |
| M | 00:15:41 | 00:15:40 | 00:15:38 | 00:15:38 | 00:15:37 |
| Average | 00:16:05 | 00:16:04 | 00:16:02 | 00:16:02 | 00:16:02 |
| Percentile | Women | Men |
| 1st percentile | 00:19:29 | 00:17:49 |
| 10th percentile | 00:25:16 | 00:22:06 |
| 20th percentile | 00:28:10 | 00:24:38 |
| 30th percentile | 00:30:41 | 00:26:48 |
| 40th percentile | 00:33:20 | 00:28:56 |
| 50th percentile | 00:36:24 | 00:31:18 |
| 60th percentile | 00:40:14 | 00:34:15 |
| 70th percentile | 00:45:05 | 00:38:17 |
| 80th percentile | 00:50:25 | 00:44:24 |
| 90th percentile | 00:56:31 | 00:53:22 |
Other stats
Who is the typical 5K runner?
Average US female runner
Demographics
- Average Age: 39.6
- 61.9 % Married
- 78.7 % College educated
- 69.0 % Earn a household income of $75,000+
Running History
- Average number of years running: 11 years
- Average number of running events participated in during the last 12 months: 7 events
- 53.9% have completed 1 marathon or more in their lifetime
Running Routine
- 74.7 % Run/Jog 4+ hours each week
- 80.1 % run 12 months a year
- Average number of days run per week: 4.1
- Average number of miles run per week: 23
- 64.8 % describe themselves as Frequent/Fitness Runners
Motivation
- Primary motivation to start running: For Exercise (25.3%)
- Weight Concerns (13.8%)
- Motivation to continue to run: Staying in Shape (75.5%)
- Staying Healthy (74.8%)
- Relieving Stress (62.4%)
Health
- Average Weight: 136.2
- Average Body Mass Index (BMI): 22.6
- 43.0% are content with their weight
- 44.7% are content with their fitness level
Average US male runner
Demographics
- Average Age: 40.9
- 73.5% Married
- 78.8% College educated
- 76.4% Earn a household income of $75,000+
Running History
- Average number of years running: 16 years
- Average number of running events participated in during the last 12 months: 9 events
- 67.9% have completed 1 marathon or more in their lifetime
Running Routine
- 79.2% Run/Jog 4+ hours each week 8
- 2.5% run 12 months a year
- Average number of days run per week: 4.5
- Average number of miles run per week: 29.5
- 55.8% describe themselves as Frequent/Fitness Runners’ and 32.7% as “Serious Competitive Runners’
Motivation
- Primary motivation to start running: For Exercise (22.0%),
- Competed in School and Never Stopped (15.2%)
- Motivation to continue to run: Staying in Shape (75.2%),
- Staying Healthy (70.8%)
- Having Fun (58.9%)
Health
- Average Weight: 171.2
- Average Body Mass Index (BMI): 24.2
- 47.7% are content with their weight
- 45.9% are content with their fitness level
About RunRepeat
At RunRepeat.com, we test all the shoes on our own: on the runs and in our lab. Lab tests allow us to publish the most unbiased reviews out there because every shoe is subjected to the same test under the same conditions and using the same instruments over and over again. We also provide in-depth studies. Learn more about us on our about page.
