Fun in the Mud - Trends In Obstacle Course Racing
In this article, we explore the development of obstacle course racing (OCR) in the last 8 years. For this reason, we have analyzed 3,698,112 results from 1,825 events held in the USA between 2010 and 2017.
Key Result
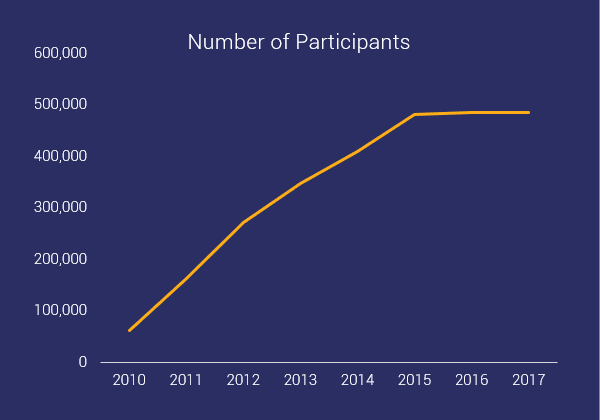
The following graphs show that obstacle course racing has become increasingly more popular over the last 8 years. Attracting ever more participants. The data also shows, that in 2015 a saturation of the market occurs. And since then the numbers of the participants are quite stable. This coincides with OCR starting to grow worldwide and some of the biggest races starting to expand abroad.
Development of OCR
In modern days obstacle course racing begins in 1987 with the Tough Guy races in the UK. It was quickly followed by the HiTec Adventure racing, which requires biking and equipment. After that, The Competitor Group starts The Muddy Buddy races in the US (1999-2010), and they are the event that transitioned adventure racing into the obstacle course racing we know today.
Though obstacle course racing isn't new, it started its exponential growth around 2010. In this article, we take a look at the period 2010-2017, to track the extraordinary growth of this sport.
As we can see from the above graph the number of participants shoots up from 2010 onward. The number of participants has risen 6.88 fold from 2010 until 2017.
The most popular races in 2017
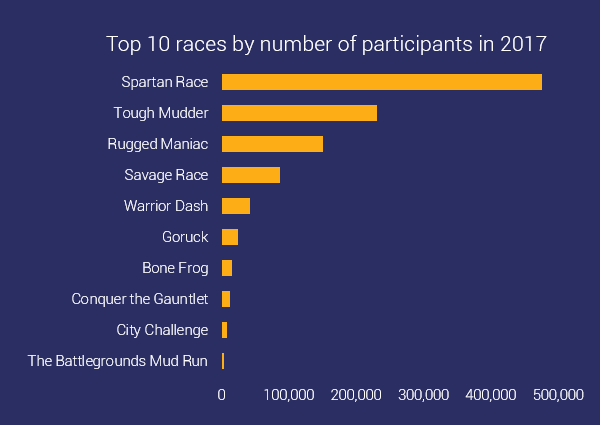
Analysing the publicly available information we were able to obtain the following rankings.
Why are these races so popular and what makes them unique?
Spartan Race - One of the things that makes it unique is that it's timed. The Spartan race is an actual race and not just a mud run. Spartan events deliver the terrain, obstacles, and distances that allow you to test your skills and see how your time measures up against the competition or your own personal goal. When you don't complete an obstacle, there is 30 burpee penalty waiting for you. Also, there are a variety of distances to choose from, with different amount of obstacles, so everybody can choose the appropriate challenge for them.
Tough Mudder - What participants find unique about the race is that the focus is on fun and comradery. How people are making friends and are helping each other to overcome the obstacles and pushing each other to give your best. The events are in the longer distance category (over 10 miles long). There is no timing. The goal is to push yourself and to finish. At the finish line, you get a beer.
Rugged Maniac - Rugged Maniac is the largest entry-level obstacle course race in North America. The focus is on creating the perfect balance of fun and physicality that appeals to people of all fitness levels, not just extreme athletes. There are no water baths or punishments if you don't overcome an obstacle. The race goes with a rocking day-long festival with DJ's and beer.
Savage Race - The Savage Races are shorter (4 to 6 miles) but definitely badass. It's not about the running, but the obstacles. Definitely not for novices. The point is the participants to be pushed to their limits, so there are ice baths, fire jumps and so much more.
Warrior Dash - It's a 3-mile fun race. The motto of the race is that anyone can start and anyone can finish. Though it's not to be underestimated. People can team up and help each other during the race. There is no clock. And there is a festival waiting at the end.
Goruck - Goruck is different from the popular notion for OCR. They offer a multitude of events and there is only one that might be considered a "race" in the traditional sense. The Challenge events are based on Special Operations training and are led by a Cadre on an unknown route for 6,12 or 24 hours depending on the event.
Bone Frog - The Bone Frog Challenge is created by navy seals to help you challenge your self to the extreme. The obstacles are more concentrated and much different from the other races. There are more rope-related and more water obstacles.
Conquer the Gauntlet - It's a family owned and run enterprise. And it's a safe, family-friendly event. The terrain is flat. But the obstacles are different and harder from the ones in the corporate-run OCRs. Some have 82% fail rate. And you get a medal only if you complete all obstacles.
City Challenge - It takes OCR into urban areas. It takes out the mud out from the typical races and makes something different. The race is timed and there are penalties for not completing an obstacle.
The Battlegrounds Mud Run - It's the largest permanent obstacle course. It's short - 3.2 miles but packed with more than 30 military themes obstacles to challenge anyone. And after you finish, there's a winery nearby.
General trends
Let's take a look at how the average number of participants in a race changes through the years.
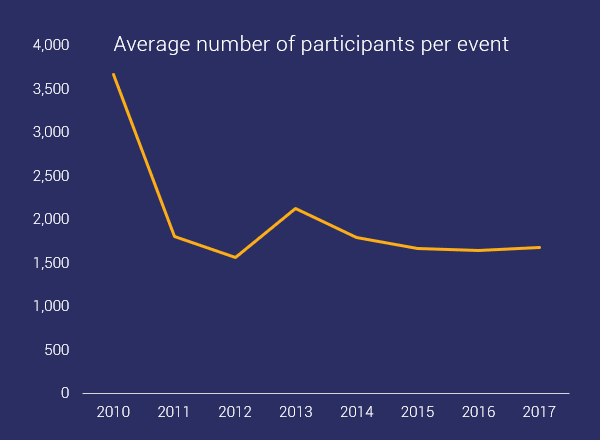
After 2010, when the popularity of OCR rises, then the number of events rises almost in concert with the increased participation. For this reason, from 2011 onward the average number of participants per events remains stable.
In obstacle course racing there are no standard distances. There are no 5K, 10K and so on as in running. So, to make the analysis more concise we have divided the races into 3 categories - short (less than 5 miles). medium length (between 5 and 10 miles) and long (more than 10 miles).
The number of participants in the different distances changes as follows:
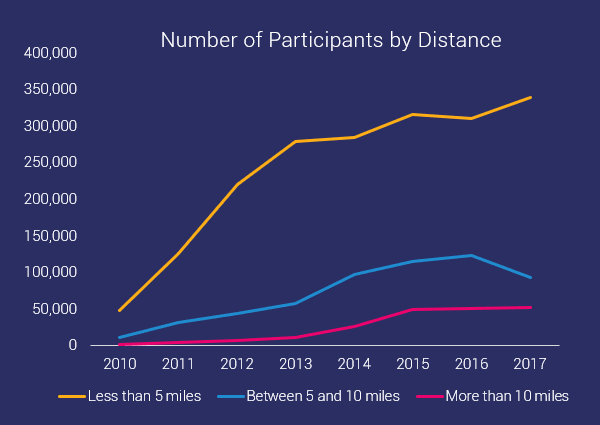
From 2010 to 2017 the participants in the short distance races have increased 6 fold. The participants in the medium distance races have increased 7 fold. And in the long distance have increased the most - 39 times.
Let's see also the average number of participants per event for the three distances.
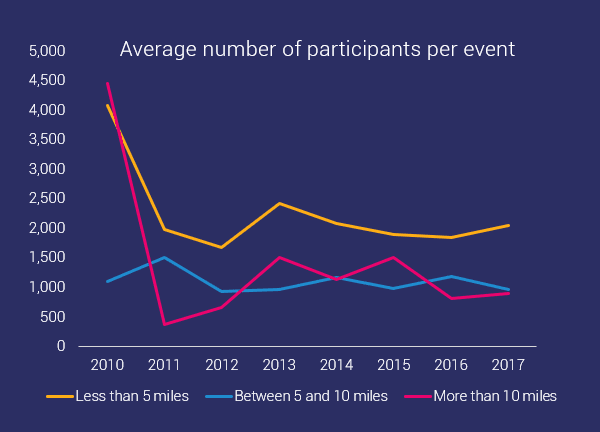
Here we observe a similar trend. After 2011, the average number of participants per race remains relatively constant. With short races, attracting most participants per event.
Mars vs. Venus
Now let's look at the participation trends of men and women.
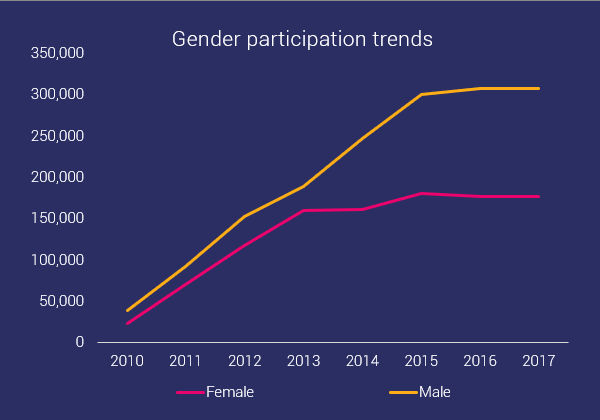
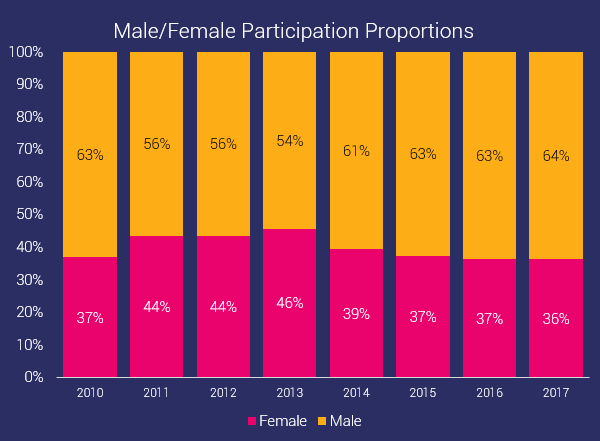
Both male and female participation has been climbing steadily since 2010. And for men, this does not just mean a greater number of participants. The rate at which male participant numbers are increasing is significantly greater than women's. Male participation has increased 7 times and female participation has increased 6.7 times. This might not seem like a big difference, but let's take a look at the gender distribution of the participants.
This graph shows that proportionally women have been declining since 2013.
Now let's look at the participation trends of both genders, divided by distance.
Short distance gender distribution
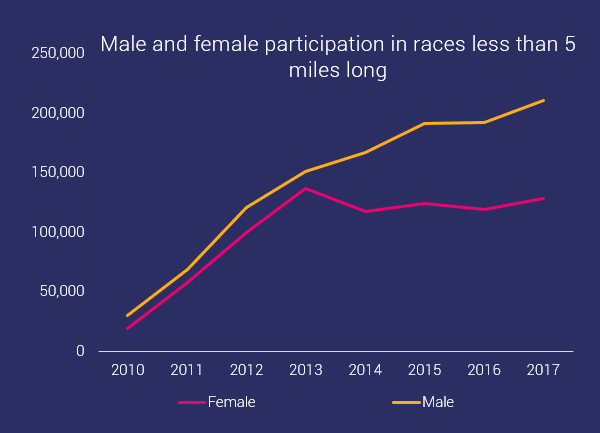
At the short distance, we can see that male participation continually rises. And from 2010 to 2017, there is a 6 fold increase.
For women, it's a bit of a different story. Female participation was at an all-time high in 2013. Before that, in the period 2010 to 2013, there is 6.25 fold increase in the participation. And from 2014 to 2017, there is actually a decline of 6%.
Let's now see how this translates into gender distribution for the short distance races.
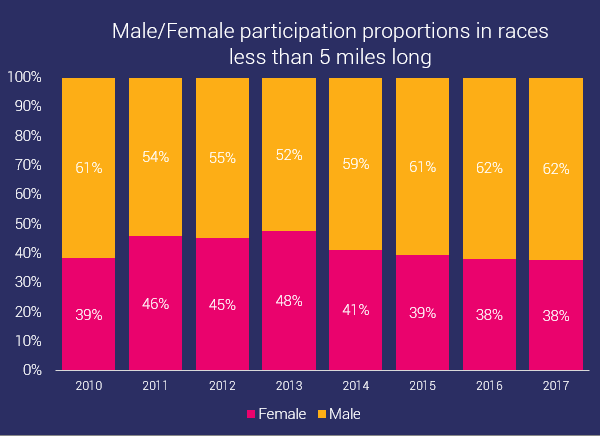
As we can see, this distribution follows closely the general trend. But here, for the short distance, the proportion of female participants is around 2% higher than the average for all distances combined.
Medium distance gender distribution
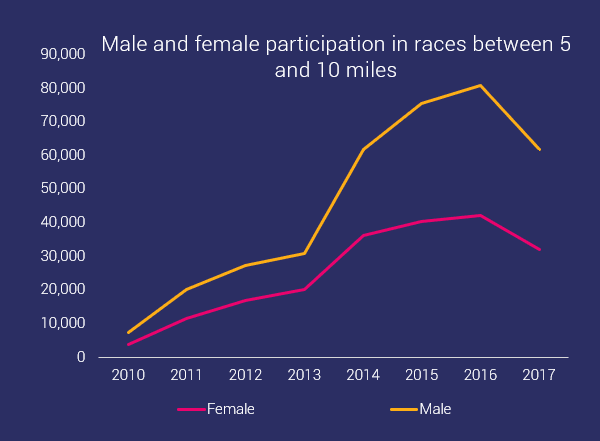
Here we see, that there is a steep rise in participation for both men and women until 2016. However, in 2017 both genders experience a decline.
For the period 2010-2016 male participation has increased 9.9 fold. And between 2016 and 2017 there is a 24% decline in participation in those distances.
For women, it is similar - there is 10.8 fold increase in participation between 2010 and 2016. And there is again 24% decline in participation from 2016 to 2017.
As gender distribution, this trend translates to the following.
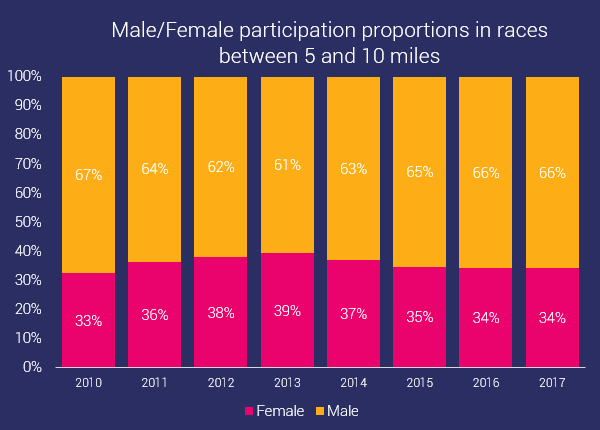
Here we see again, that the proportion of women mimics the general trend. But the percentages are on average 3% lower than the average for all distances.
Long distance gender distribution
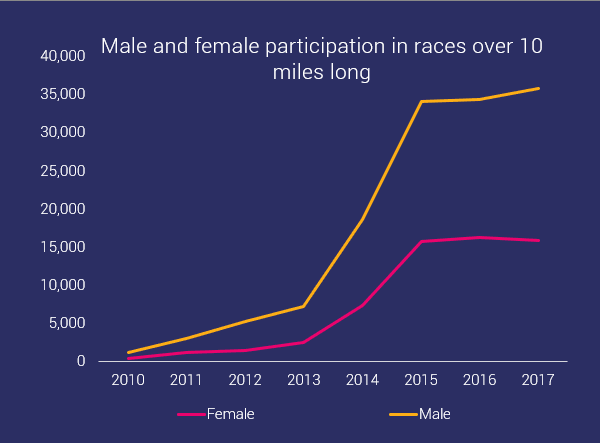
The participation in long-distance races has had the biggest increase. Despite the leveling off after 2015.
For the period 2010-2017 male participation has increased 30 fold, and female participation - 45 fold. This is huge. It looks like with OCR going more and more mainstream people start craving even bigger challenges.
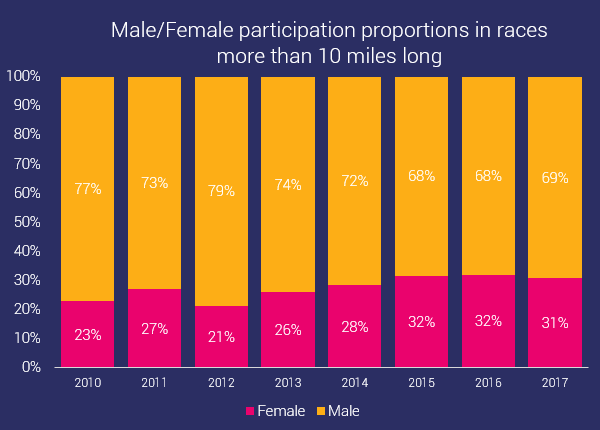
The results for women are particularly interesting. They suggest that while participation rates for women tend to be lower than for men, those that do participate seem to gravitate, in increasingly larger numbers, to longer distances. For this distance, the proportion of women involved is on the rise since 2013.
Distributions of female and male participants by distance
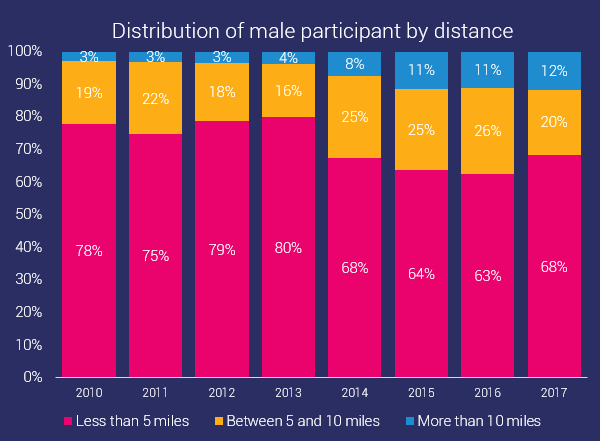
As we can see the distribution of male participants among the 3 distances is quite stable until 2013. From 2014 onward, the interest of men in the longer and more challenging races climbs.
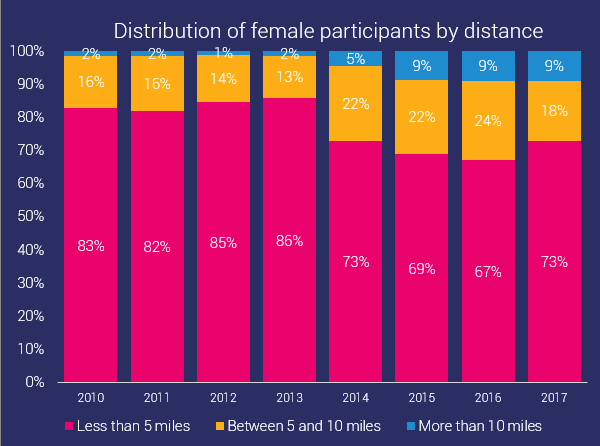
For women we see, similar trend, until 2013, the distribution of women between distances is quite stable. But after that, the interest in the longer distances is climbing substantially.
It is interesting to note, that the interest of women in the longer and harder races climbs faster than that of men. And this difference is statistically significant. Go, women!
One can speculate that these increase in the participation in the longer distances, coincides with the introduction of the trifecta medals into the Spartan races in 2014. The trifecta medal is earned, when you complete a short, a medium and a long distance Spartan race in one calendar year (In Spartan race terminology, these are the Sprint (4 miles), the Super (8 miles) and the Beast (12 miles)). The trifecta medal is a huge incentive for a lot of people to push themselves harder and strive for a bigger accomplishment. Though Spartan is far from the only OCR, they might have lighted the spark in the participation in the other longer races as well.
Age trends
Now, let's look at the age distribution of the participants.
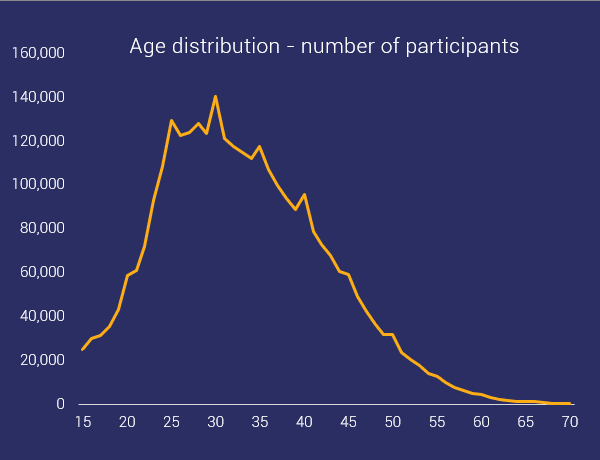
General age distribution
We can see that the distribution is left-skewed, which suggests that OCR tends to attract younger participants. This may be due to the strenuous physical demands or the novelty of the events. As the graph shows, the peek participation is at age 30.
Now, let's look at the distribution also in terms of frequencies.
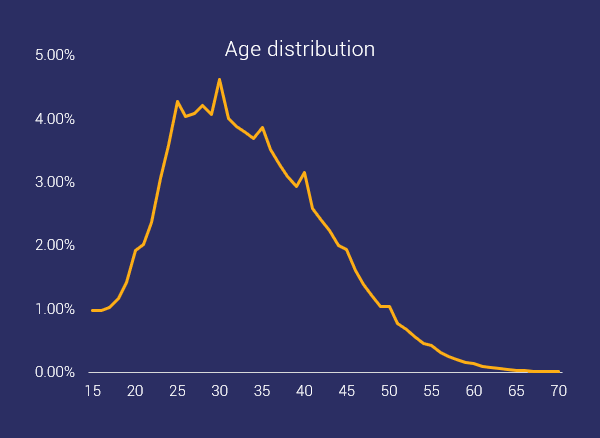
Here, we can see that there are peaks in participation at the milestone ages - the ones ending in 5 and 0. This is consistent with the behavior of marathon runners.
Age distribution by gender
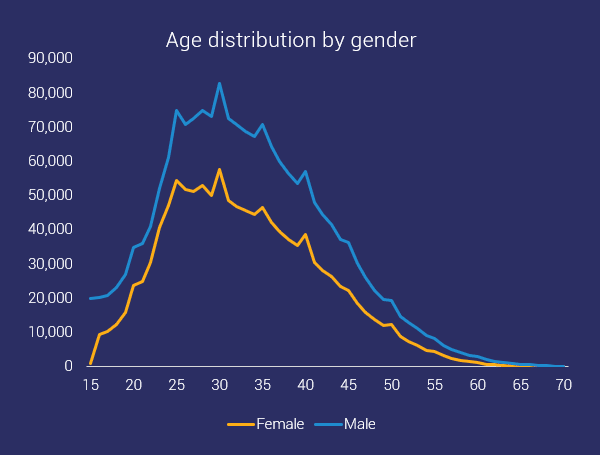
Even though men are participating more, the age distribution of the participants of both genders follows a similar pattern. This is more evident from the frequency graph.
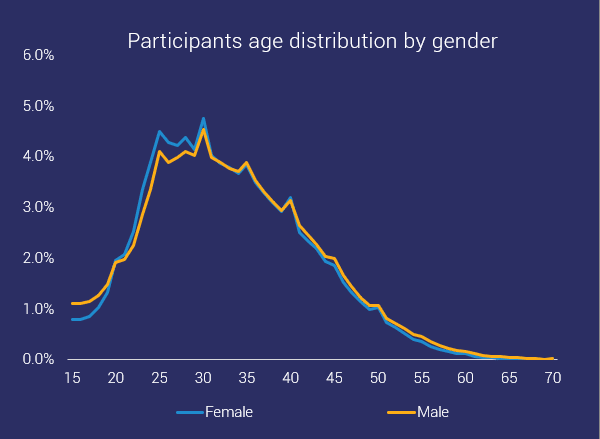
On this graph, the distributions almost completely overlap.
Both men and women have higher participation rates in the milestone ages - the ones ending in 0 or a 5. There are significant differences between the participation at ages before and after the milestone (for example 29 and 31) compared to the milestone age (30).
For women, the spikes are slightly more pronounced - their participation peaks by an average of 13%. For men, this percentage is 11.2%.
Age distribution by distance
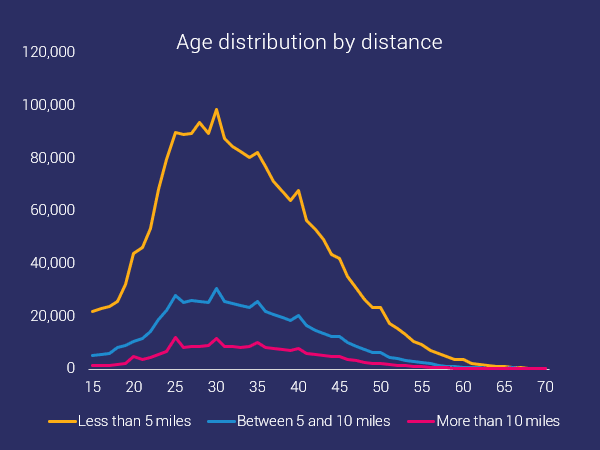
As we know, the longer the distance, the smaller the participation. But still, the frequency distributions for the different distances almost overlap.
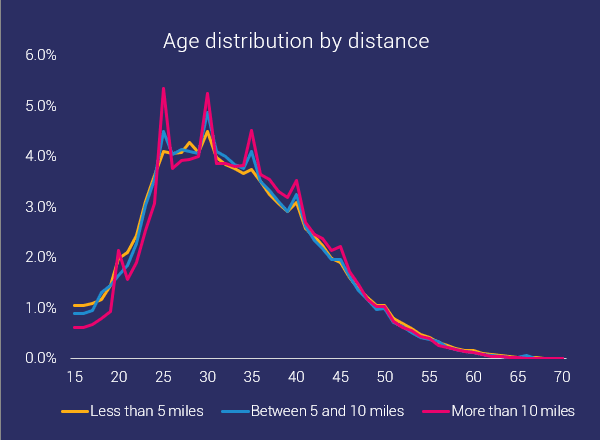
The graph clearly shows that people race more when they are at a milestone age (age ending in 0 or 5). For example, participants age 35 are clearly more than 34 and 36 year-olds. It is worth noting that the longer distances produce bigger spikes in the milestone ages. For the short races, in the milestone ages, the spike in participation is on average 9.2%. For the mid-length distances, it's 15.8%. While for the long-distance races it's 26.8%.
This seems justified, as completing a long distance race is a bigger accomplishment and more likely to get on your "bucket list".
State comparisons
Now, let's look at which states have the biggest number of participants.
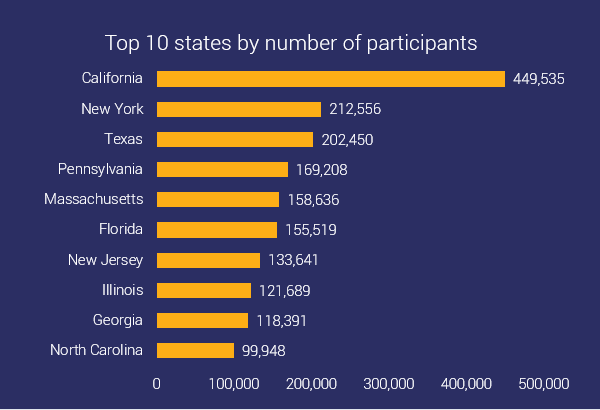
Here California is in the lead.
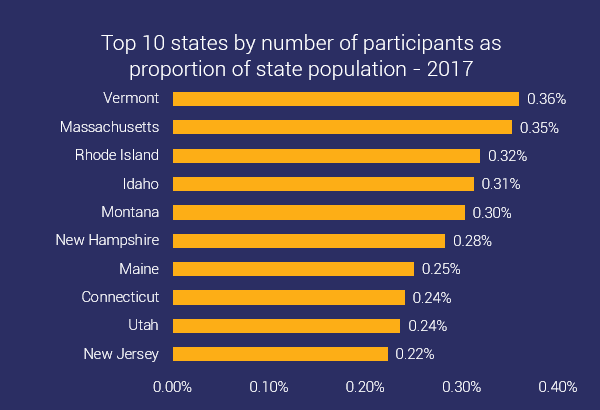
The picture becomes different if we take the number of participants weighted by the state's population. For 2017 Vermont is in the lead. And California doesn't even make it in the top 10.
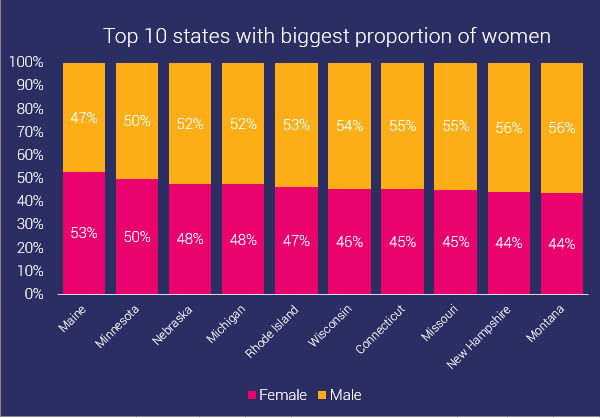
Also, it's interesting to see the 10 states, with the highest proportions of female participants. Here Main takes the lead with over 50%.
The 10 states with the least female participation are as follows
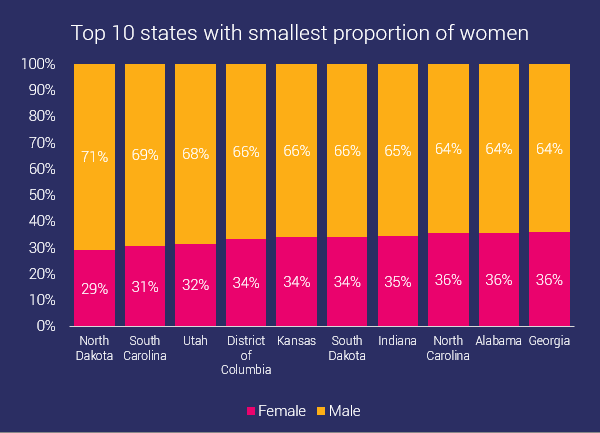
With North Dakota being the state with the least female participants - just under 30%.
Participation of foreigners
In the races conducted in the US in the last 8 years, there have been participants from more than 100 countries. The top 10 countries with most participants are
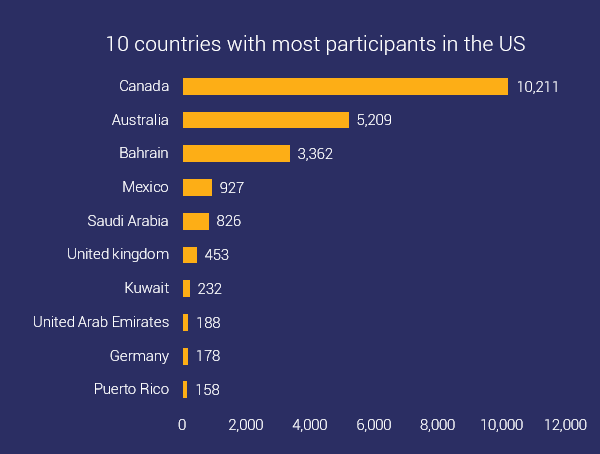
With Canada taking the lead.
Also, it is interesting to note that 4 of the top 10 countries are from the Middle East. This could be due to the rise of the numbers of middle eastern tourists in the US. And also, the lack of obstacle course races, up to this point, in their countries.
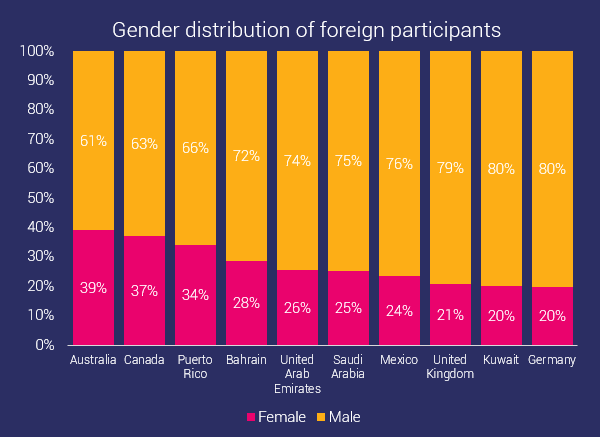
From the foreign participants, most women come from Australia. Women, in general, make up 36% of the foreign participants, which is close to the average for the US (35.7%).
The distribution of the foreign participant by distance is as follows
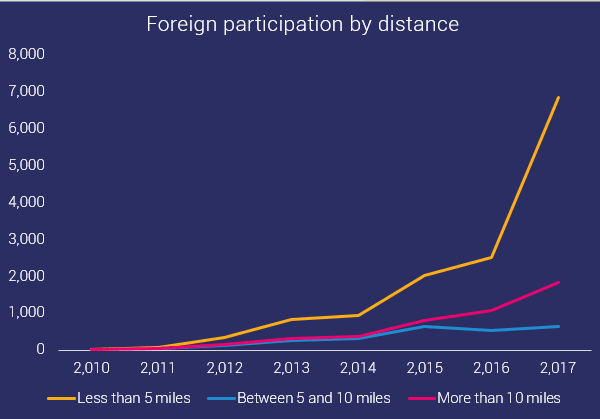
With the highest participation in the shortest races. The second most popular distance is more than 10 miles. And least participants run in the medium length events.
In the 3 different distance groups, there is a rise in participation. The biggest increase is in the shortest races, with 118 times increase in participation since 2010. Next are the long-distance races with 50 fold increase. And as with the participation, the smallest increase is in the medium-length events - 12 fold.
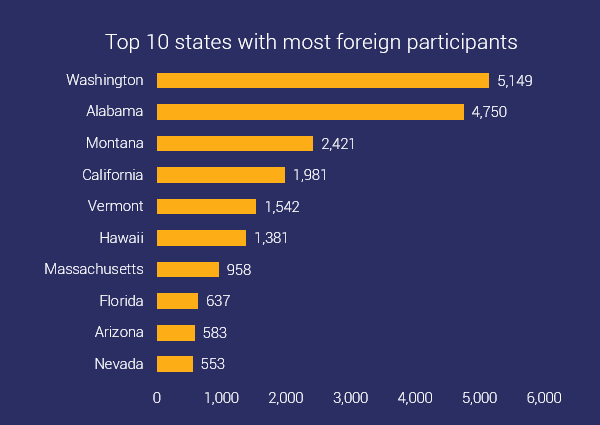
The top 10 states, which attract most foreigners are the following
Future of OCR
As we can see, OCR is a dynamically evolving sport, which is gaining a lot of popularity. More and more people find it as a fun way to connect with their bodies and nature and to have some fun while challenging themselves physically.
There is also hype around making OCR an Olympic sport. The biggest proponent of this idea is Joe De Senna, founder, and CEO of Spartan Race. For this reason, the best chance of this happening is at the Olympics in 2028, which will be in Los Angeles. The reason is that the host of the Olympics can exert influence in the choice of new Olympic sports.
About RunRepeat
This research has been conducted and presented by Vania A. Nikolova, Ph.D. in Mathematical Analysis and OCR enthusiast.
At RunRepeat.com we buy all the shoes on our own and then do in-house testing (wear testing and lab testing). We focus our best efforts on helping people find the right pair of shoes whether they prefer walking, running, training, fitness, CrossFit or weight lifting.
We also do some in-depth studies. Find out more about us on our about page.
