Aussies Have Never Been Slower
For this study, we analyzed all available marathon results from all marathons conducted in Australia from the year 2000 to 2016. Our database consists of 183,061 results from 154 different races. And the conclusion is clear - Australians are getting slower.
In this study, we analyze how Australian finish times are changing. Also, we examine the influence of some health parameters on their overall performance.
Feel free to use any material of this page as long as you reference the original source

Key result
Thie following graph shows the average finish times of Australians for the last 17 years. And 2016 is the slowest one yet.
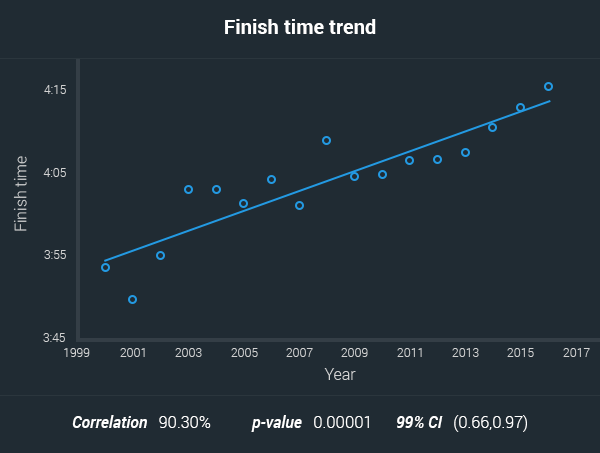
As we can see this trend is 99% statistically significant.
Now, let's get into the details.
Possible reasons
Increase in participation
As we know, marathon running is getting more and more popular. Australia is not an exception to this trend. In the last 17 years, the number of participants in marathons per year has risen 8.5 fold.
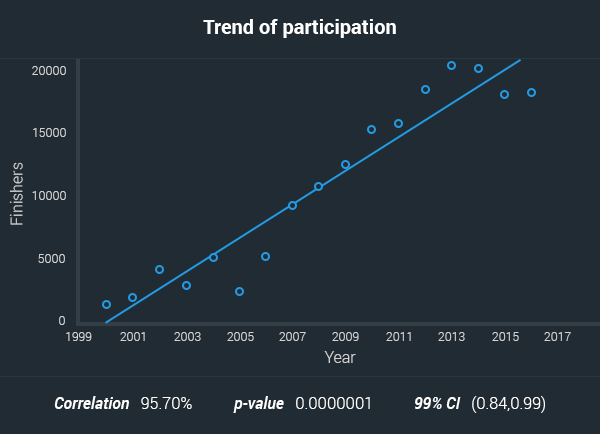
Though the increased participation is a fact, we want to examine if this is the reason for the overall trend.
So, the first argument that comes up usually is the increase in the not well-prepared participants, who just end up walking the race and drag the average down.
For that reason, the first thing we did is to see if there is an increase in the % of people who walk the race. Fist we took the 8-hour mark as an estimation of how long it takes to walk a marathon. For all years more than 99.9% of the participants finish for less time. We wanted to make sure and we repeated the analysis for the 7, 6 and 5-hour marks.
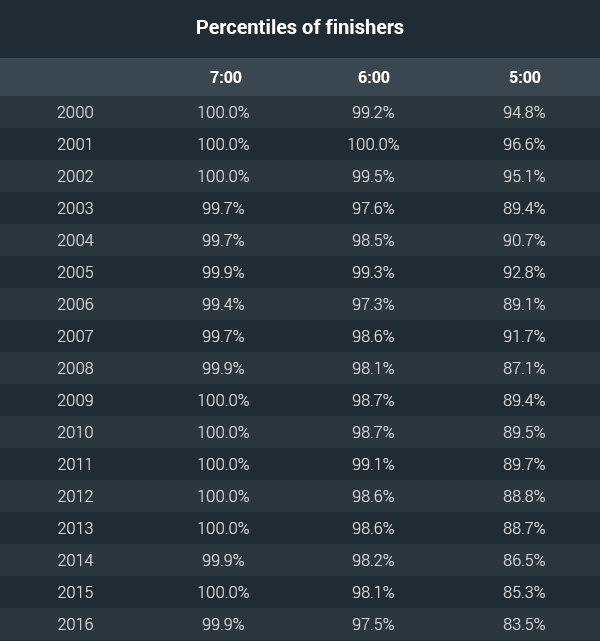
As we can see there isn't much change in the percentage of people, who finished for bellow 7 hours. There is a slight rise in the % of people who finished for more than 6 hours. The biggest change is in the people who finish for between 5 and 6 hours.
In our opinion, we can't call them particularly slow and they are definitely not just walking the race.
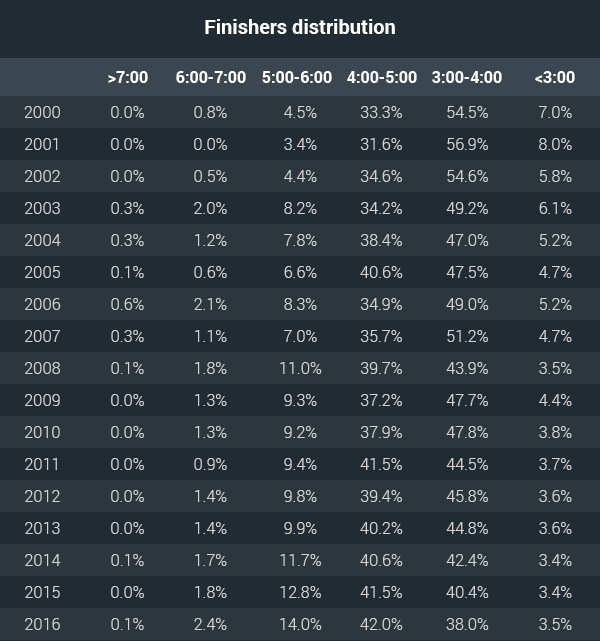
As we can see, there is an increase in the % of people who finish for more than 4 hours. Also, it's worth noting that the biggest change in the number of finishers in the 4:00-5:00-hour bracket. As the average finish time is over 4 hours since 2003, this is an increase in average speed runners and not in slow runners.
Also, if we look at this percentile wise
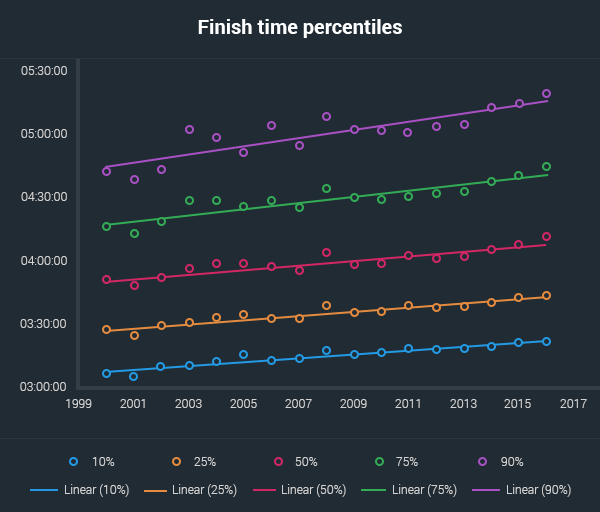
From this graph, we can see that everyone is slowing down at approximately the same rate.
Gender Differences
Another popular explanation is that as more and more women participate, and on average they are slower, then this is the reason for the trend.
Now, let's dig into this.
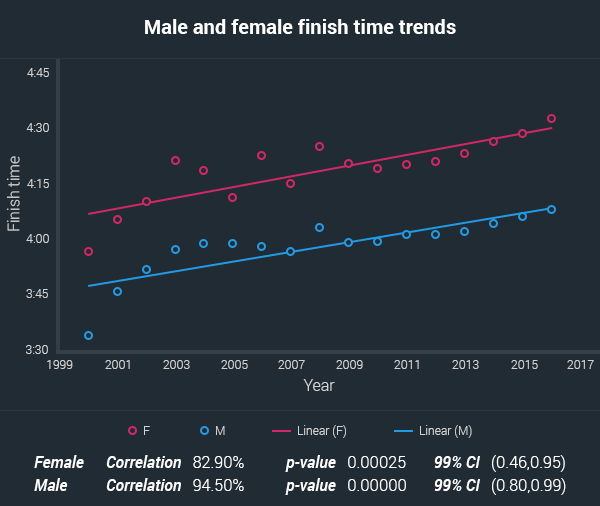
As we can see men and women are slowing down almost equally in the last 17 years. Those two trends are the same with 99% certainty.
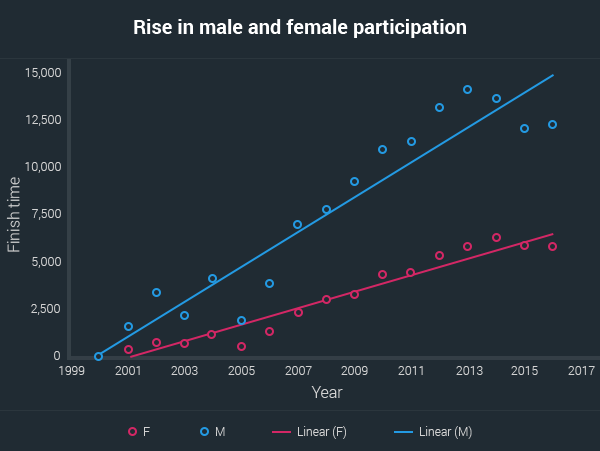
From this graph, we can see that male numbers are rising in a much steeper trajectory. It is worth noting that women's participation has risen 6.62 times and for men, this proportion is 2.61. This is why, in fact, Australian women are more responsible for the total slow down than men - 69.75%.
But still, both women and men are slowing down at equal rates and even if women participation numbers stayed the same for the last 17 years the trend would be in the same direction.
Aging
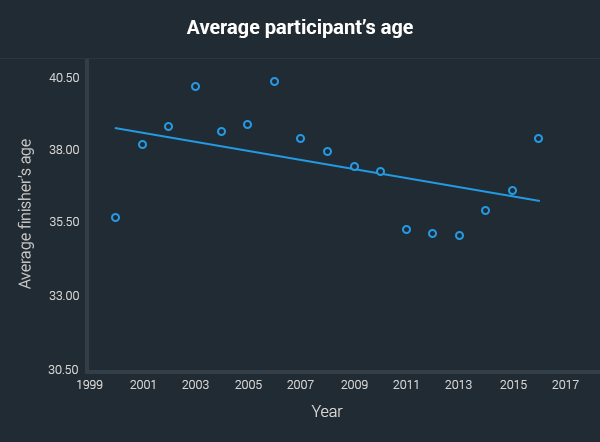
The worldwide trend is that the average age of the marathon runners is going up and this is the reason for the slowdown.
This argument is moot for Australia. Contrary to the trend, the average age of marathoners in Australia is in fact declining.
Declining Health
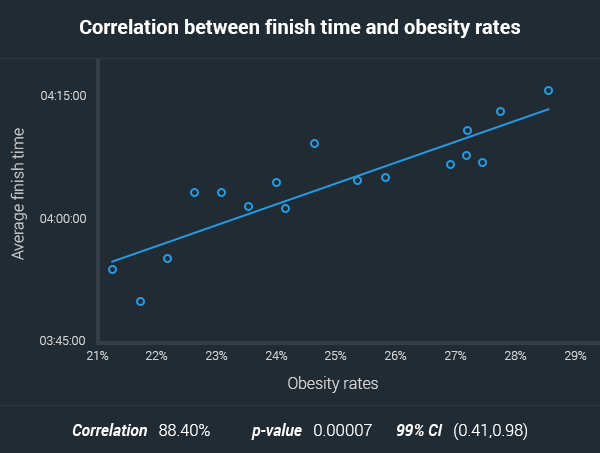
Obesity in Australia, as in most developed countries, is on the rise. We used the data on obesity from the Australian Bureau of Statistics. The following graphs show the correlation between obesity rates, hypertension and marathon finish time.
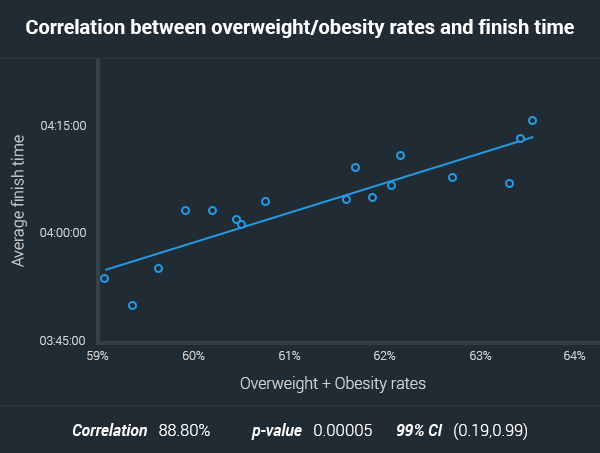
The relationship is still strong if we add the overweight population.
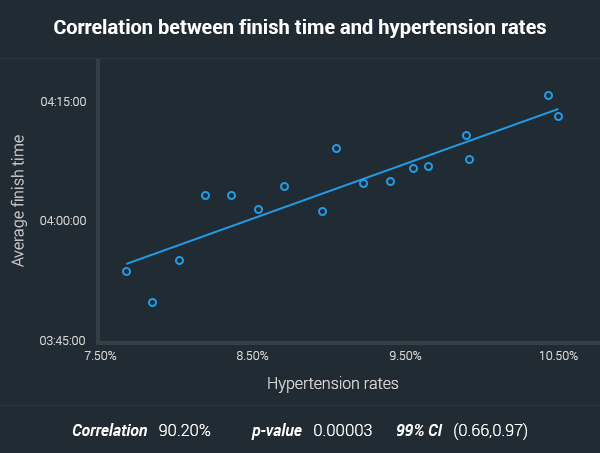
The correlation between the rising rates of hypertension and the increase in finish time is even stronger.
As we all know, the effects of chronic conditions such as obesity and hypertension are not immediate. That's why we correlated the obesity and hypertension rates from one year to the average finish time after 3 years. Regrettably these correlations are still strong and 99% statistically significant.
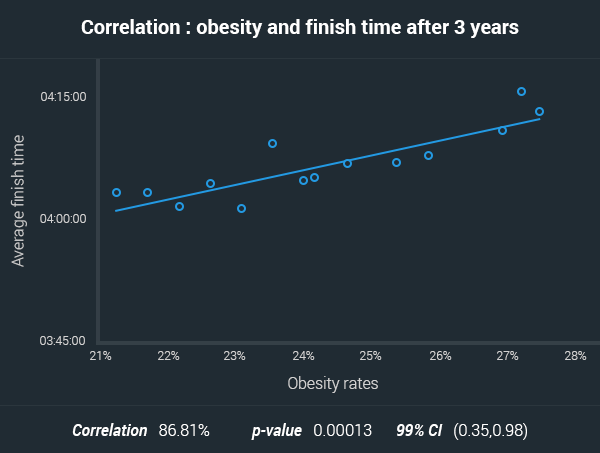
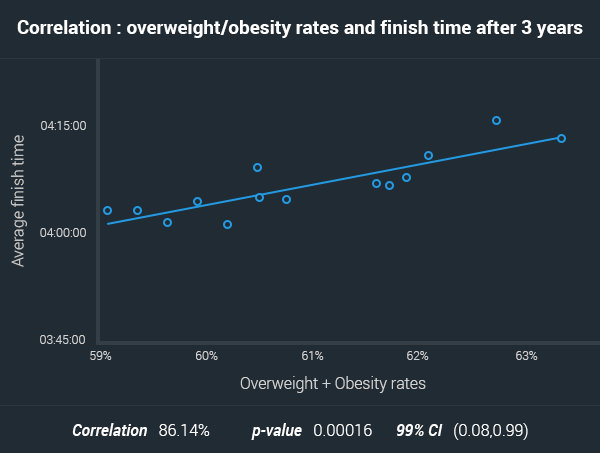
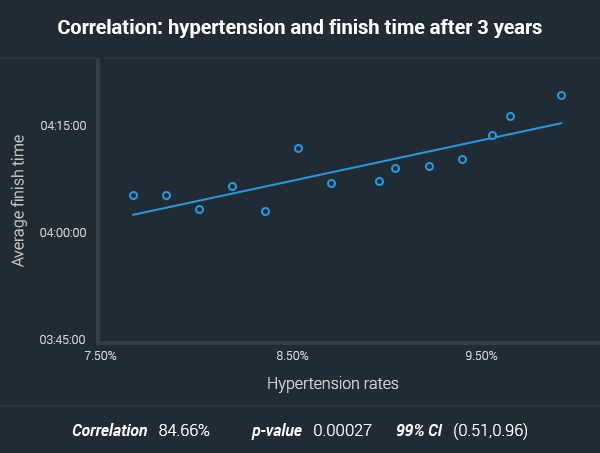
Of course, there is no way we can be sure that these results are the only explanation for the slow down of Australian marathoners. But still it is worth noting that the nation-wide deteriorating health has an impact even on active and health-conscious marathon runners.
Conclusions
- Australians are getting slower
- The rise in participation in general and the rise in female participation cannot fully explain the tend
- Signs of deteriorating health are highly correlated with the increase in the average finish time. Though, we can not be sure of the causality of these factors we consider them note-worthy.
About the researchers
This study has been lead by Jens Jakob Andersen a former competitive runner, founder of RunRepeat and statistician from Copenhagen. He was assisted by Vania A. Nikolova, Ph.D. in Mathematical Analysis.
About RunRepeat
At RunRepeat.com we wear test all the shoes and we test them in our lab. We do our best to help runners find the right pair of running shoes at the best price. We also do in-depth studies related to our sports categories. Learn more about what we do on our about page.
Use of content
- We are happy to give interviews on the topic at any time. Reach out to Jens at jens@runrepeat.com.
- For web usage, any minor text sections, all data, and all graphics may be used as long as a reference is added to this original piece.
- For print usage, reach out to jens@runrepeat.com.
A full infographic can be downloaded from below. Signs of poor health are highly correlated to the decrease in speed.
Feel free to use any material from this page, as long as you refer to this original source.

