Vans Shoes Statistics
Founded on March 16, 1996, the Vans brand has grown to be one of the biggest active footwear brands in the world. Today it is part of the VF Corp which bought it in 2004 for approximately $396 million. Learn more about the shoe brand’s up-to-date statistics, and future trends, among other interesting facts detailed in this report.
Top Vans shoe statistics
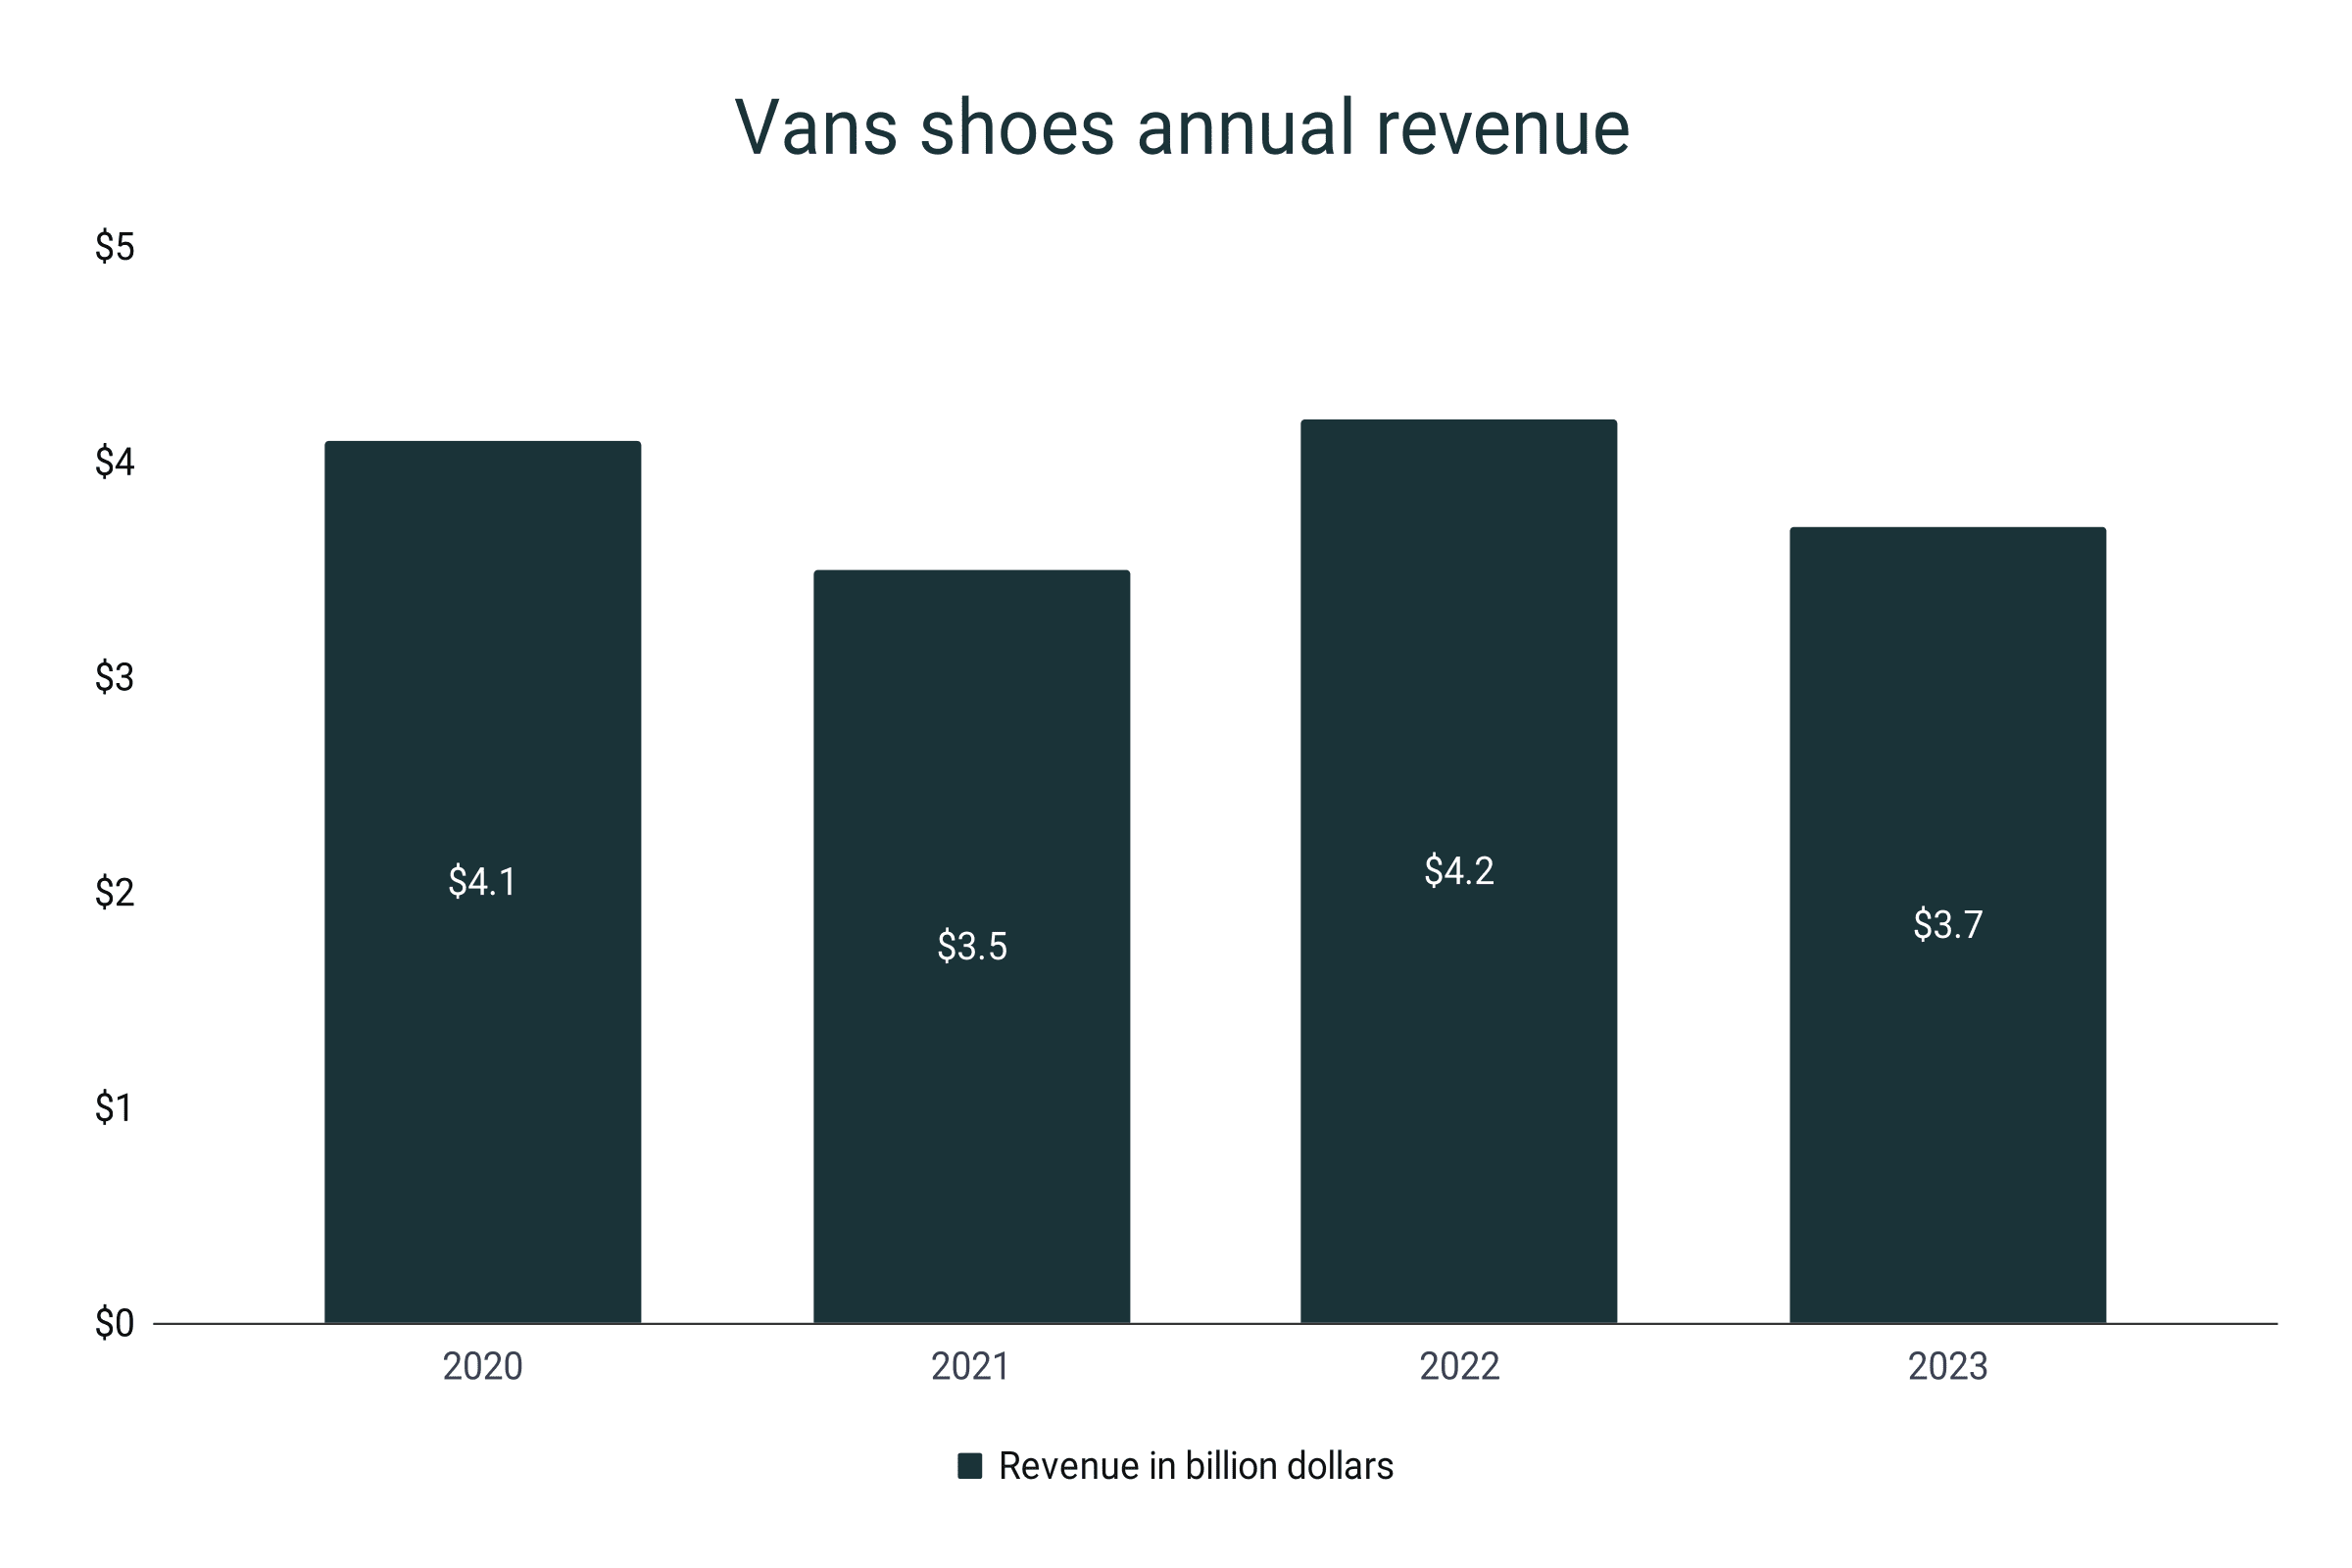
- In the 2023 fiscal year, Vans recorded a $3.7 billion global revenue.
- Compared to the $4.2 billion revenue the previous year, the shoe brand sustained a 12% decline.
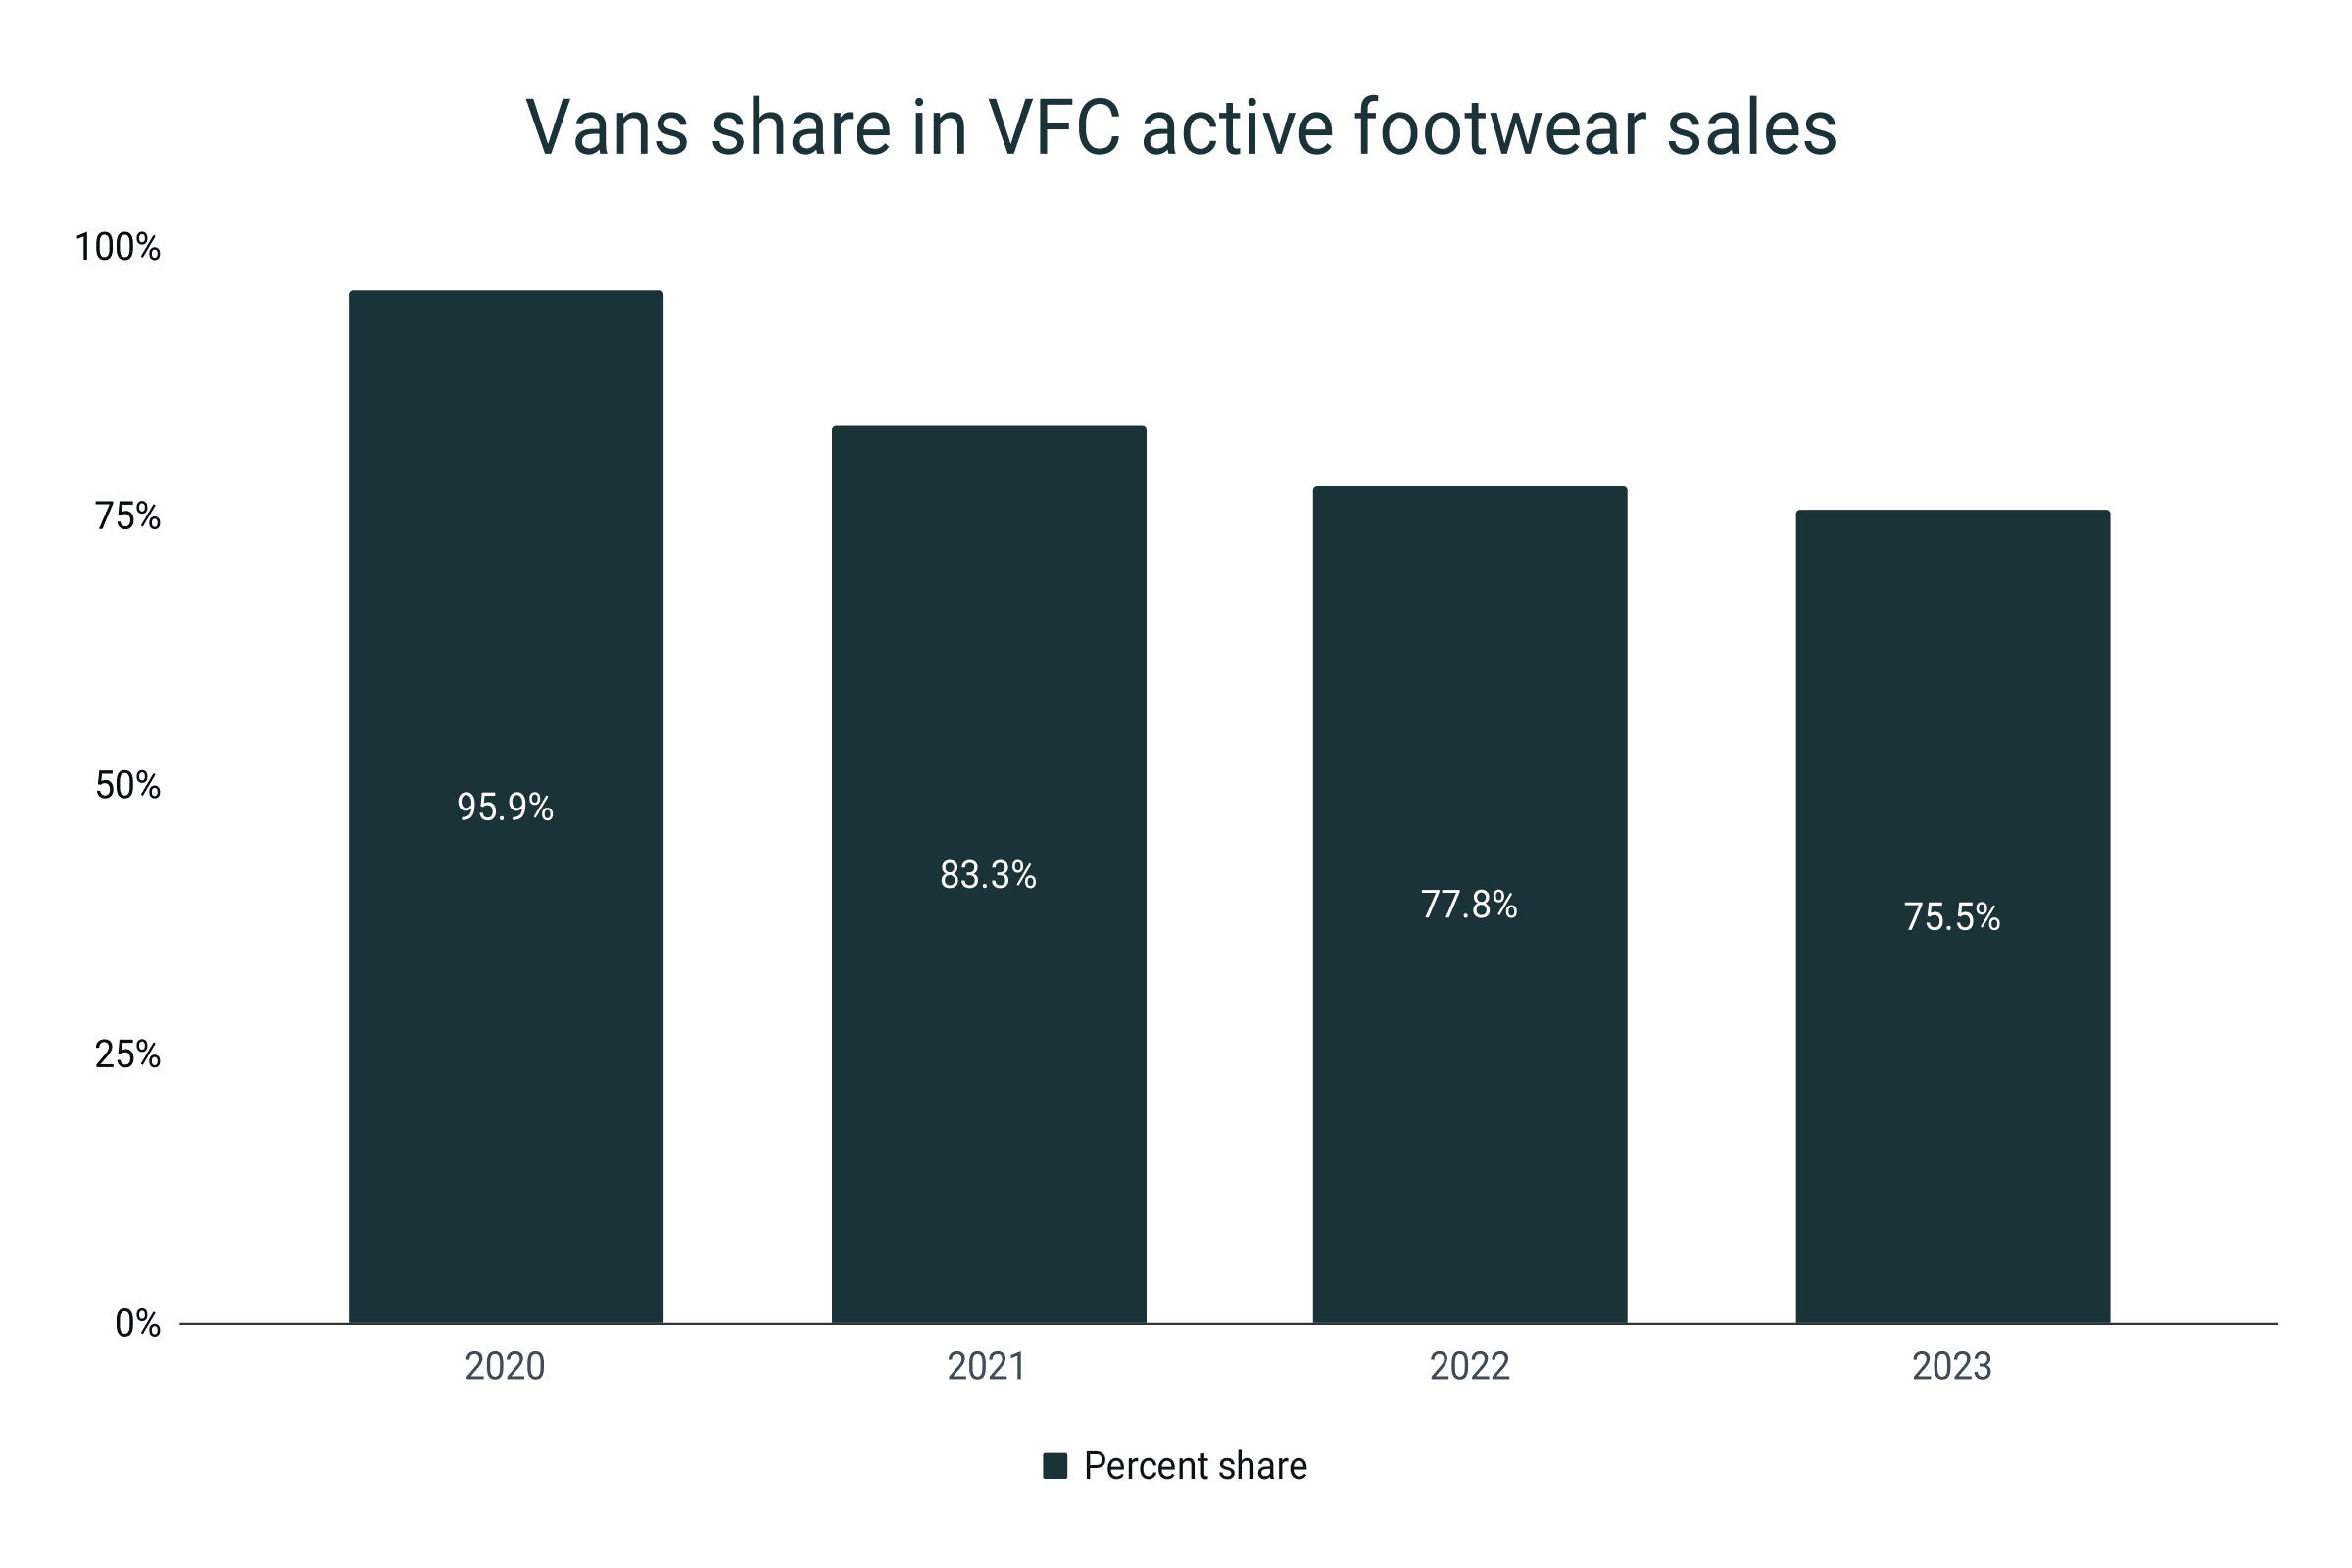
- The percentage share of Vans in VFC’s active footwear segment also plummeted from 95.9% in 2020 to 75.5% by the end of the 2023 fiscal year.
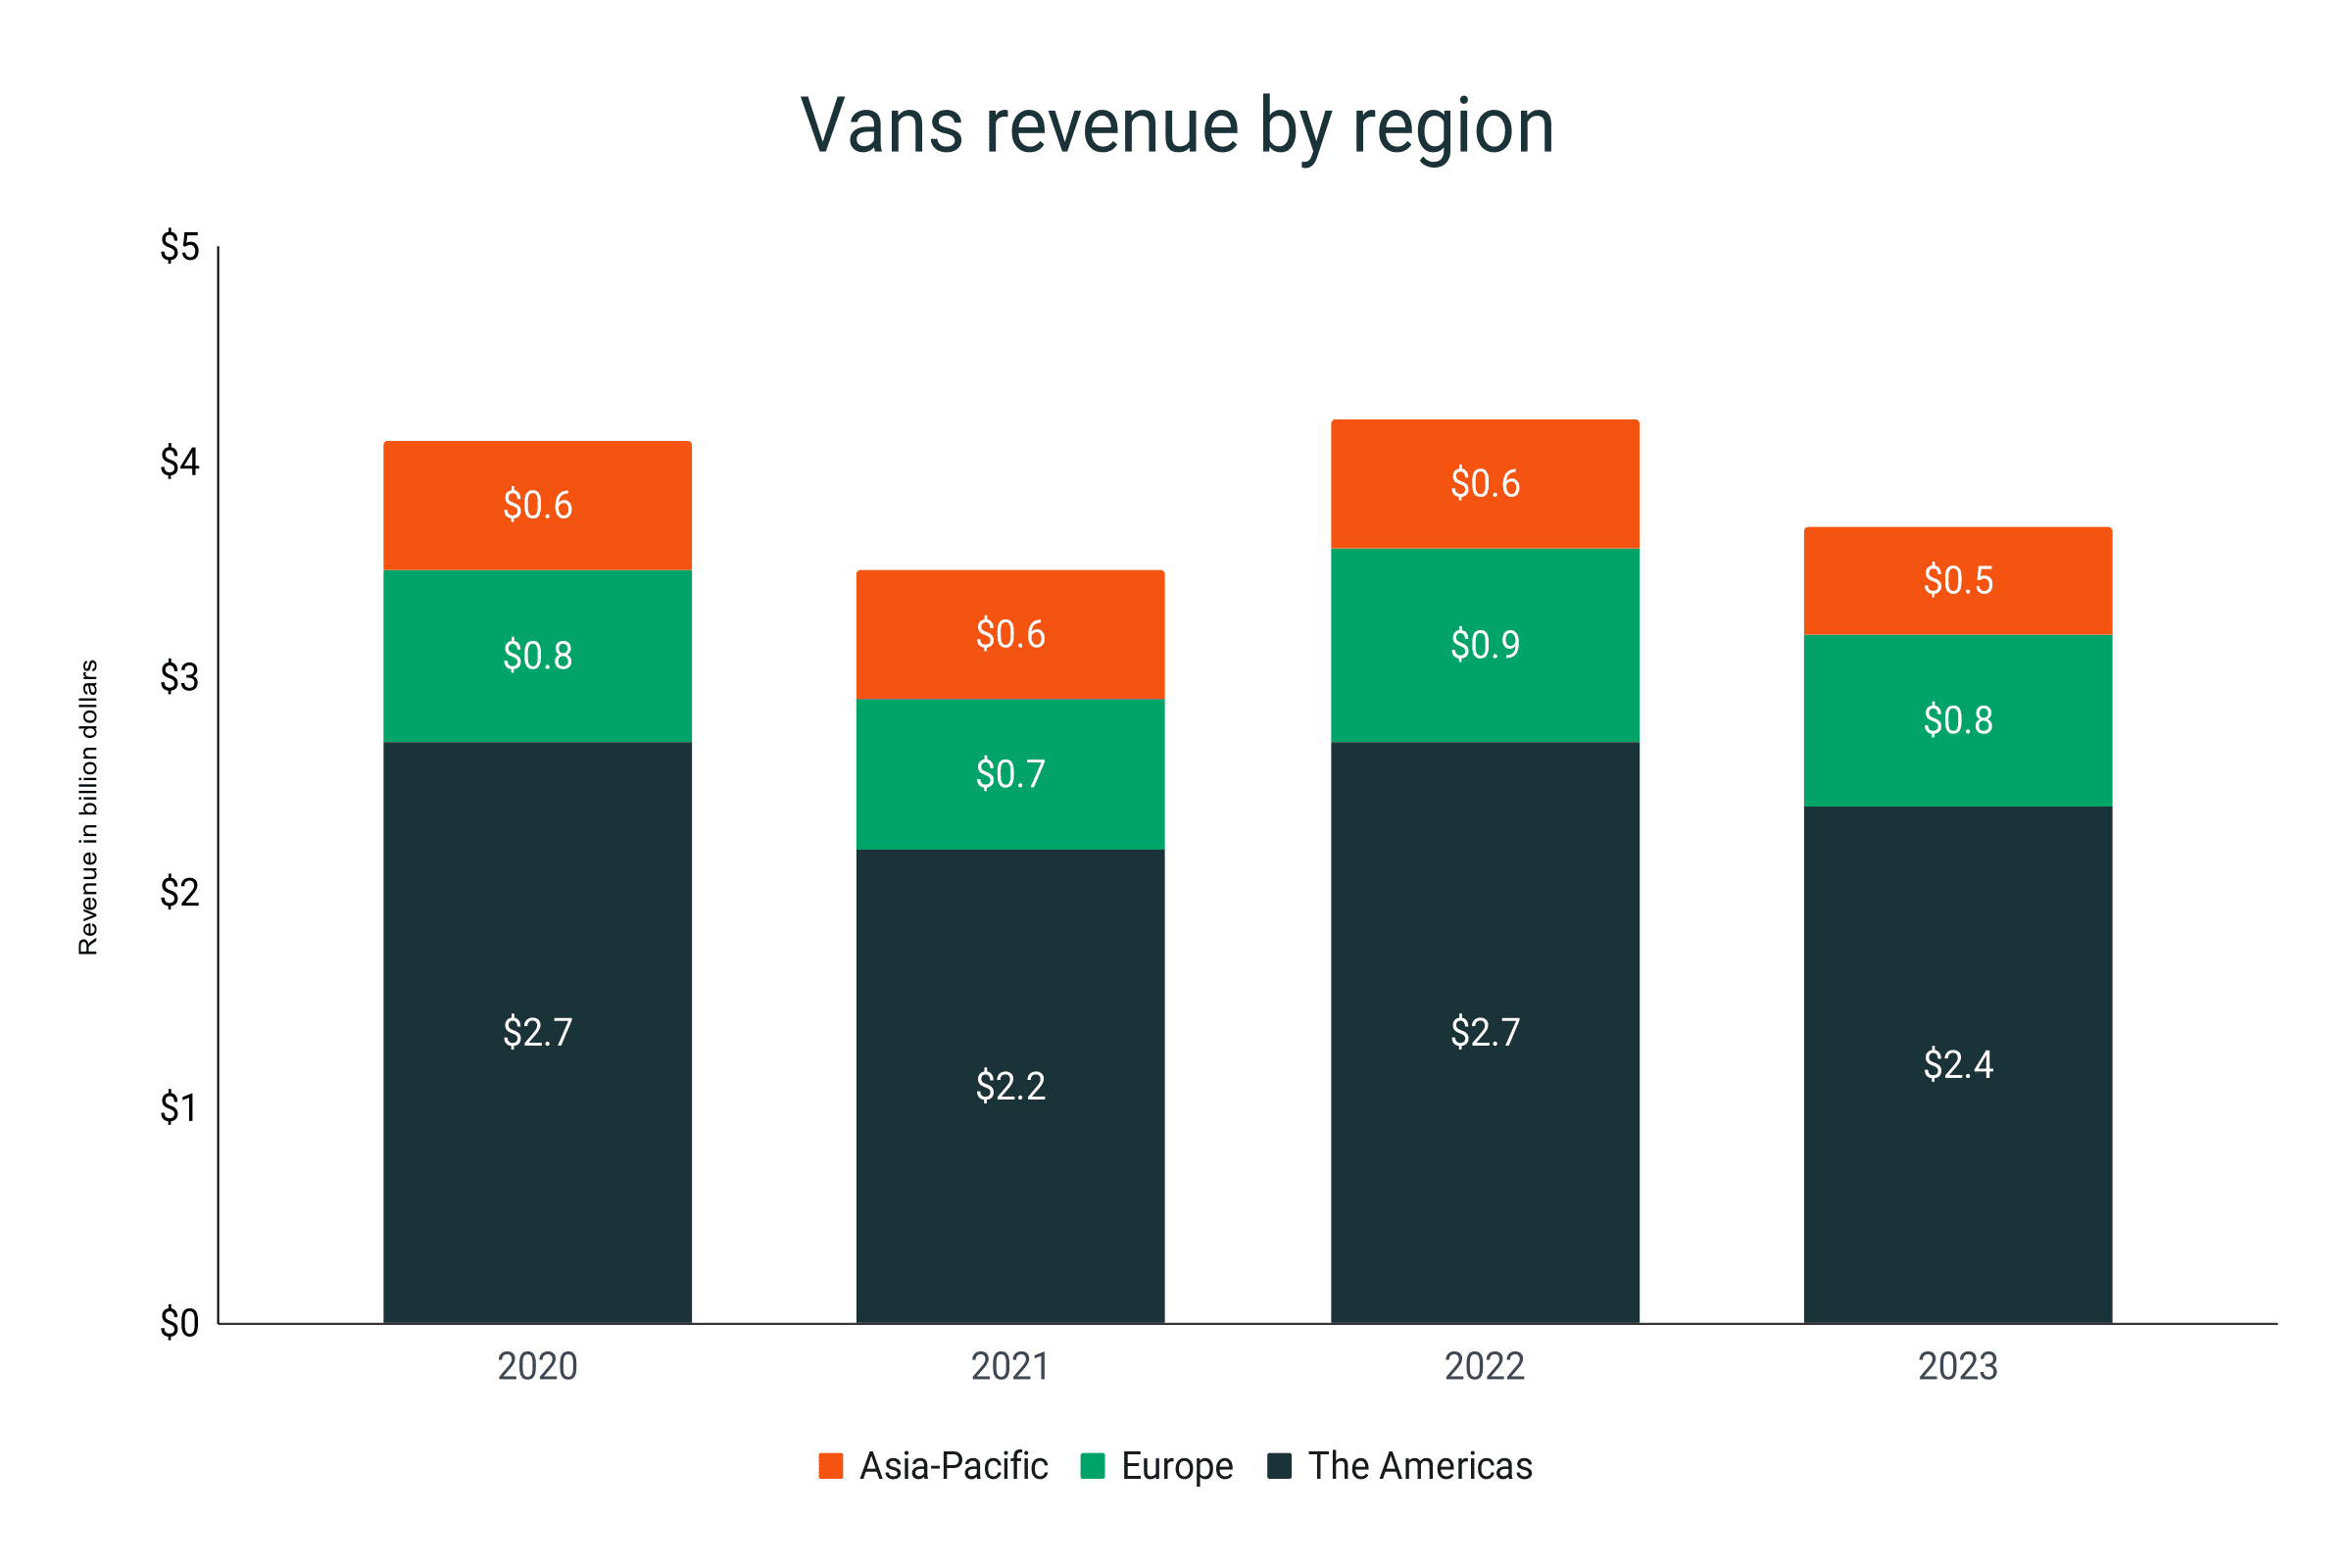
- With a $2.4 billion total revenue, the Americas (North and South America) is the biggest market for Vans.
- Europe and Asia-Pacific contributed $800 million and $500 million to the brand’s 2023 fiscal year revenue, respectively.
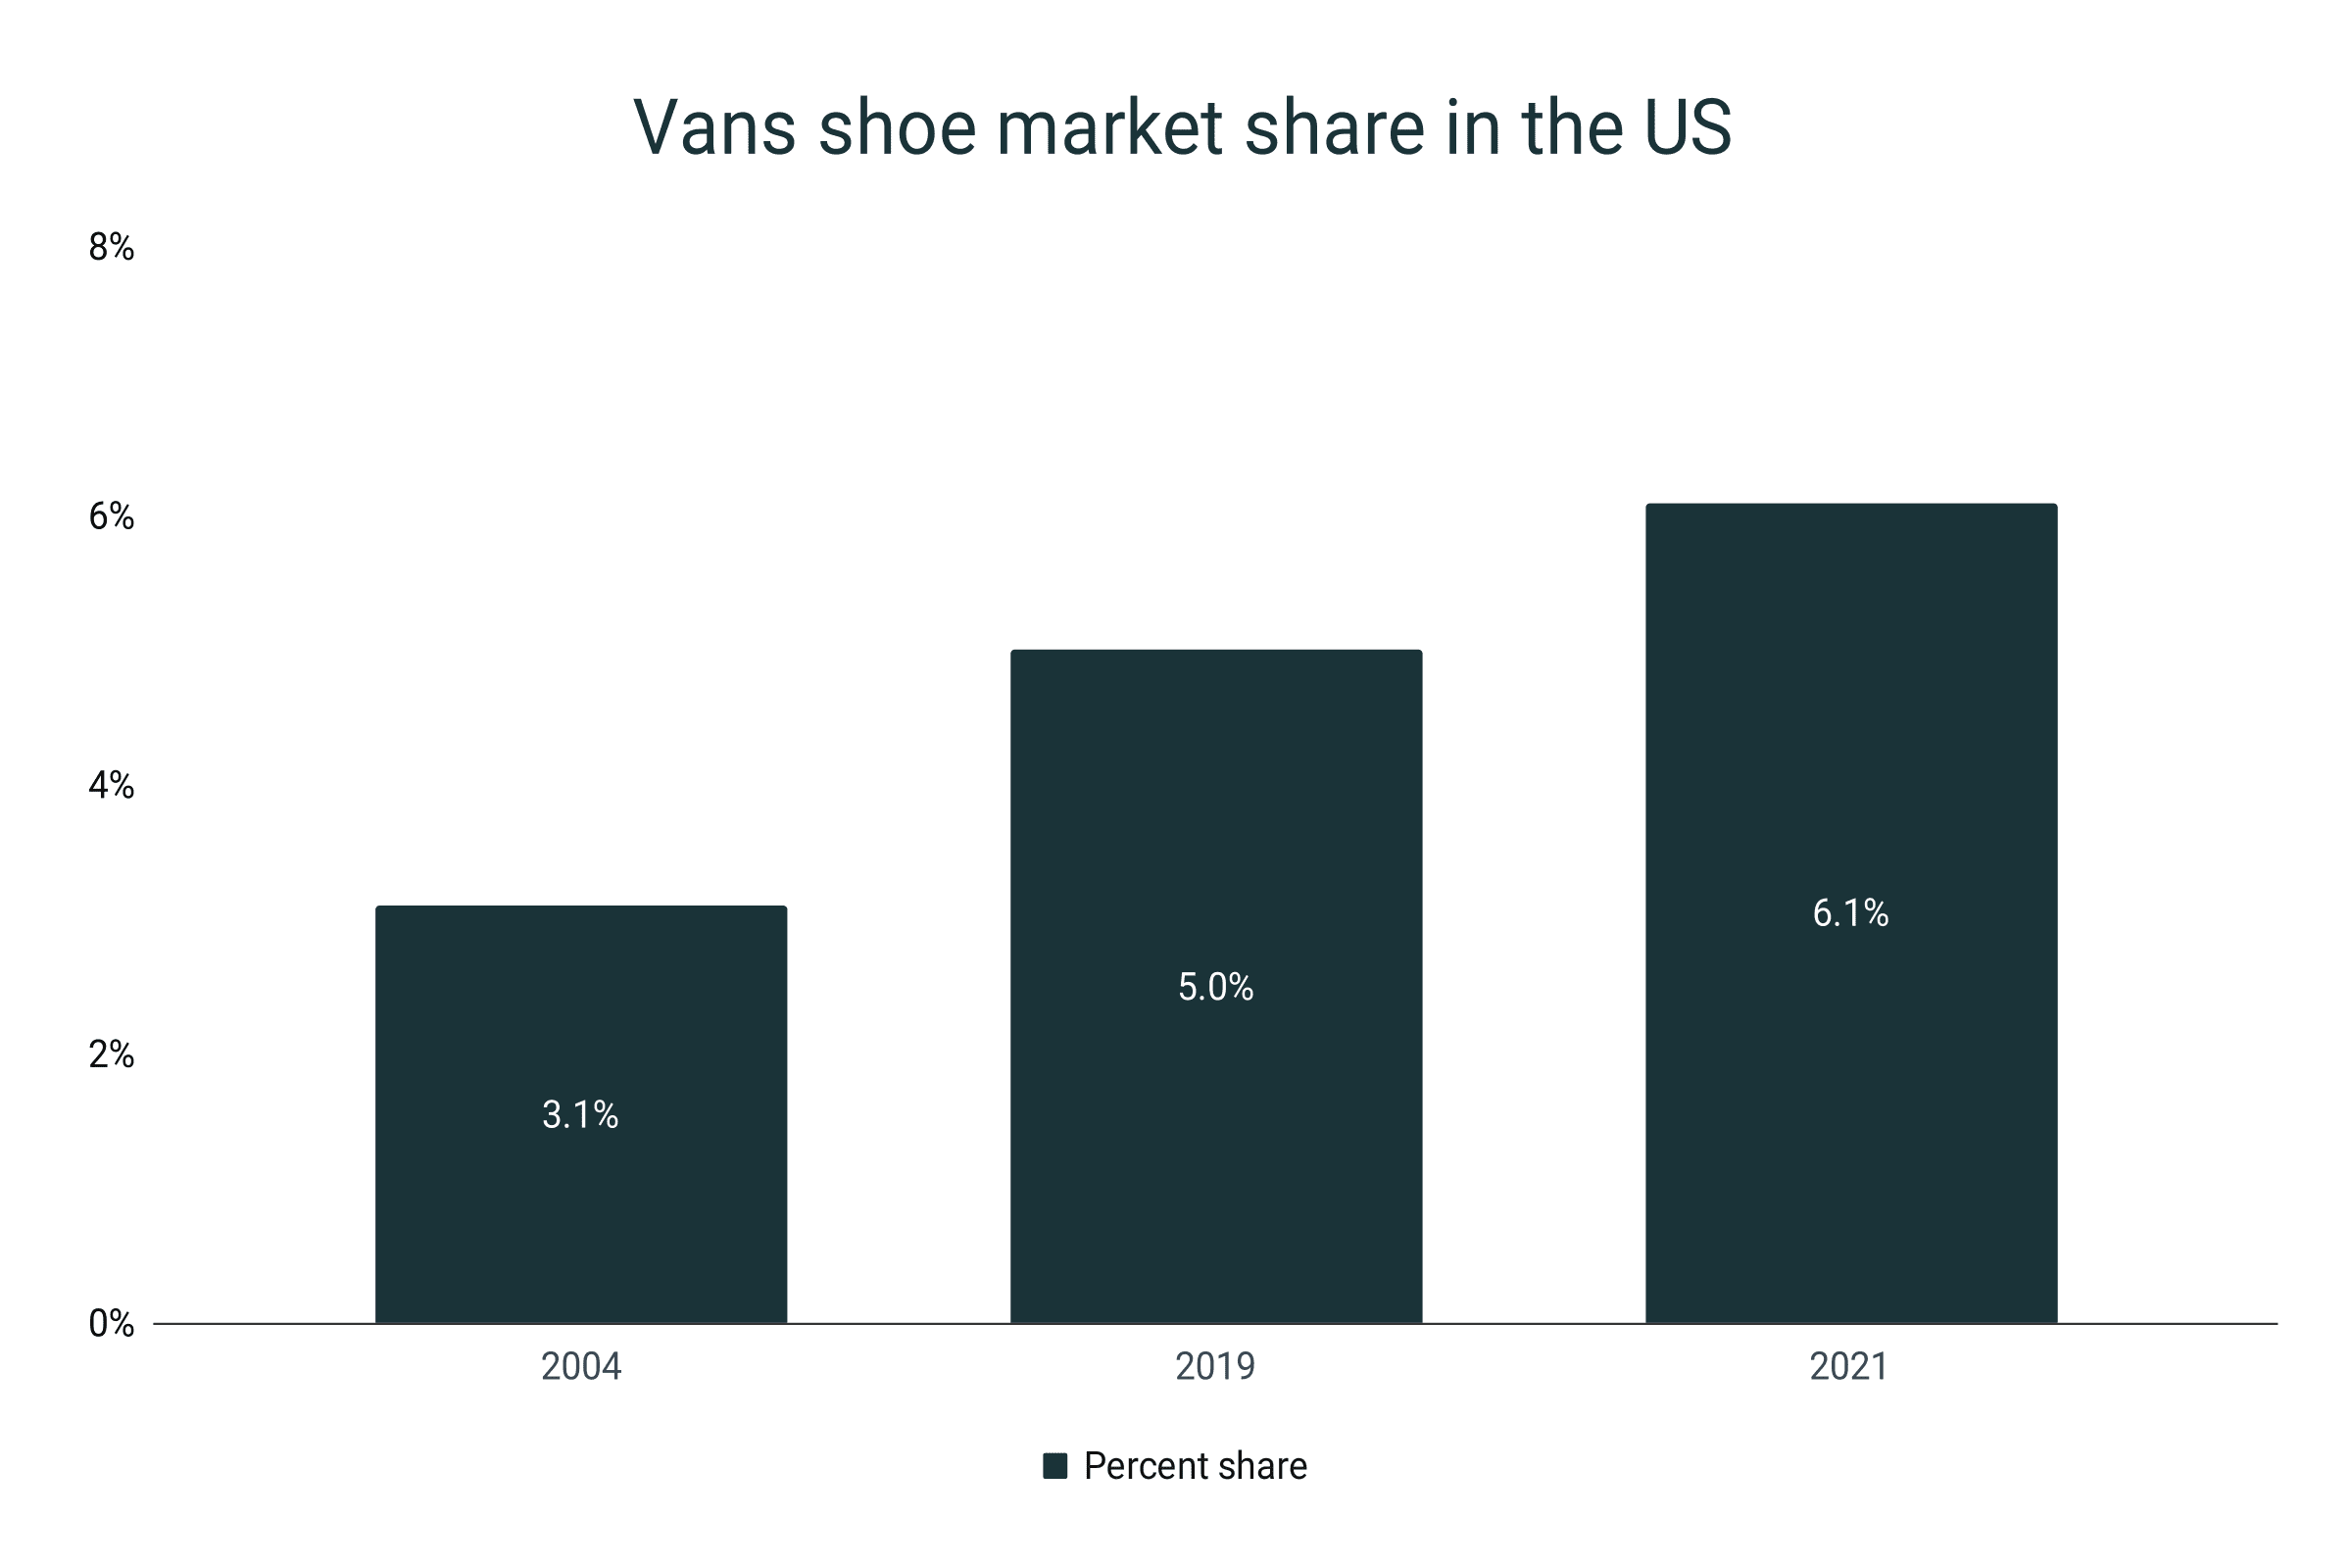
- In 2021, Vans enjoyed a 6.1% share of the entire US shoe industry. The figure was 3.1% in 2004 when VFC bought Vans.
- Vans held a 7% portion of the global sneaker market. In the skateboarding shoes segment, it occupied a 10.1% market share.
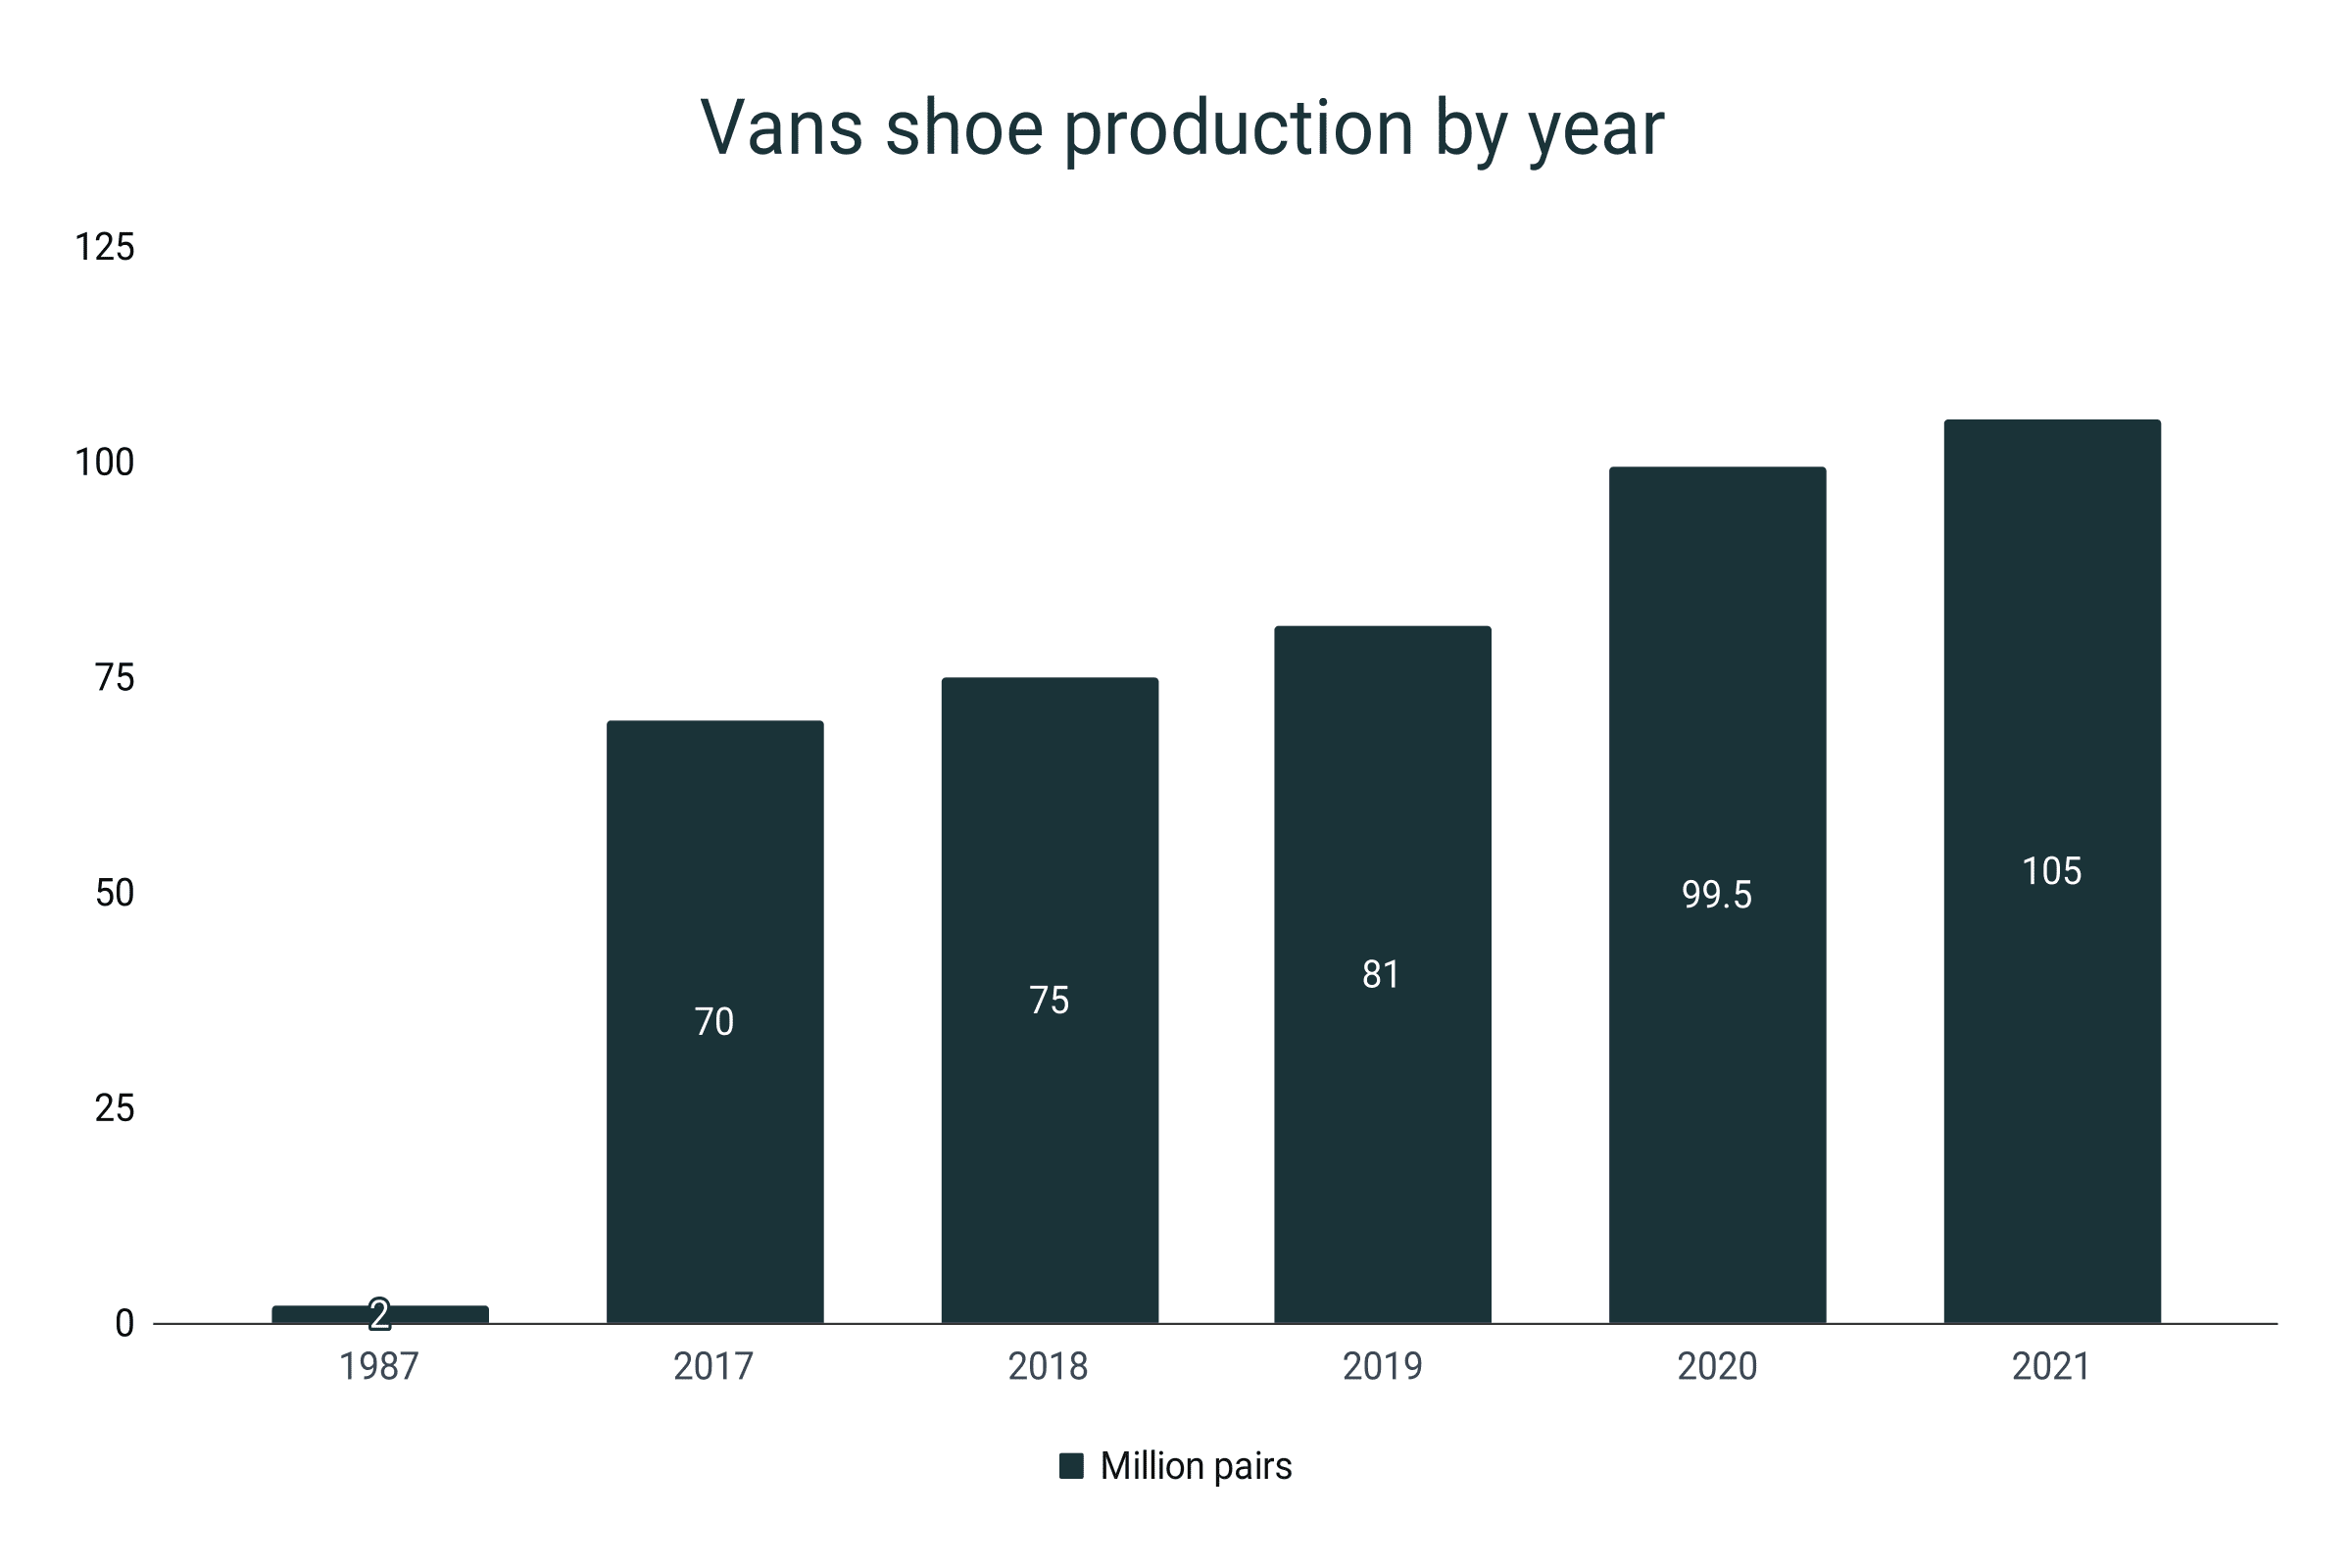
- Over 105 million pairs of shoes were manufactured and sold by Vans in the 2023 fiscal year.
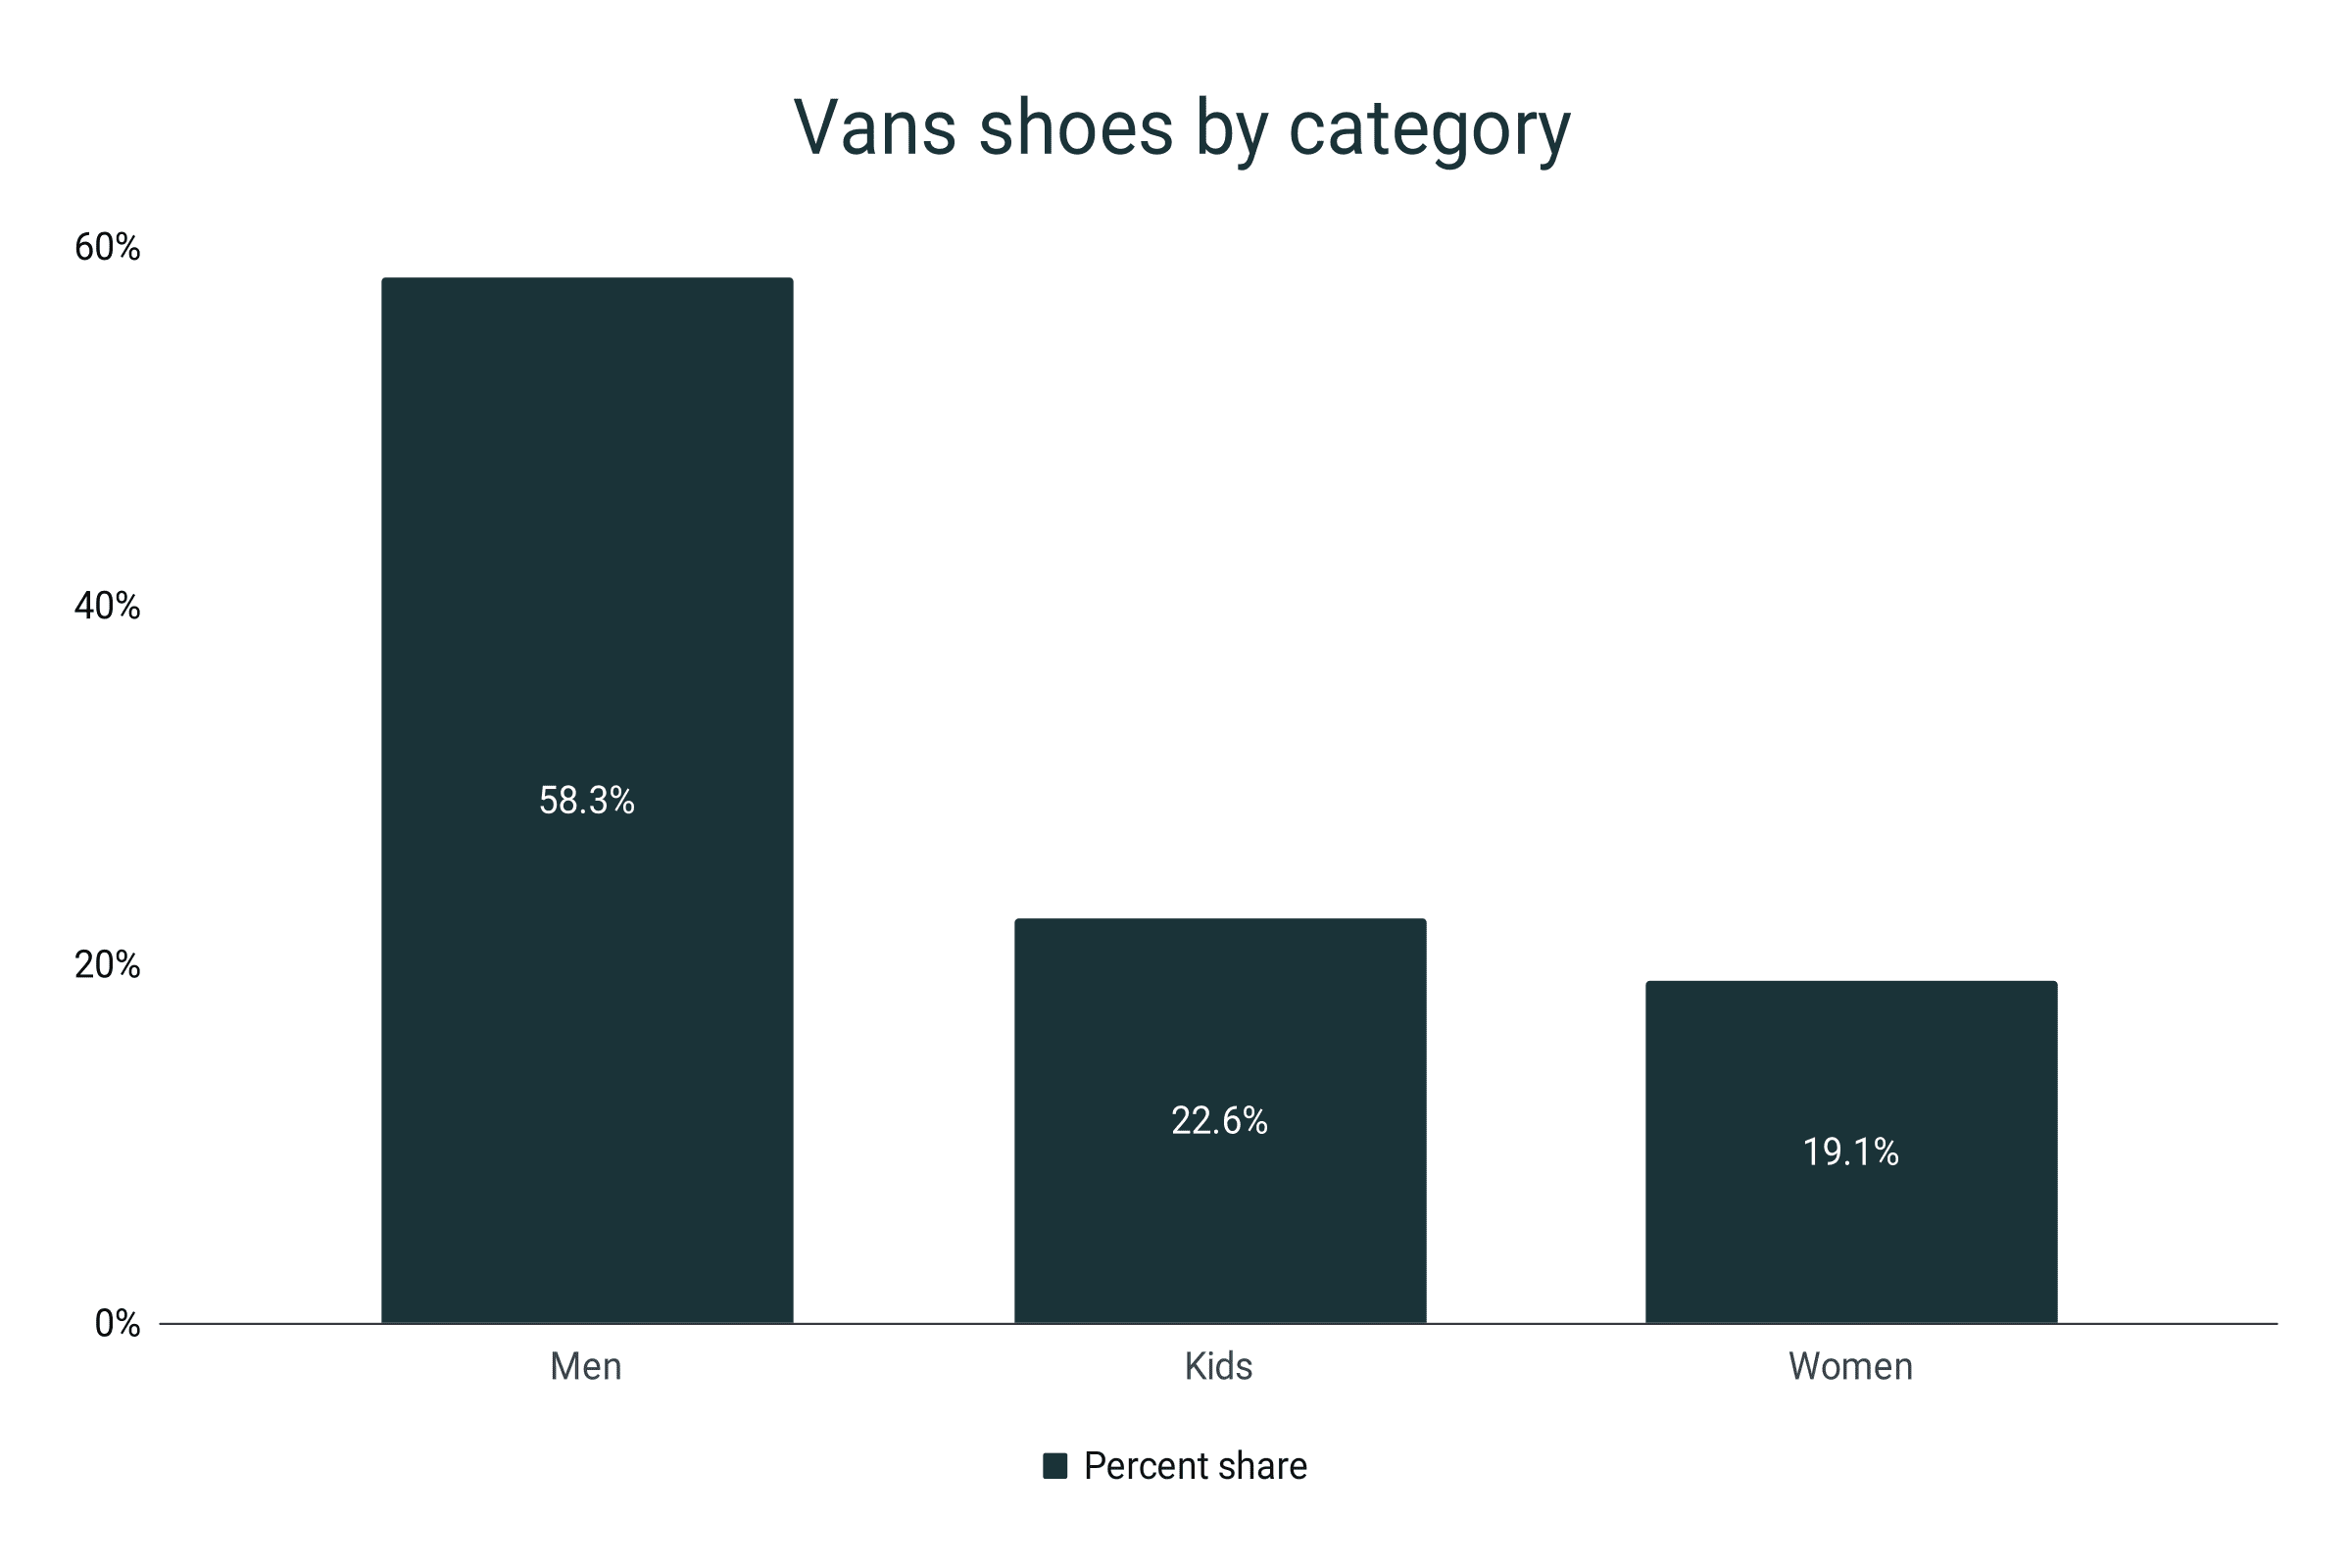
- 58.3% of these shoes are for men. Meanwhile, 22.6% and 19.1% are for kids and for women, respectively.
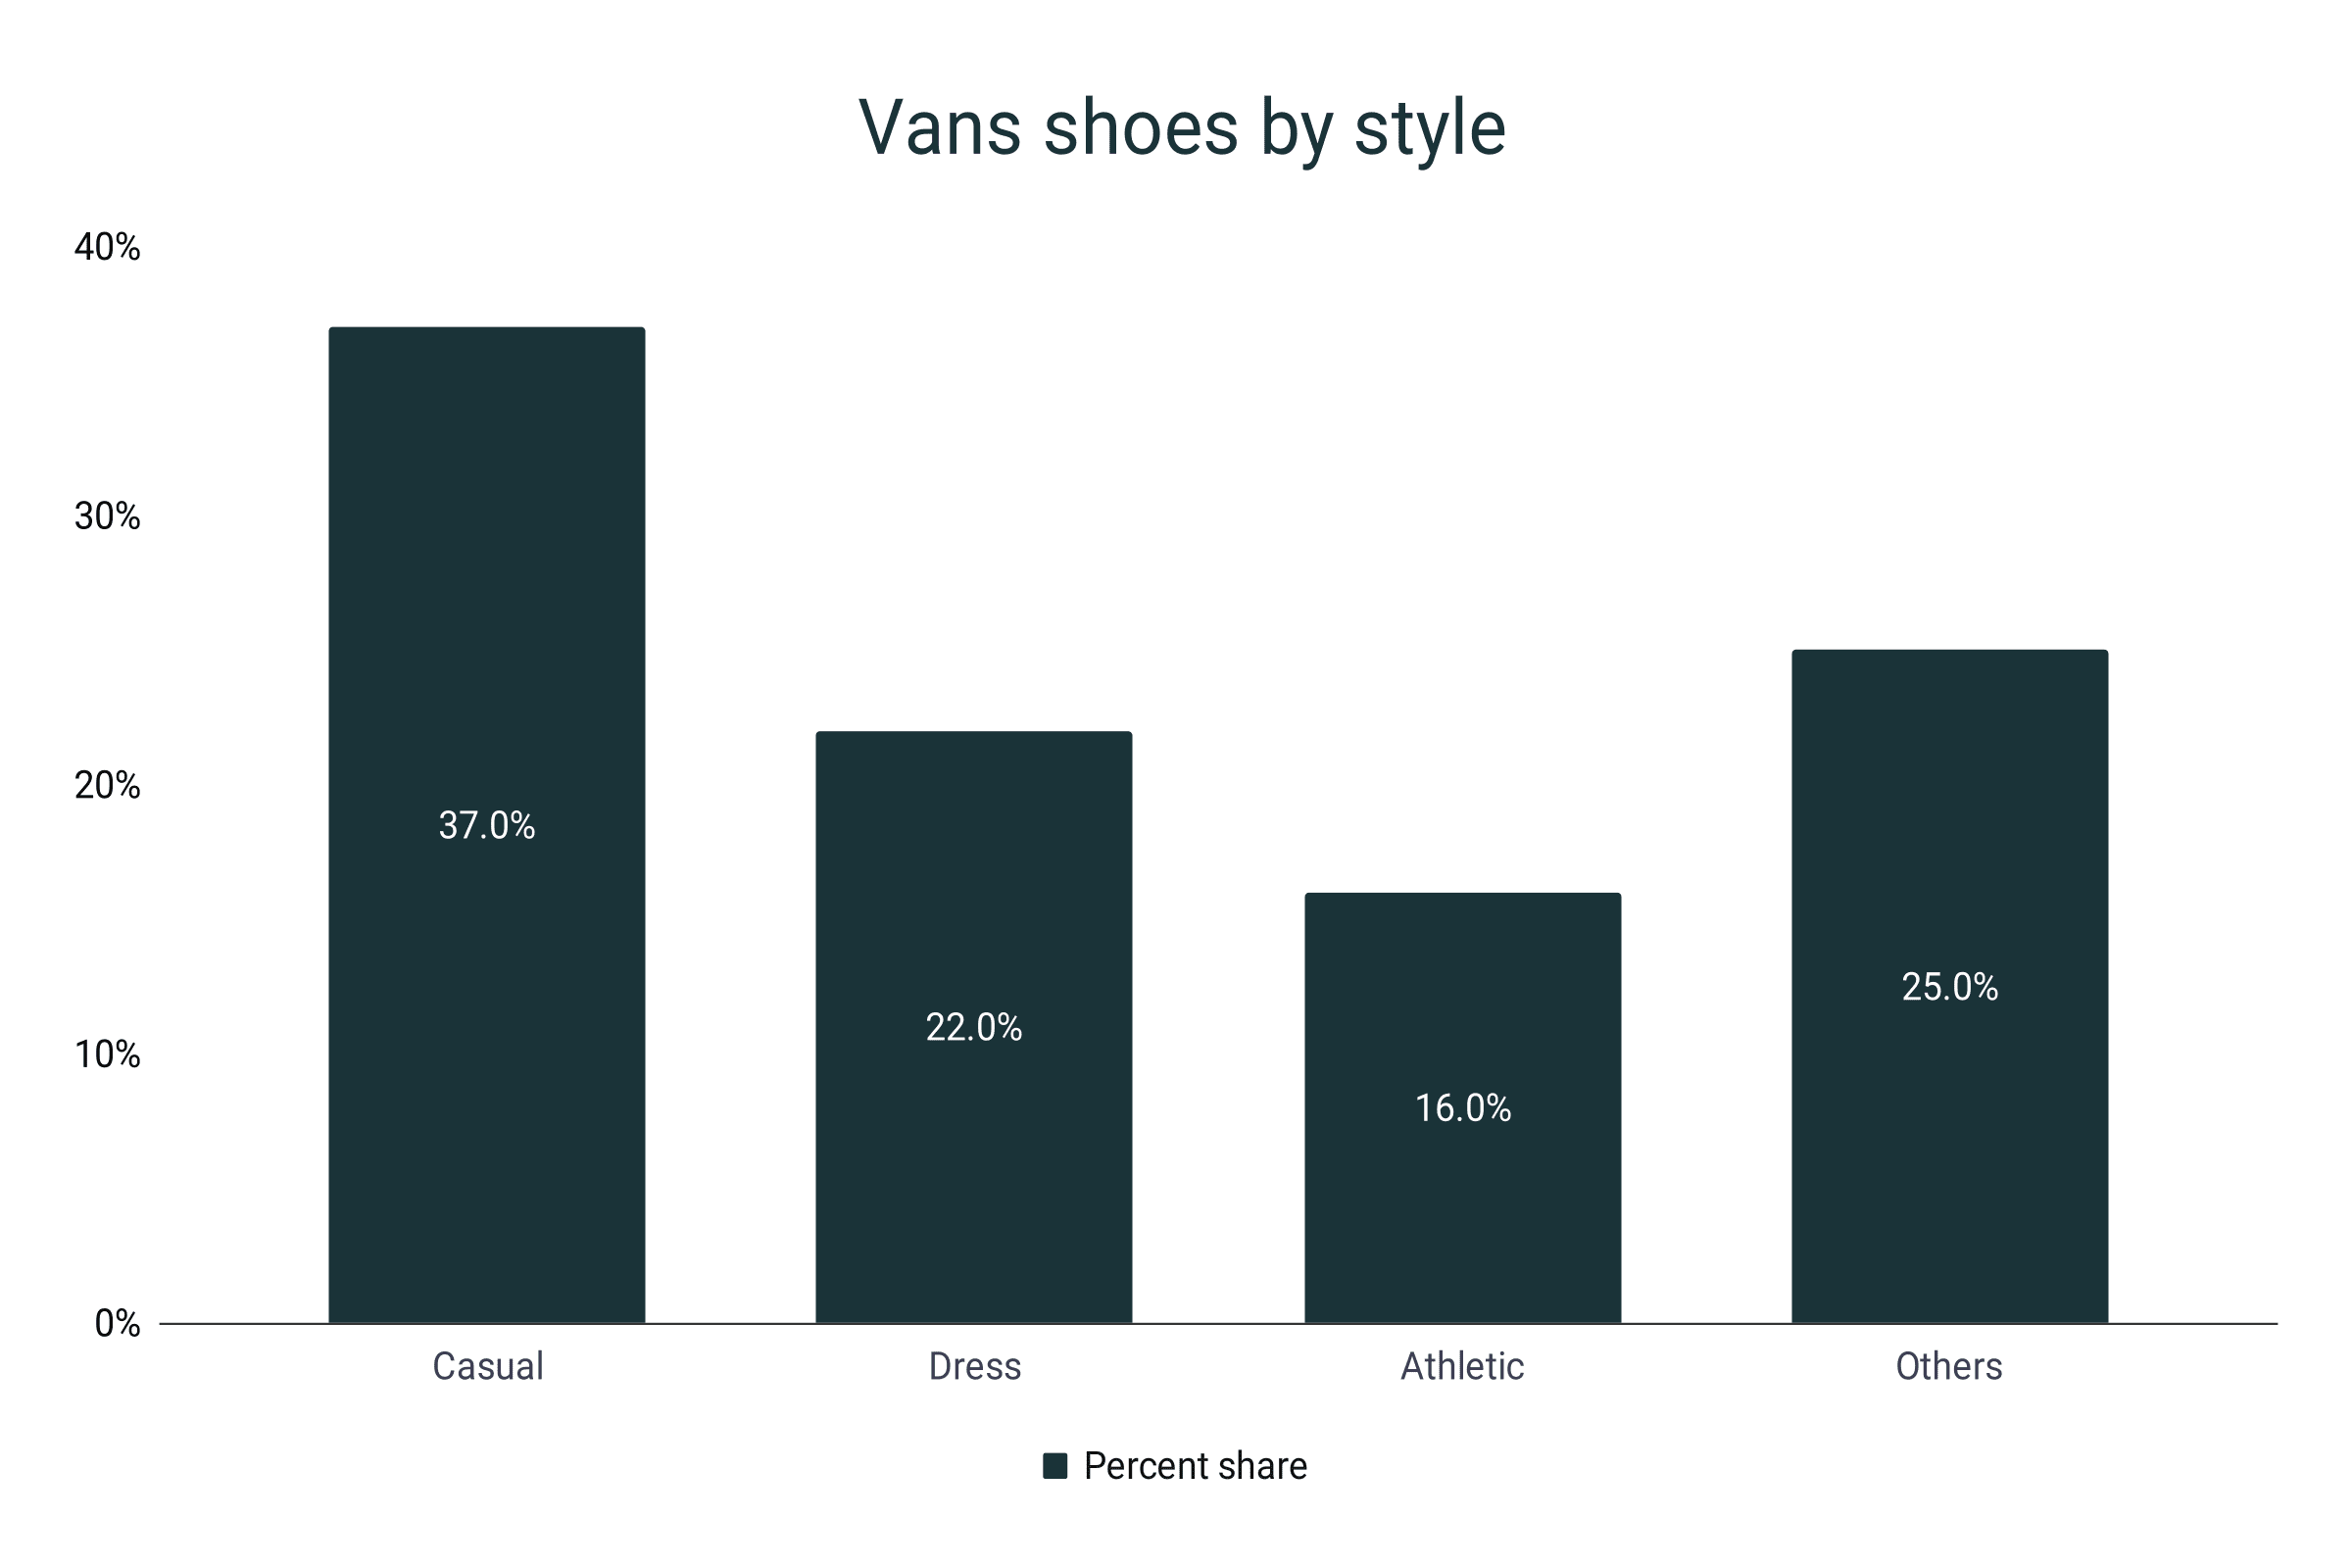
- Of all the shoes Vans manufactures every year, 37% are casual footwear.
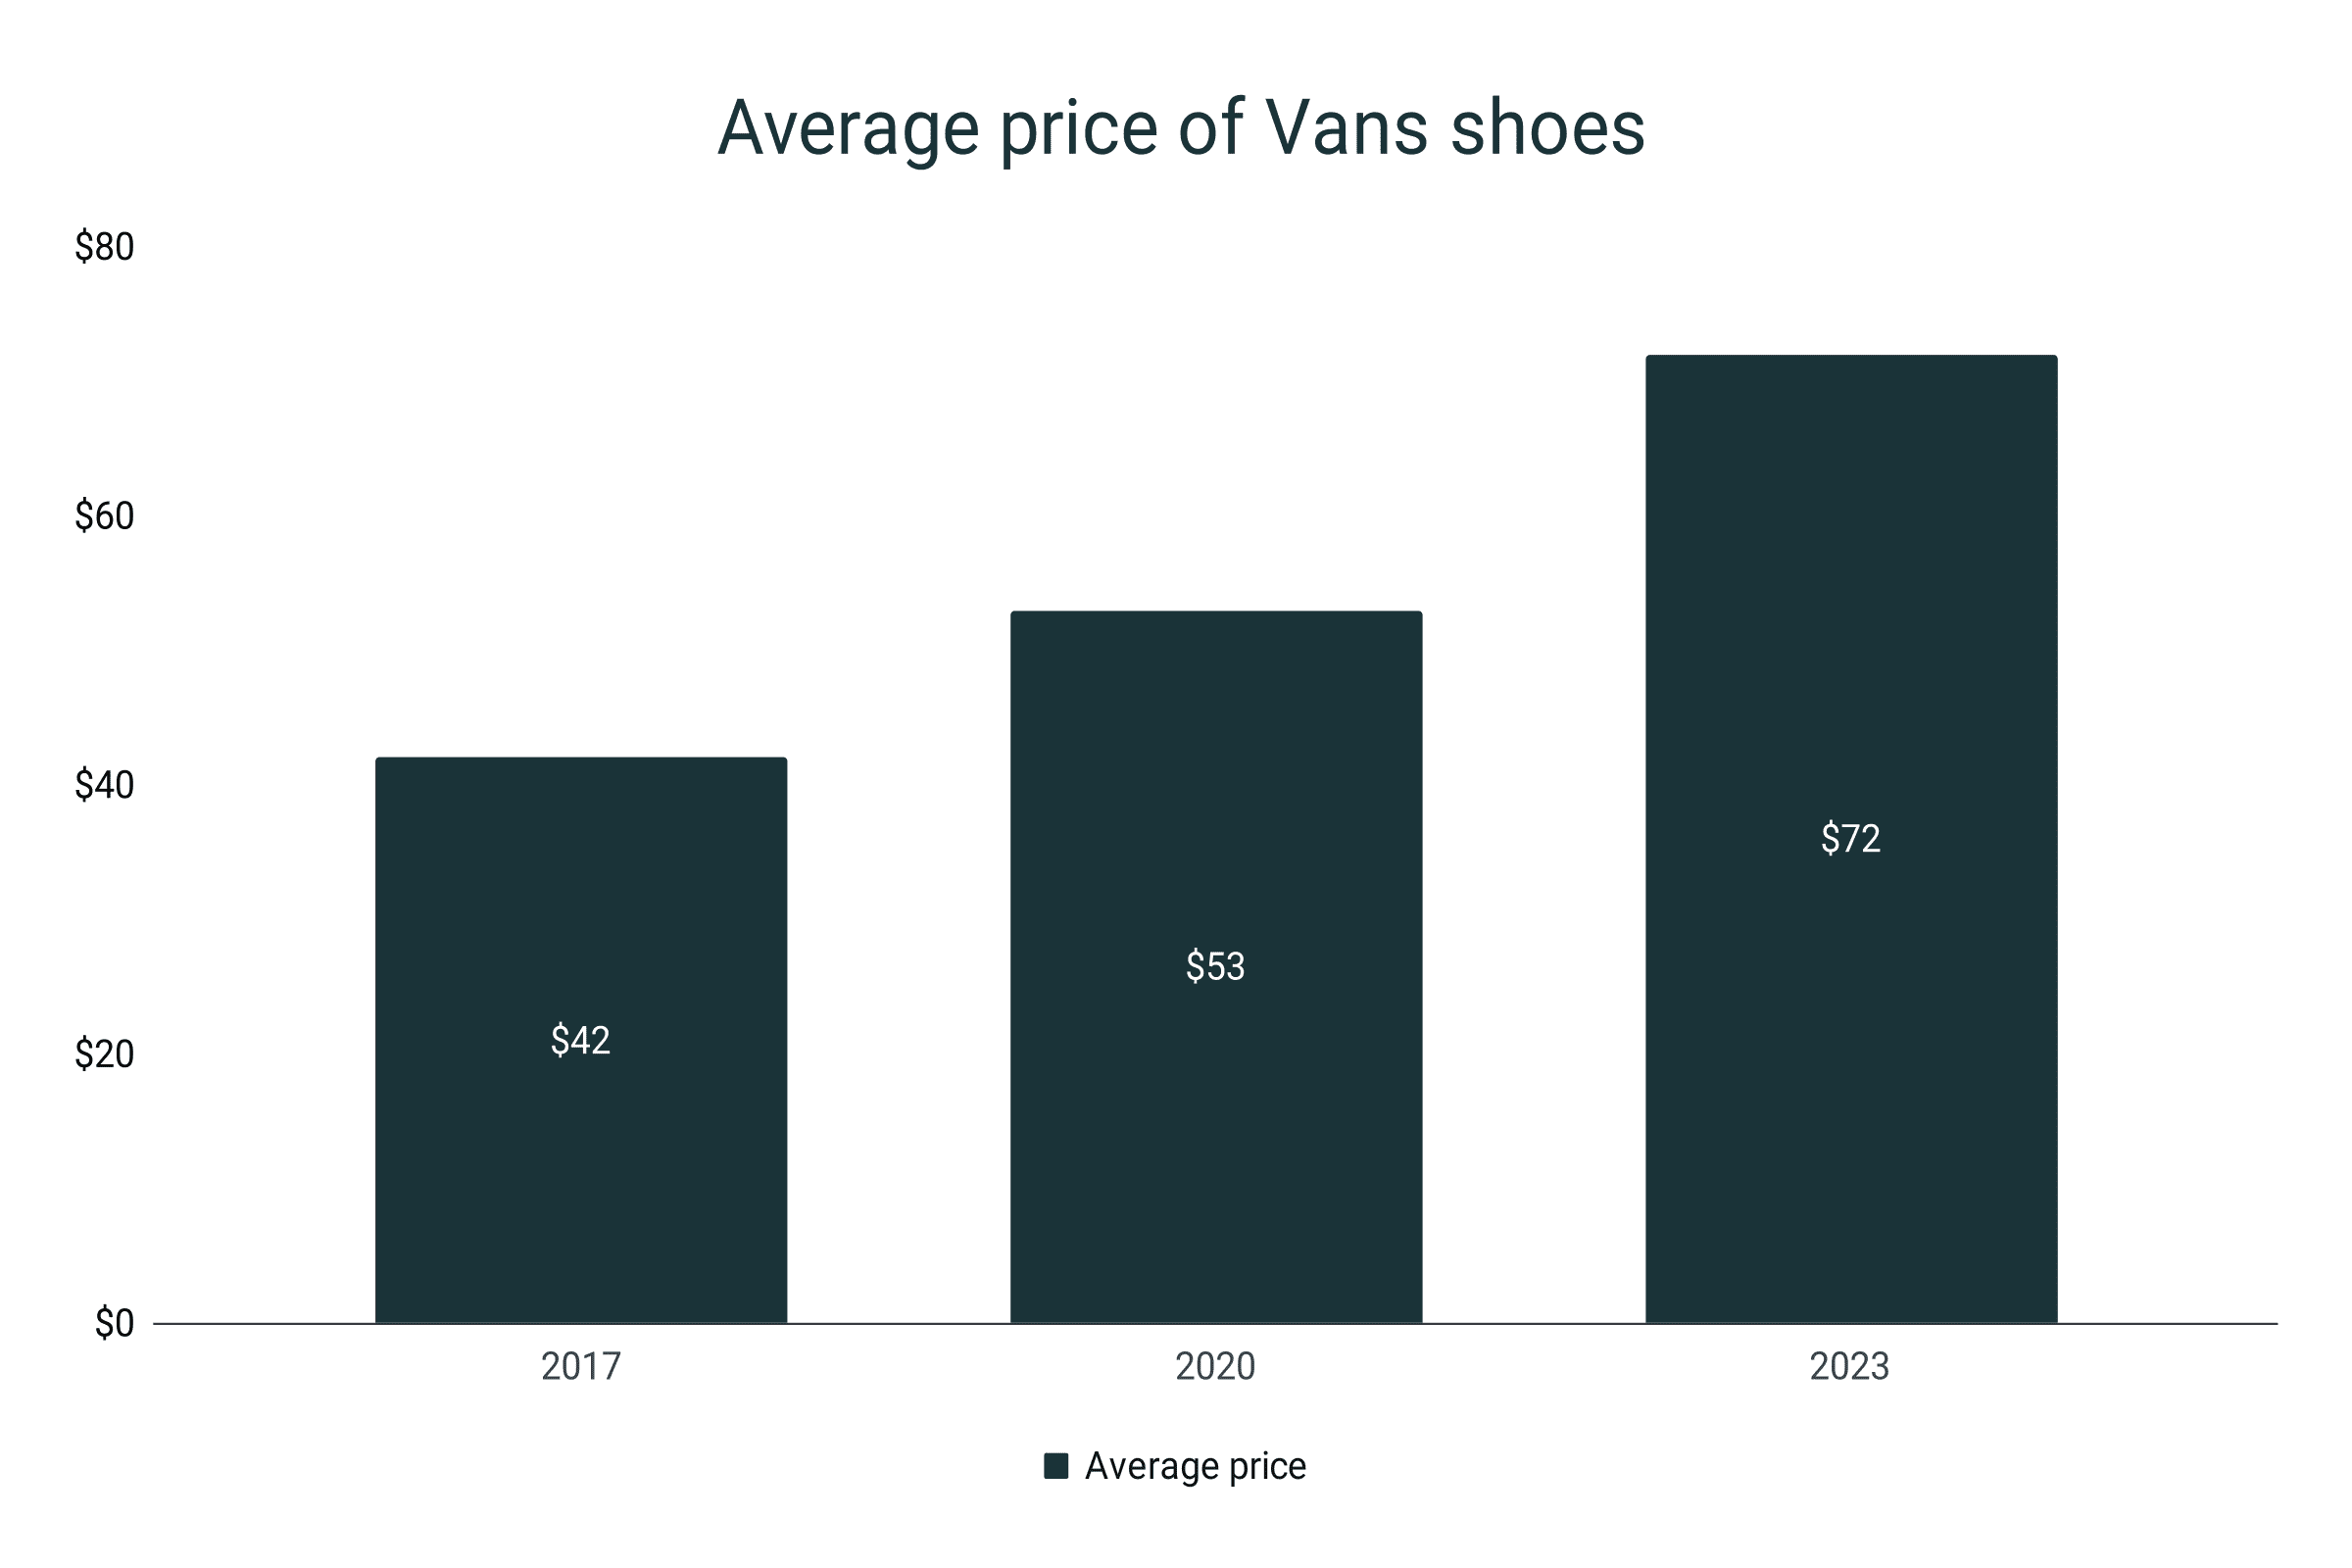
- The average price of a Vans shoe in 2023 is $72. Back in 2017, it was $42.
- A 61% price premium is seen from reselling Vans shoes. On average, a second-hand Vans sells for $121.
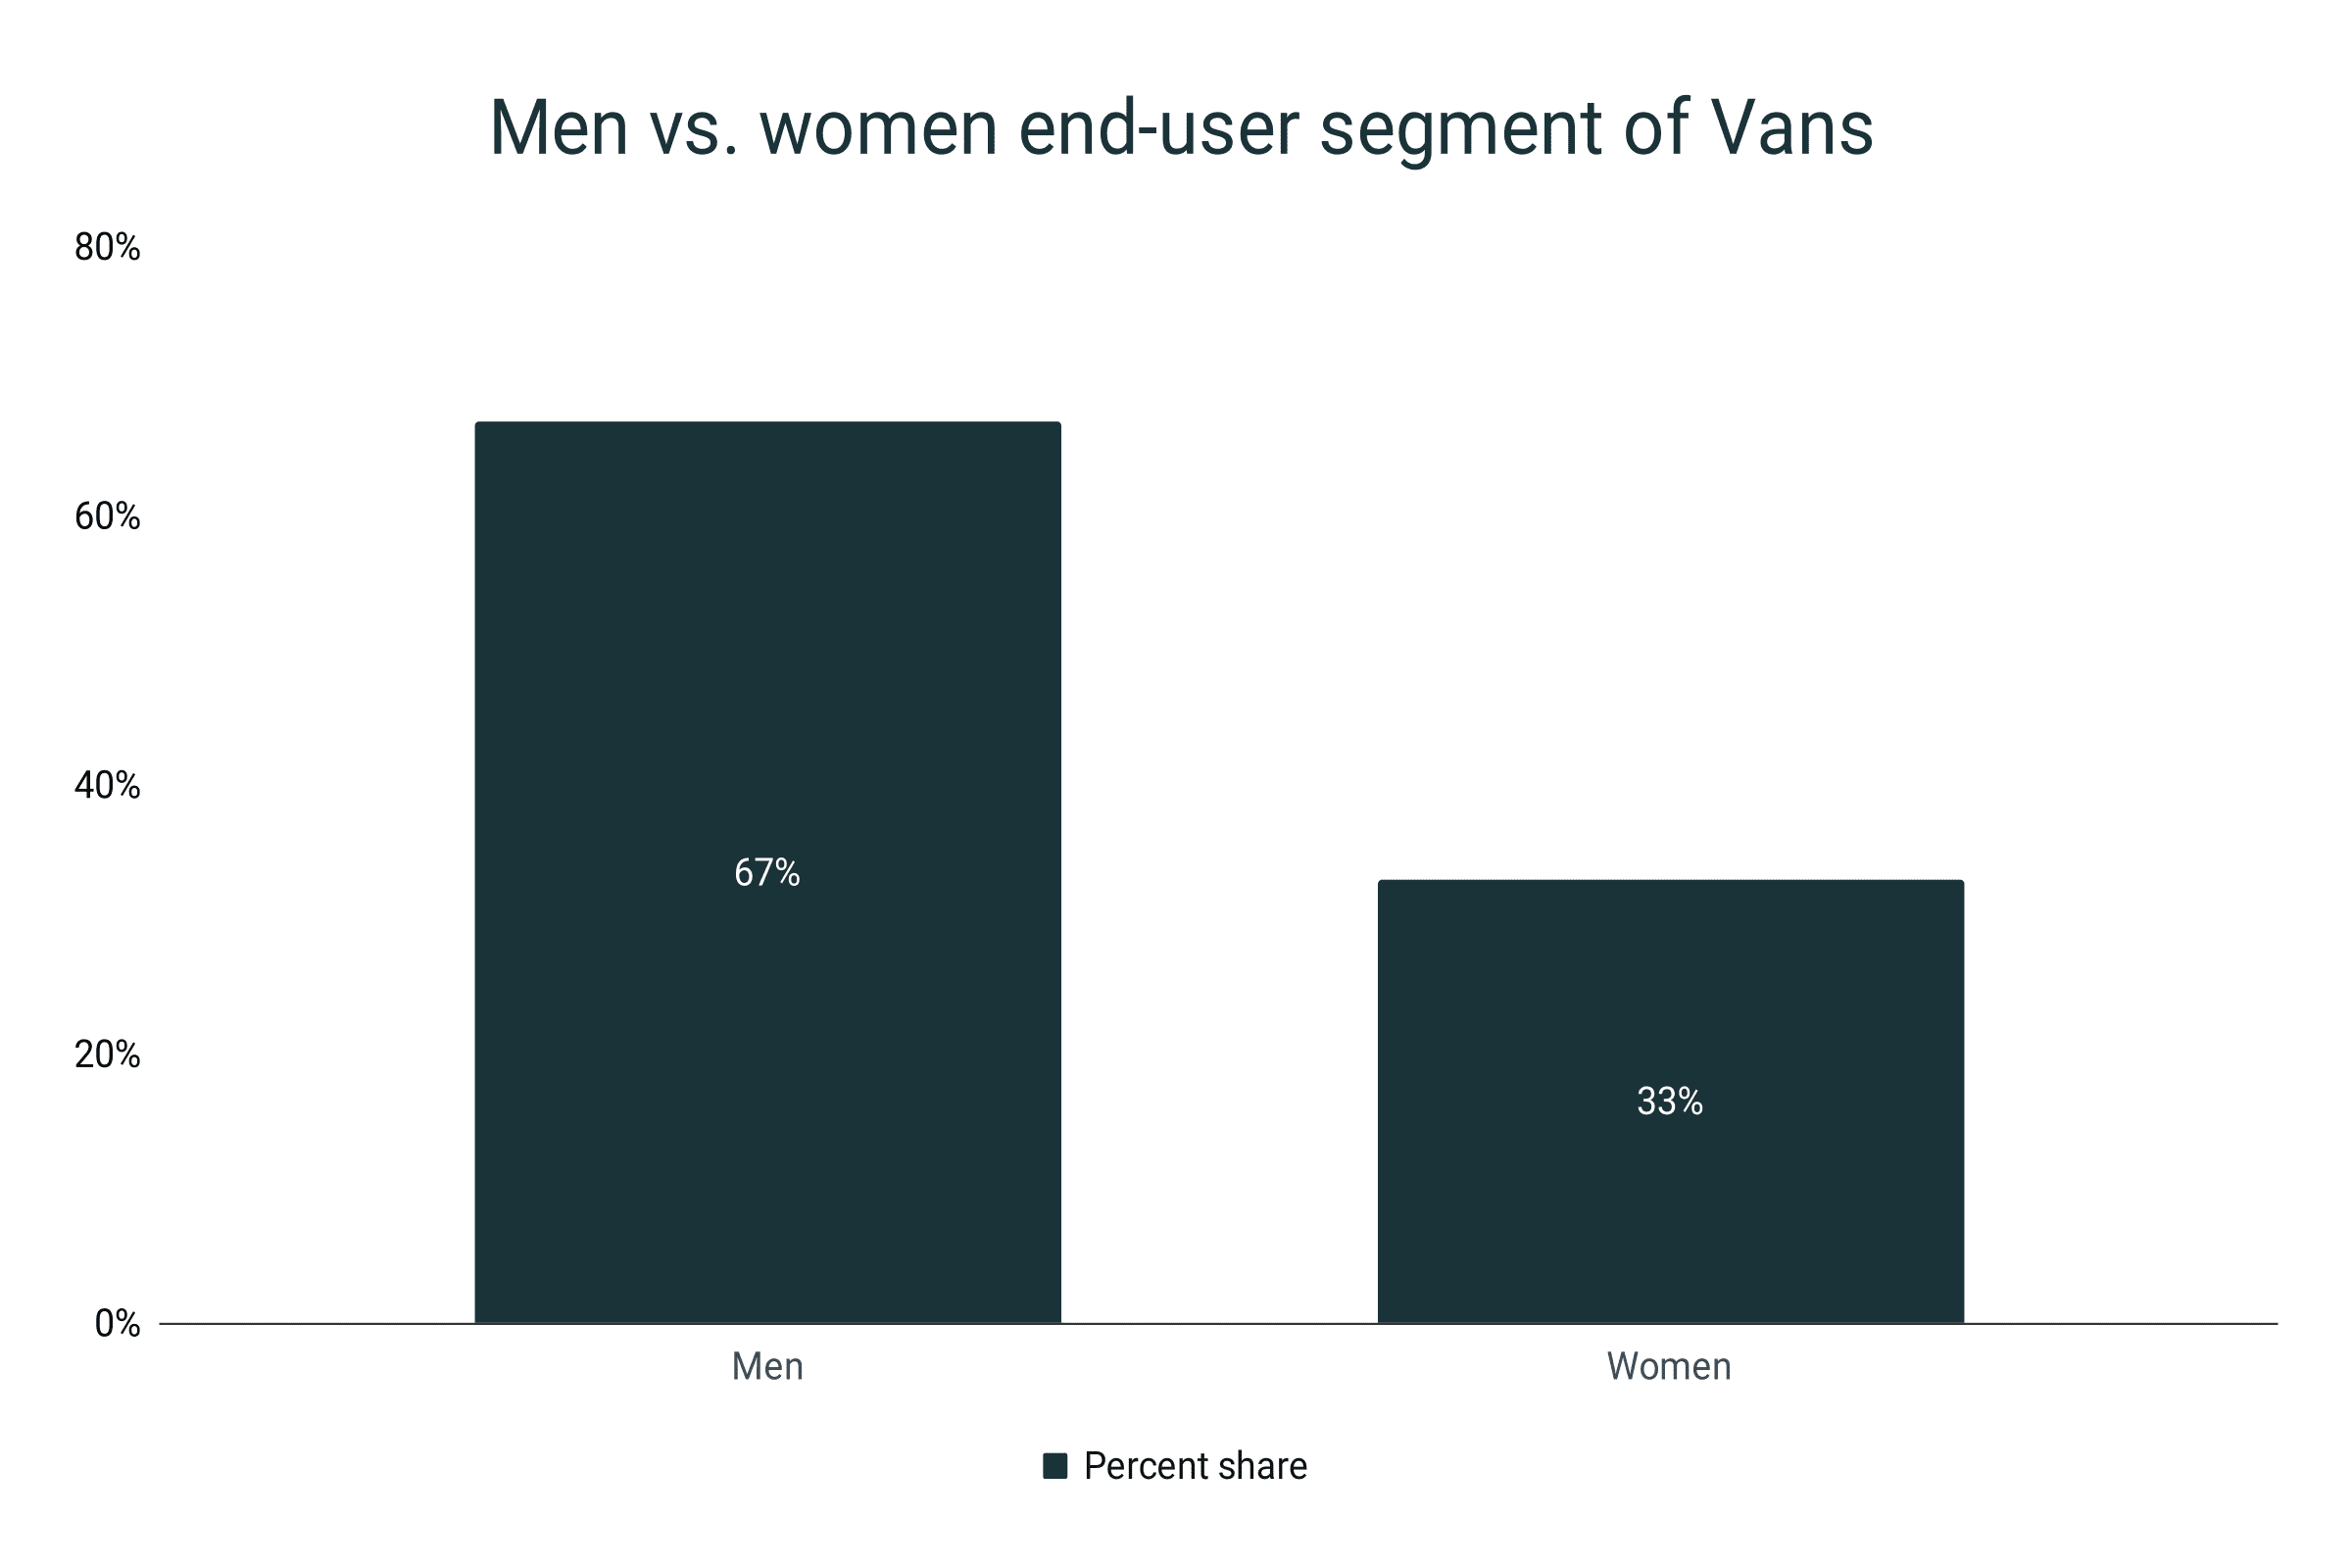
- Sixty-seven percent of Vans shoe sales are driven by male consumers. Only 33% is from women.
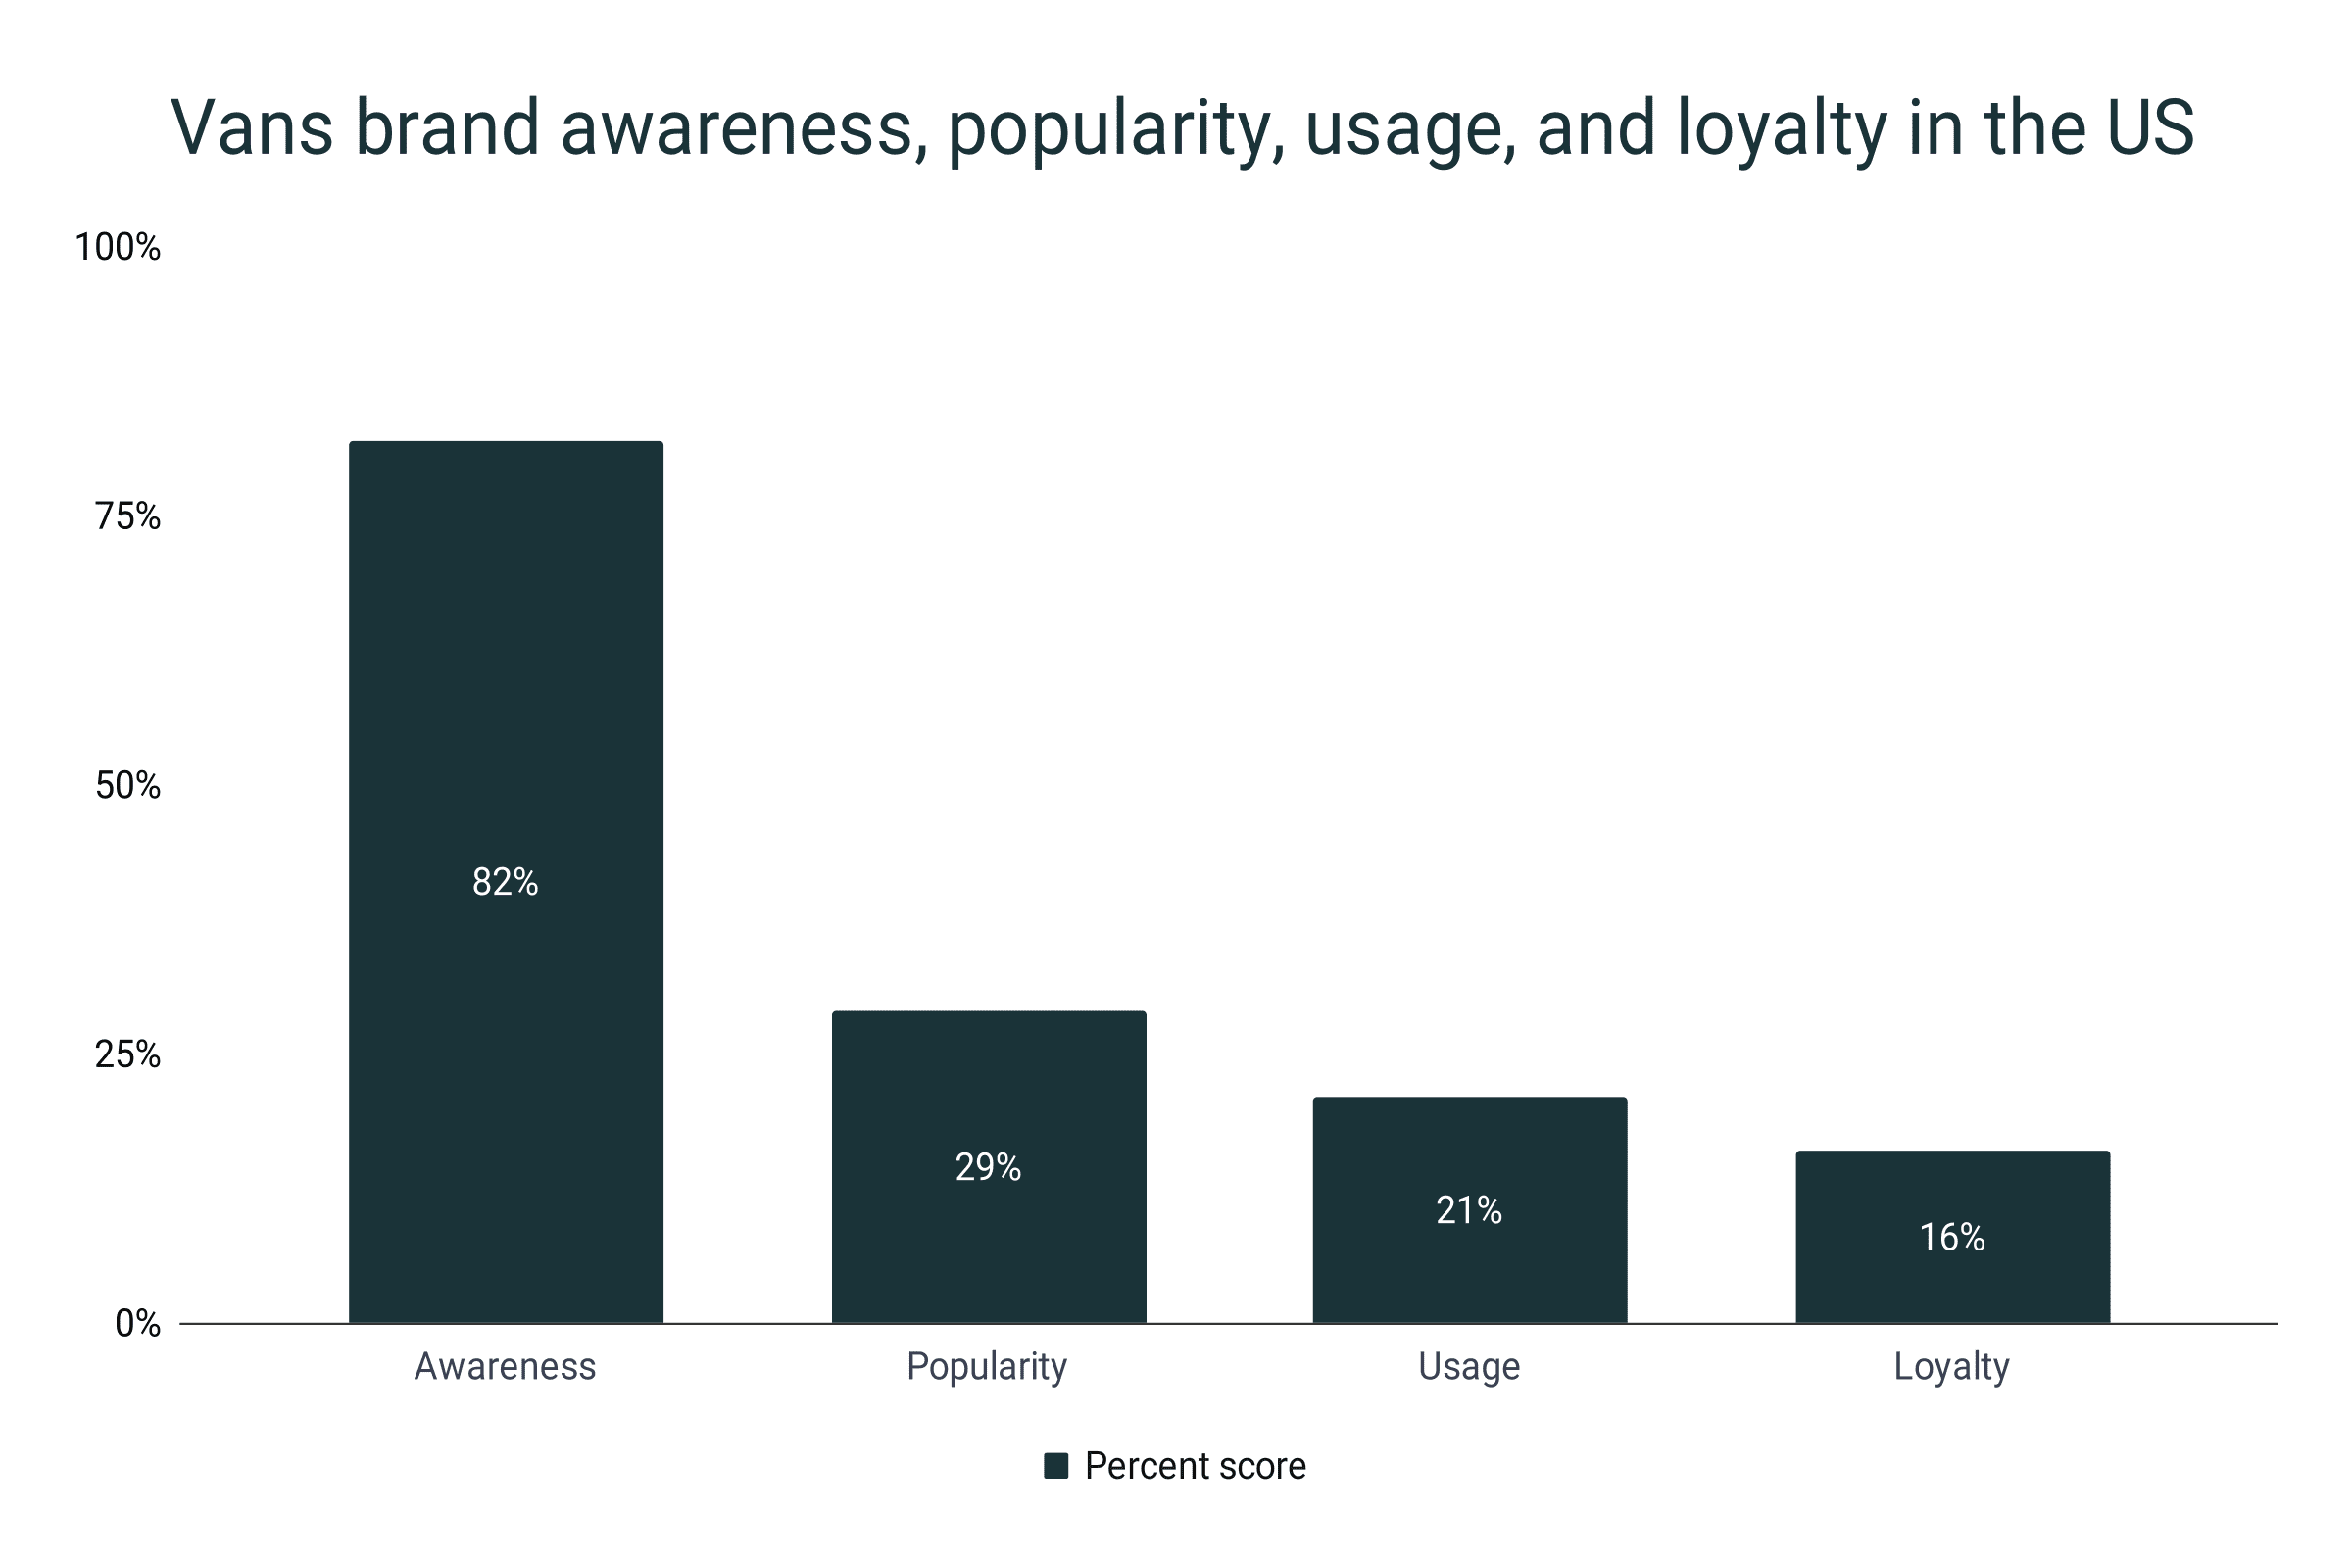
- About 21% of the American population is using Vans. But, only 16% have said they are loyal to the brand.
Vans shoe revenue
- Vans shoe brand closed its 2023 fiscal year in April with a total of $3.7 billion in revenue.
- This is 12% lower compared to its showing in 2022 which reached $4.2 billion.
- At the onset of the pandemic, in 2020, Vans’ total revenue amounted to $3.5 billion.
- Much of the effect of the pandemic was felt during the 2021 fiscal year when the company plummeted to a $3.5 billion revenue which is 15% less than the previous year.
- Vans eventually bounced back with a 20% growth from 2021 to 2022.
Vans shoes annual revenue
|
Fiscal year |
Revenue in billion dollars |
Growth |
|
2020 |
$4.1 |
|
|
2021 |
$3.5 |
-15% |
|
2022 |
$4.2 |
20% |
|
2023 |
$3.7 |
-12% |
- The VF Corporation (VFC) lists Vans under its active footwear and apparel section. In the fiscal year of 2023, Vans is 75.5% of this VFC segment.
- Previously, the figure was at 77.8%.
- However, looking at the big picture, Vans’ share in the VF active footwear segment has experienced a downward trajectory for the past four years. From 95.9% in 2020, it dipped to a 75.5% share in 2021.
Vans share in VFC active footwear sales
|
Fiscal year |
Percent share |
|
2020 |
95.9% |
|
2021 |
83.3% |
|
2022 |
77.8% |
|
2023 |
75.5% |
Vans shoe revenue by region
- In the 2023 fiscal year, the Americas is still the main revenue source for the Vans shoe brand. The region tallied $2.4 billion in sales as of April 1, 2023.
- However, it is $0.3 billion less than the 2022 figure of $2.7 billion in revenue.
- The lowest revenue accumulated from the Americas was during the pandemic when the company only raked in $2.2 billion.
- Europe remains the second biggest contributor to Vans shoe revenue. It generated $0.8 billion in the 2023 fiscal year.
- Meanwhile, the Asia-Pacific region contributed $0.5 billion and $0.6 billion in the 2023 and 2022 fiscal years, respectively.
- Since 2021, the gap between the European and Asia-Pacific regional sales has been slowly increasing. From a $0.1 billion difference in April 2021, it is now at a $0.3 billion gap by April 2023.
Vans revenue in USD billion by region
|
Fiscal year |
The Americas |
Europe |
Asia-Pacific |
|
2020 |
$2.7 |
$0.8 |
$0.6 |
|
2021 |
$2.2 |
$0.7 |
$0.6 |
|
2022 |
$2.7 |
$0.9 |
$0.6 |
|
2023 |
$2.4 |
$0.8 |
$0.5 |
Vans shoe market share
- In the United States, Vans took a 6.1% share of the entire 2021 footwear market.
- Two years prior, in 2019, the brand was at a steady 5% portion.
- Back in 2004, when the VFC purchased the shoe company, the athletic market share of Vans was only 3.1% in the US.
- Thus, 17 years after the merger, Vans was able to inflate its athletic market presence by 96.8%.
- Additionally, Vans held a steady 7% market portion in the global sneaker industry as of 2022.
- In the skateboarding shoes segment, Vans currently occupies a 10.1% global market share.
Vans shoe market share in the US
|
Year |
Percent share |
|
2004* |
3.1% |
|
2019 |
5% |
|
2021 |
6.1% |
*VF Corp acquires Vans
Vans shoe production
- In 2021, it has sold over 105 million pairs of shoes. This is 5.5% more than the 99.5 million figure in 2020.
- From 2 million pairs of shoes manufactured in 1987, the shoe company has skyrocketed by 3400% to reach the 70-million mark in 2017 in a span of thirty years.
- The shoe production of Vans grew steadily, reaching 75 million and 81 million in 2018 and 2019, respectively.
- Based on data, 98% of all Vans sold in the US are made abroad.
- Of this number, 95% are made in China.
Vans shoe production by year
|
Year |
Million pairs |
Growth |
|
1987 |
2 |
|
|
2017 |
70 |
3400% |
|
2018 |
75 |
7.1% |
|
2019 |
81 |
8% |
|
2020 |
99.5 |
22.8% |
|
2021 |
105 |
5.5% |
- About 58.3% of all Vans silhouettes today are made for men.
- The kid's shoe department accounts for 22.6% of all Vans shoe models.
- Meanwhile, only 19.1% of the shoes are dedicated to women.
Vans shoes by category
|
Category |
Percent share |
|
Men |
58.3% |
|
Kids |
22.6% |
|
Women |
19.1% |
- In terms of shoe styles, about 37% of Vans shoes are casual.
- 22% are for dress shoes while 16% are athletic silhouettes.
- Other shoe models constitute the remaining 25%.
Vans shoes by style
|
Style |
Percent share |
|
Casual |
37% |
|
Dress |
22% |
|
Athletic |
16% |
|
Others |
25% |
Vans shoe prices
- Based on the RunRepeat database, the average of all Vans shoes as of 2023 is $72.
- In 2020, the average price of a pair of Vans was $53.
- This is equivalent to a 35.8% increase in the average retail price of a Vans shoe.
- In 2017, the mean cost was recorded at $42. Additionally, in 2017, the average price of a men’s footwear from Vans is $50.
- The for-her shoes, on the other hand, cost $40 on average.
- In terms of the secondary market, the mean price tag of a Vans resale shoe is $121.
- Equivalently, this means that a 61% premium is charged for reselling a Vans shoe.
Average price of Vans shoes
|
Year |
Average price |
|
2017 |
$42 |
|
2020 |
$53 |
|
2023 |
$72 |
Vans shoe brand popularity among consumers
- About 67% of the total sales of Vans are generated from the men’s footwear section.
- Only 33% is coming from the women’s department.
Men vs. women end-user segment of Vans
|
Gender |
Percent share |
|
Men |
67% |
|
Women |
33% |
- In the United States, 82% of shoe shoppers are aware of the Vans shoe brand.
- However, in terms of popularity, Vans only scored 29%.
- Of the American population, about 21% are using Vans.
- But only 16% are reported to be loyal to the brand.
Vans brand awareness, popularity, usage, and loyalty in the United States
|
Parameter |
Percent score |
|
Awareness |
82% |
|
Popularity |
29% |
|
Usage |
21% |
|
Loyalty |
16% |
Sources
https://www.openpr.com/news/2067649/skateboard-shoes-market-to-witness-huge-growth-by-2026-fallen
https://www.slideshare.net/NobueHsinHuiChen/vans-6months-plan-pdf
https://www.nbcnews.com/id/wbna11026473
https://www.comparably.com/brands/vans
https://www.voguebusiness.com/companies/vans-teens-favourite-brand-piper-jaffray-survey
https://footwearnews.com/business/retail/teens-top-shoe-brands-nike-vans-adidas-1202853544/
https://shoeeffect.com/how-many-vans-shoes-were-sold-in-2021/
https://shoeeffect.com/how-many-vans-shoes-are-sold-each-year/
https://footwearnews.com/shoes/outdoor-footwear/10-most-iconic-vans-sneakers-shoes-photos-201228/
https://wearablyweird.com/where-are-vans-made/
https://www.choozeshoes.com/where-are-vans-shoes-made/
https://www.statista.com/forecasts/1351946/vans-sneakers-brand-profile-in-the-united-states
