Sneaker Industry Statistics
This page presents the latest figures on the sneaker industry, production numbers, market share distribution, as well as projections for the next ten years.
Sneaker market overview
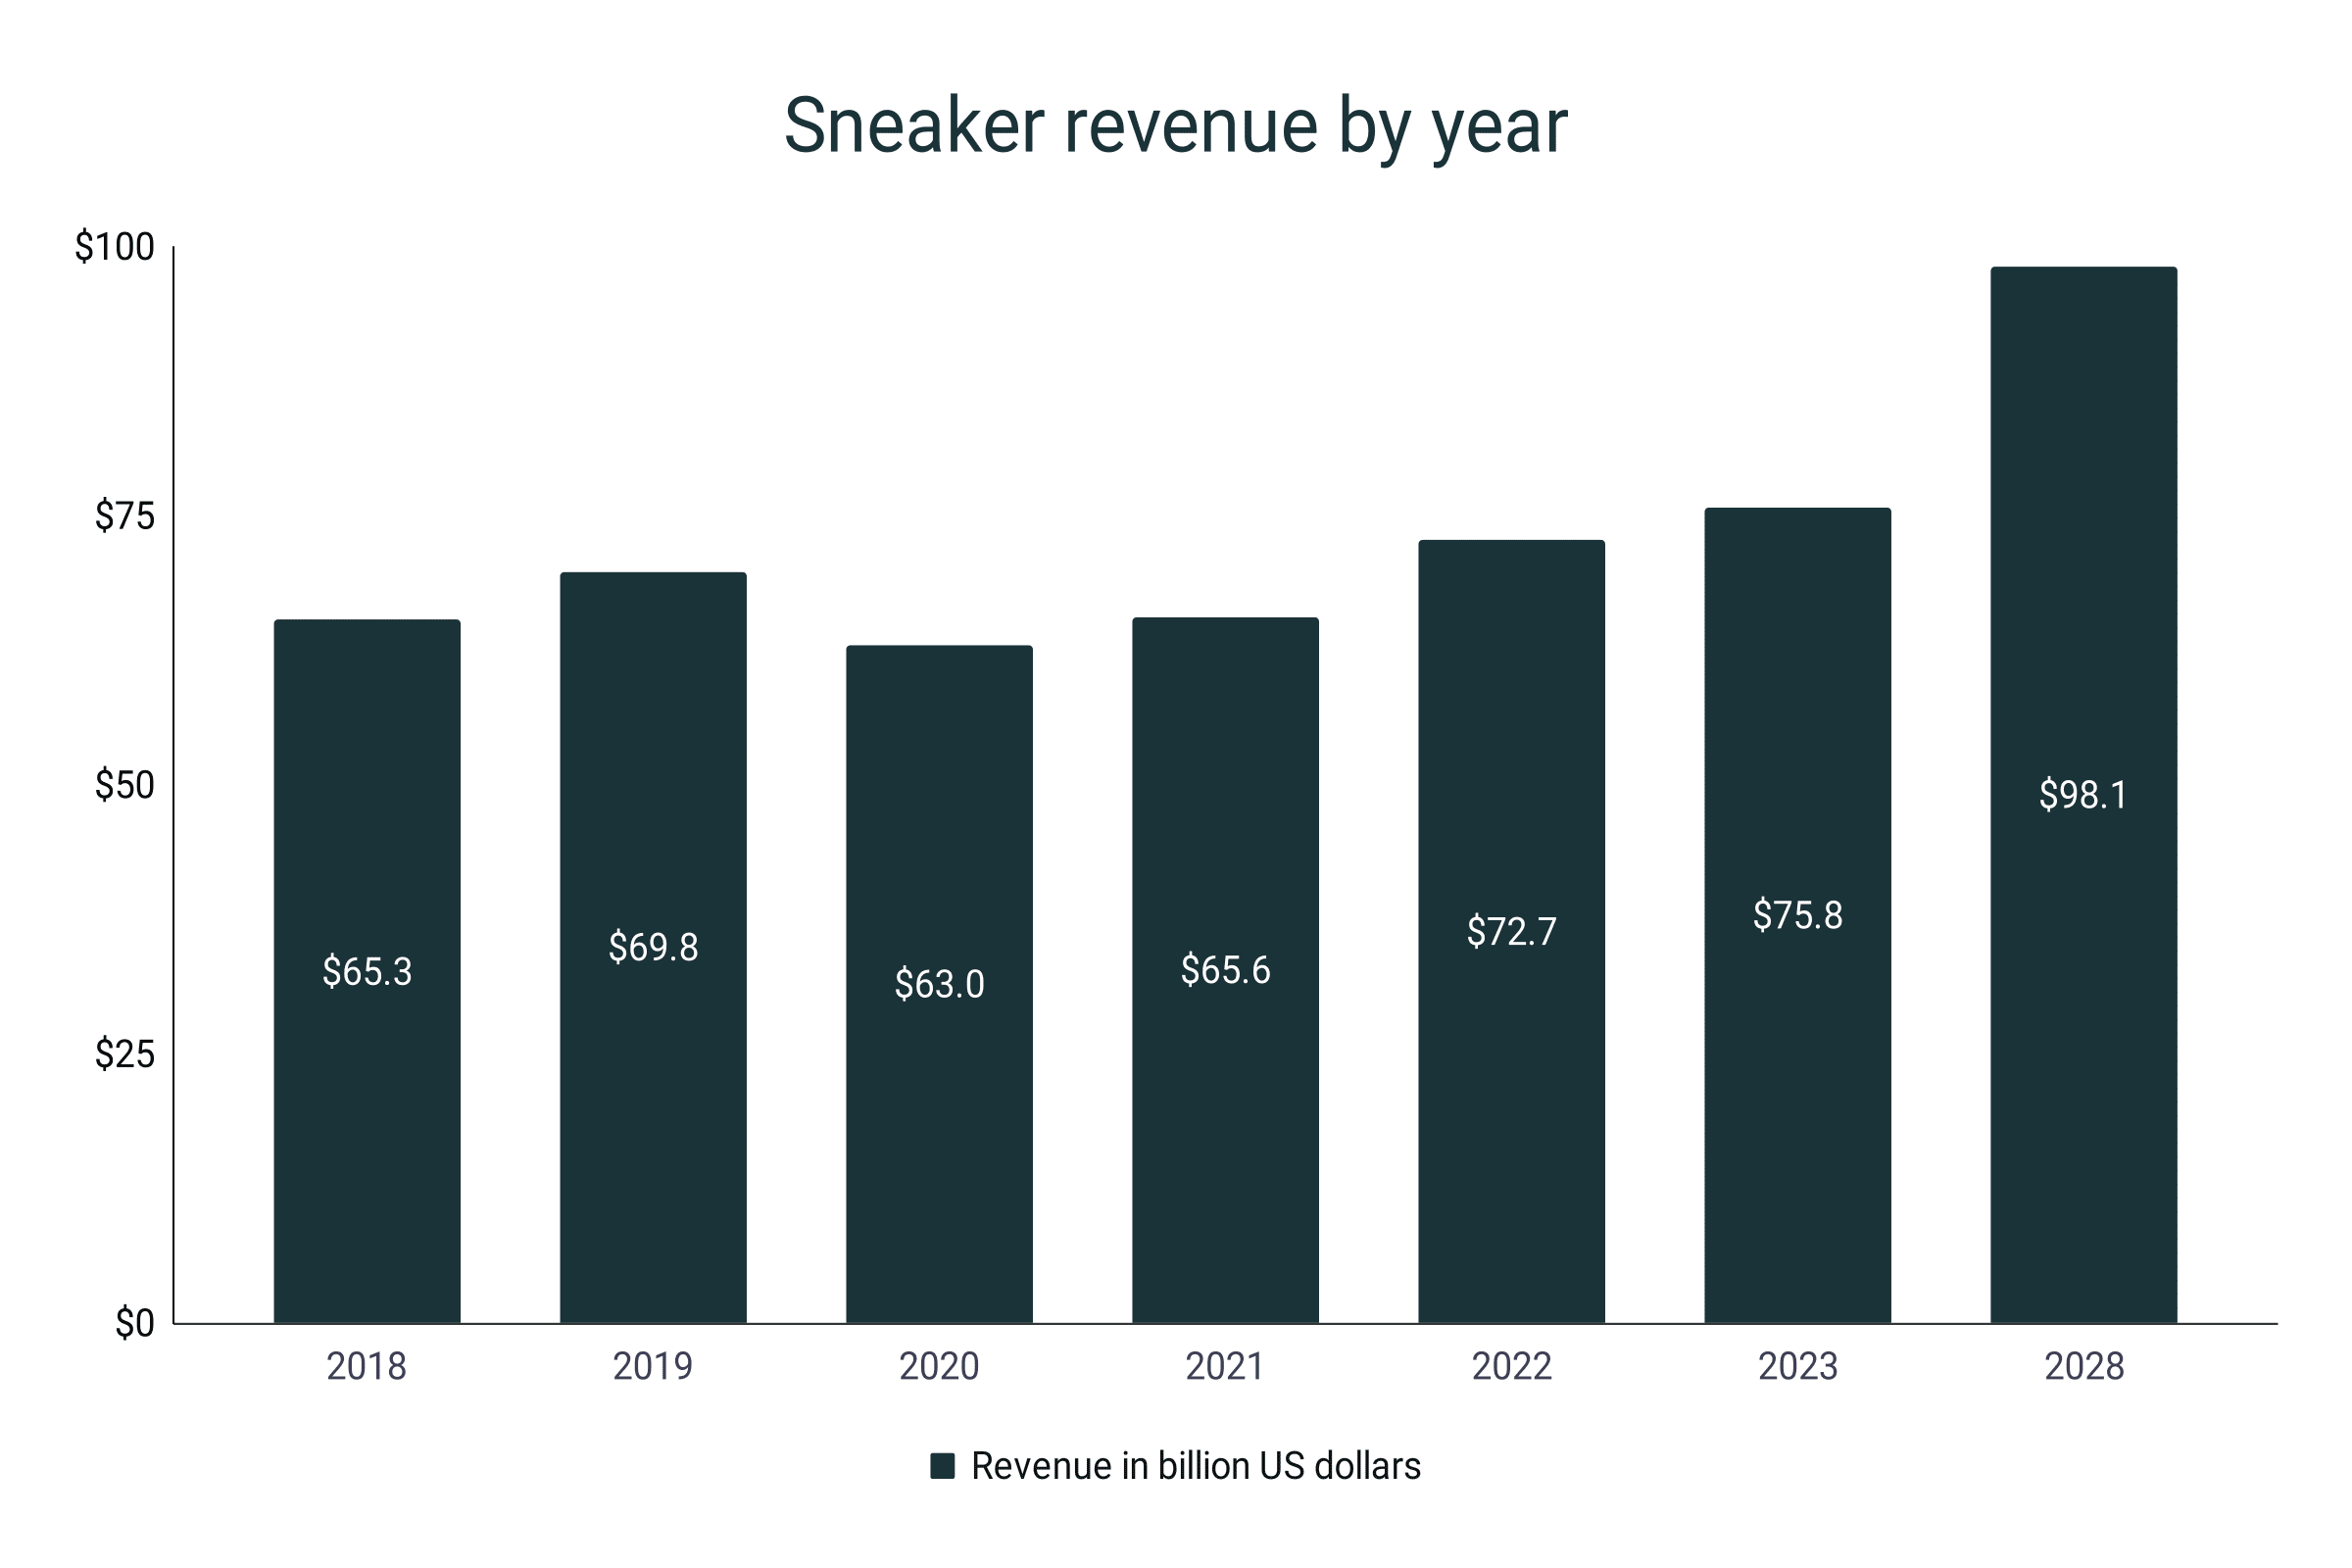
- The global sneaker market will reach a whopping $75.8 billion in revenue in 2023. This will account for 19% of the total footwear sales.
- Sneaker sales will increase by 4.2% compared to the revenue in 2022.
- The revenue from the sneaker industry has grown by 16.1% over the last 5 years.
- Worldwide sneaker revenue is projected to grow at a compound annual growth rate (CAGR) of 5.3% over the next 5 years and is expected to reach $98.1 billion in 2028.
- In 2020, due to the pandemic, sneaker sales dropped by 9.8%. It was the only drop in global sneaker revenue over the past five years.
- With a $22.3 billion expected revenue, the United States remains the top player in the global sneaker market.
- This figure equates to a $9.86 revenue generated per person for 2023.
- With a share of 36.5%, the Asia Pacific ruled the sneaker market in 2021.
- North America snatched the top spot in 2022 with about 30% of the sneaker market. Europe, on the other hand, had a 24% share.
- Over the forecast period of 2023-2029, the women's end-user market will experience a 5.5% compound annual growth.
- With a CAGR of 6.9%, the mid-top segment is the fastest-growing sneaker type market for the same forecast period.
|
Year |
Revenue (in billions) |
Growth |
|
2018 |
$65.3 |
|
|
2019 |
$69.8 |
6.9% |
|
2020 |
$63.0 |
-9.8% |
|
2021 |
$65.6 |
4.2% |
|
2022 |
$72.7 |
10.8% |
|
2023 |
$75.8 |
4.2% |
|
2028 |
$98.1 |
29.5% |
Sneaker revenue by brand
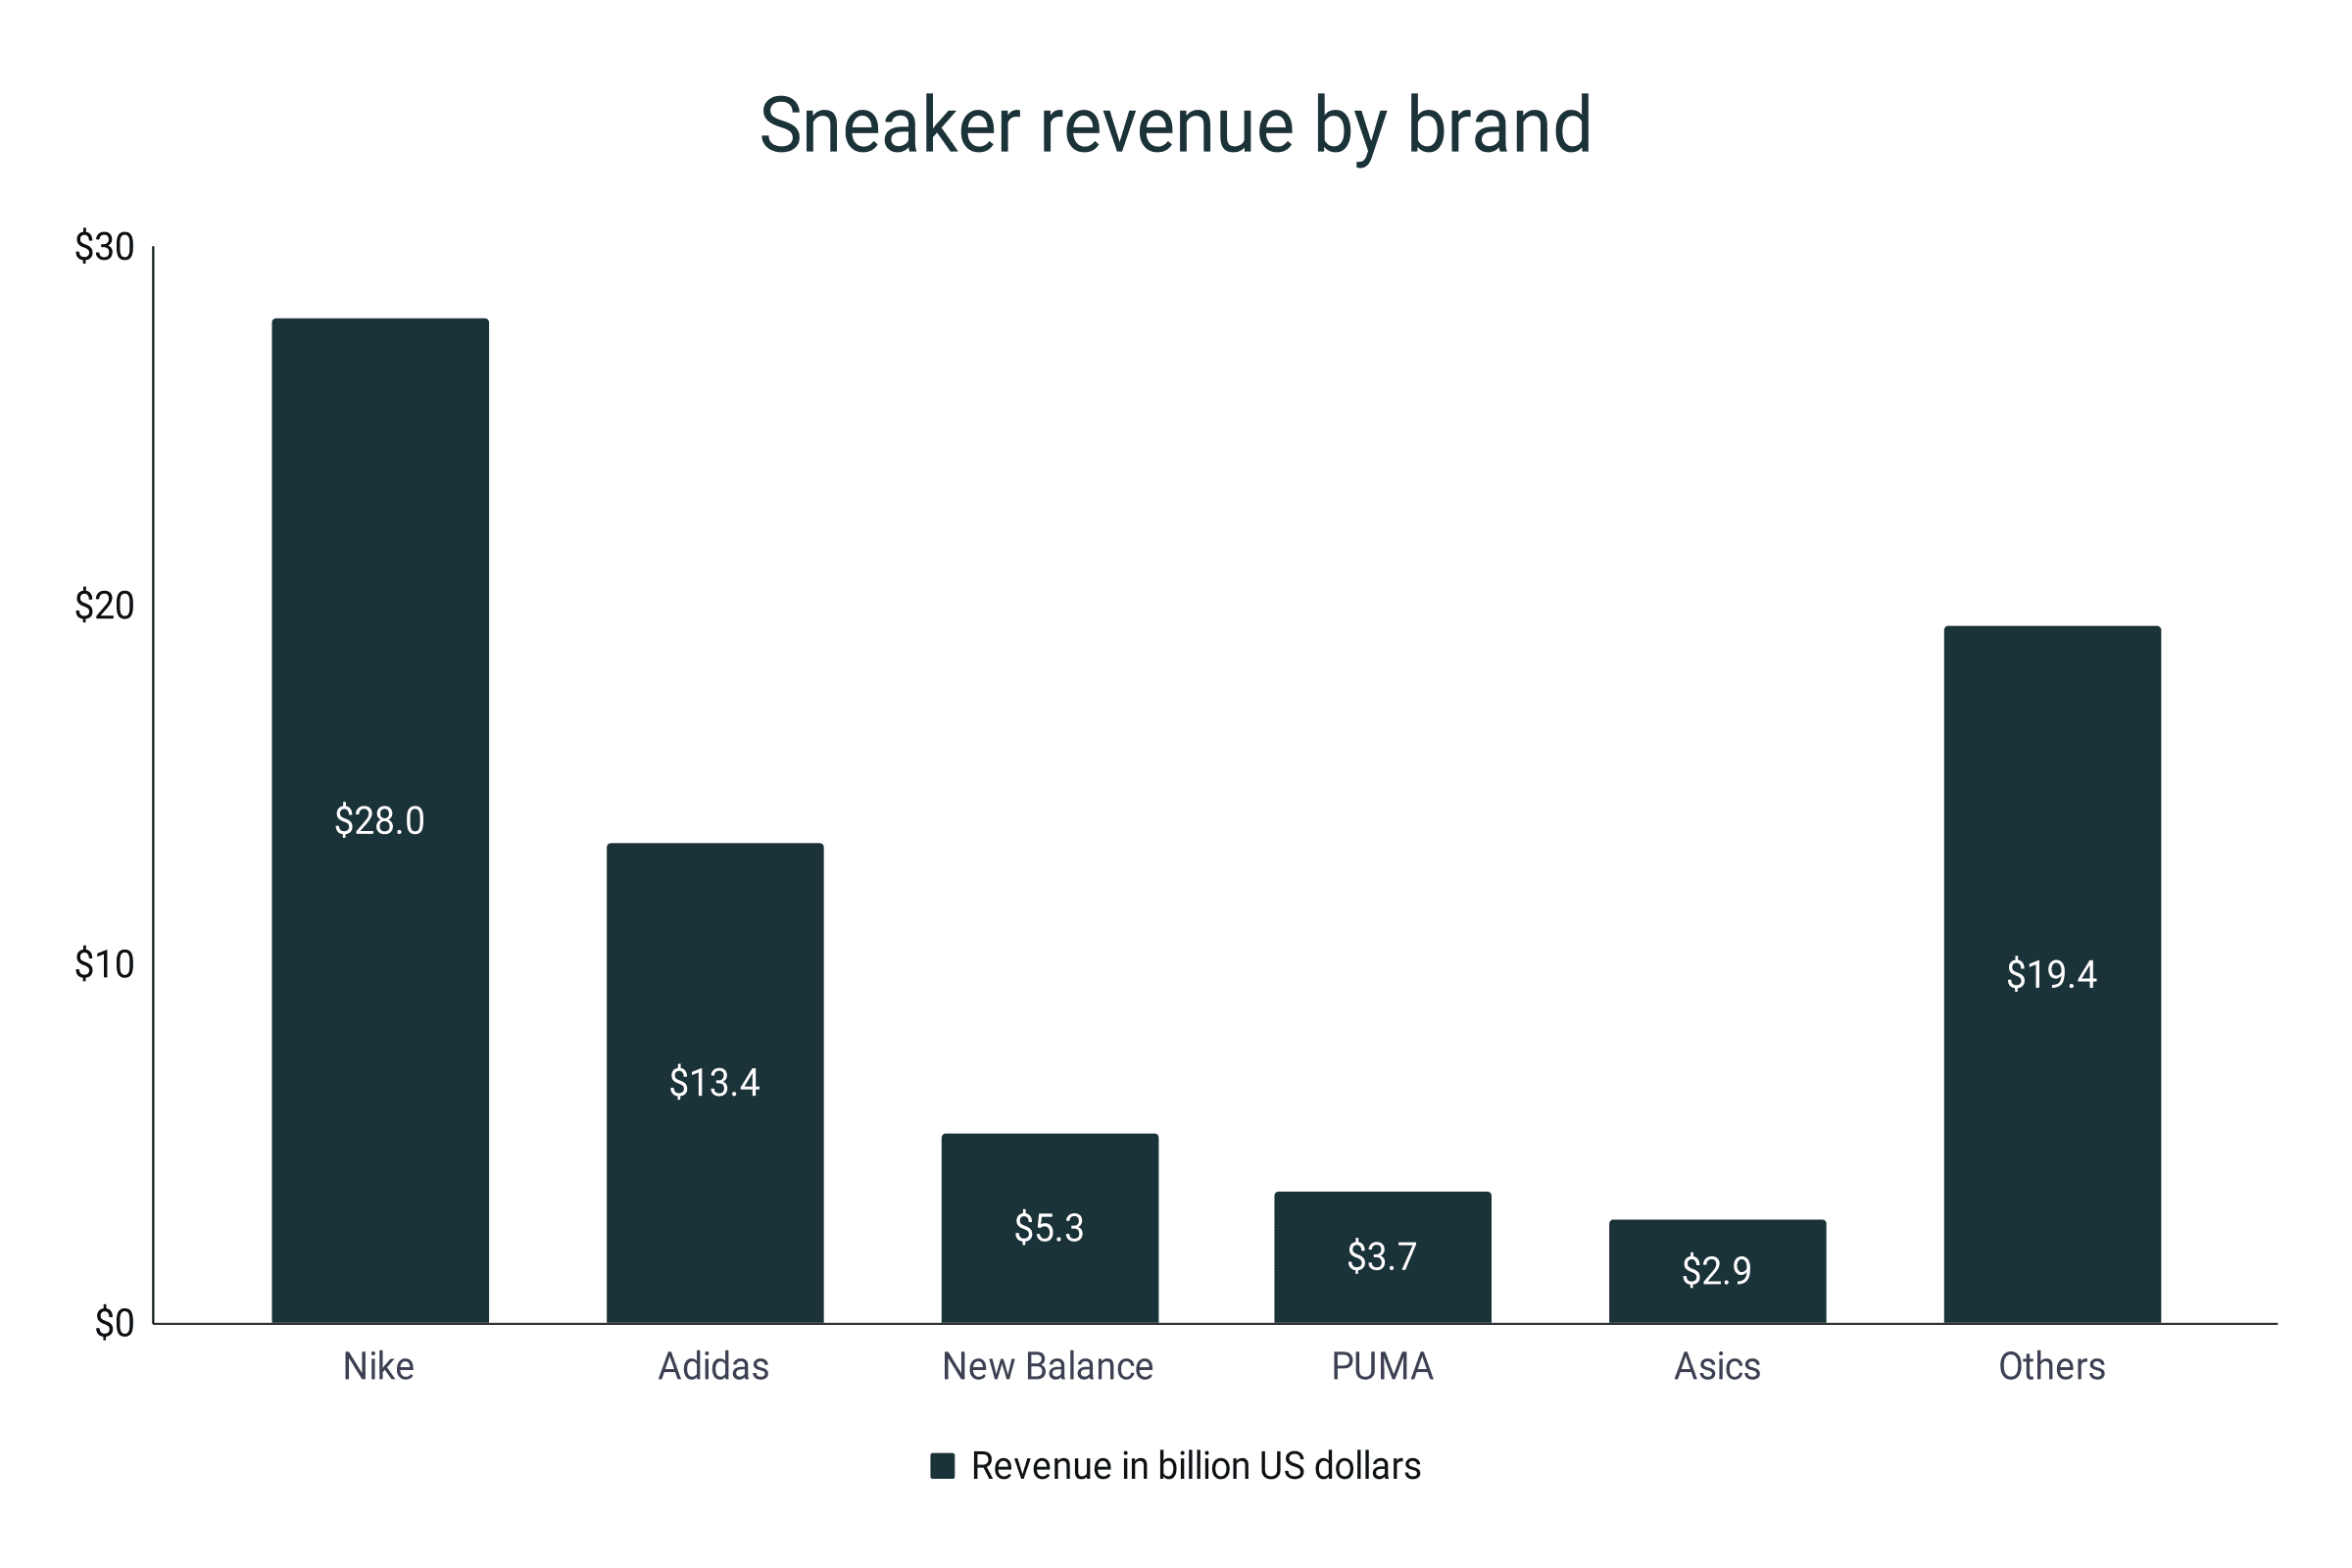
- Data from 2022 reveals that Nike leads in global sneaker revenue with $28 billion.
- Adidas is far second at $13.4 billion, an 18.4% share in the worldwide sneaker market.
- Nike and adidas combined hold about 57% of the entire sneaker industry.
- Trailing in the third spot for top global sales in 2022 is New Balance with $5.3 billion.
- PUMA ($3.7B), and ASICS ($2.9B) complete the top 5 list in fourth and fifth, respectively.
- If we combine the revenues of adidas, New Balance, PUMA, and ASICS in 2022, Nike still outperforms the total share by 3.7%.
- The entire sneaker revenue generated by other companies amounted to $19.4 billion. This is roughly equivalent to a 26.7% market share.
Sneaker revenue by brand
|
Brand |
Revenue (in billions) |
Share in percent |
|
Nike |
$28.0 |
38.5% |
|
adidas |
$13.4 |
18.4% |
|
New Balance |
$5.3 |
7.3% |
|
PUMA |
$3.7 |
5.1% |
|
ASICS |
$2.9 |
4.0% |
|
Others |
$19.4 |
26.7% |
Sneaker revenue by type
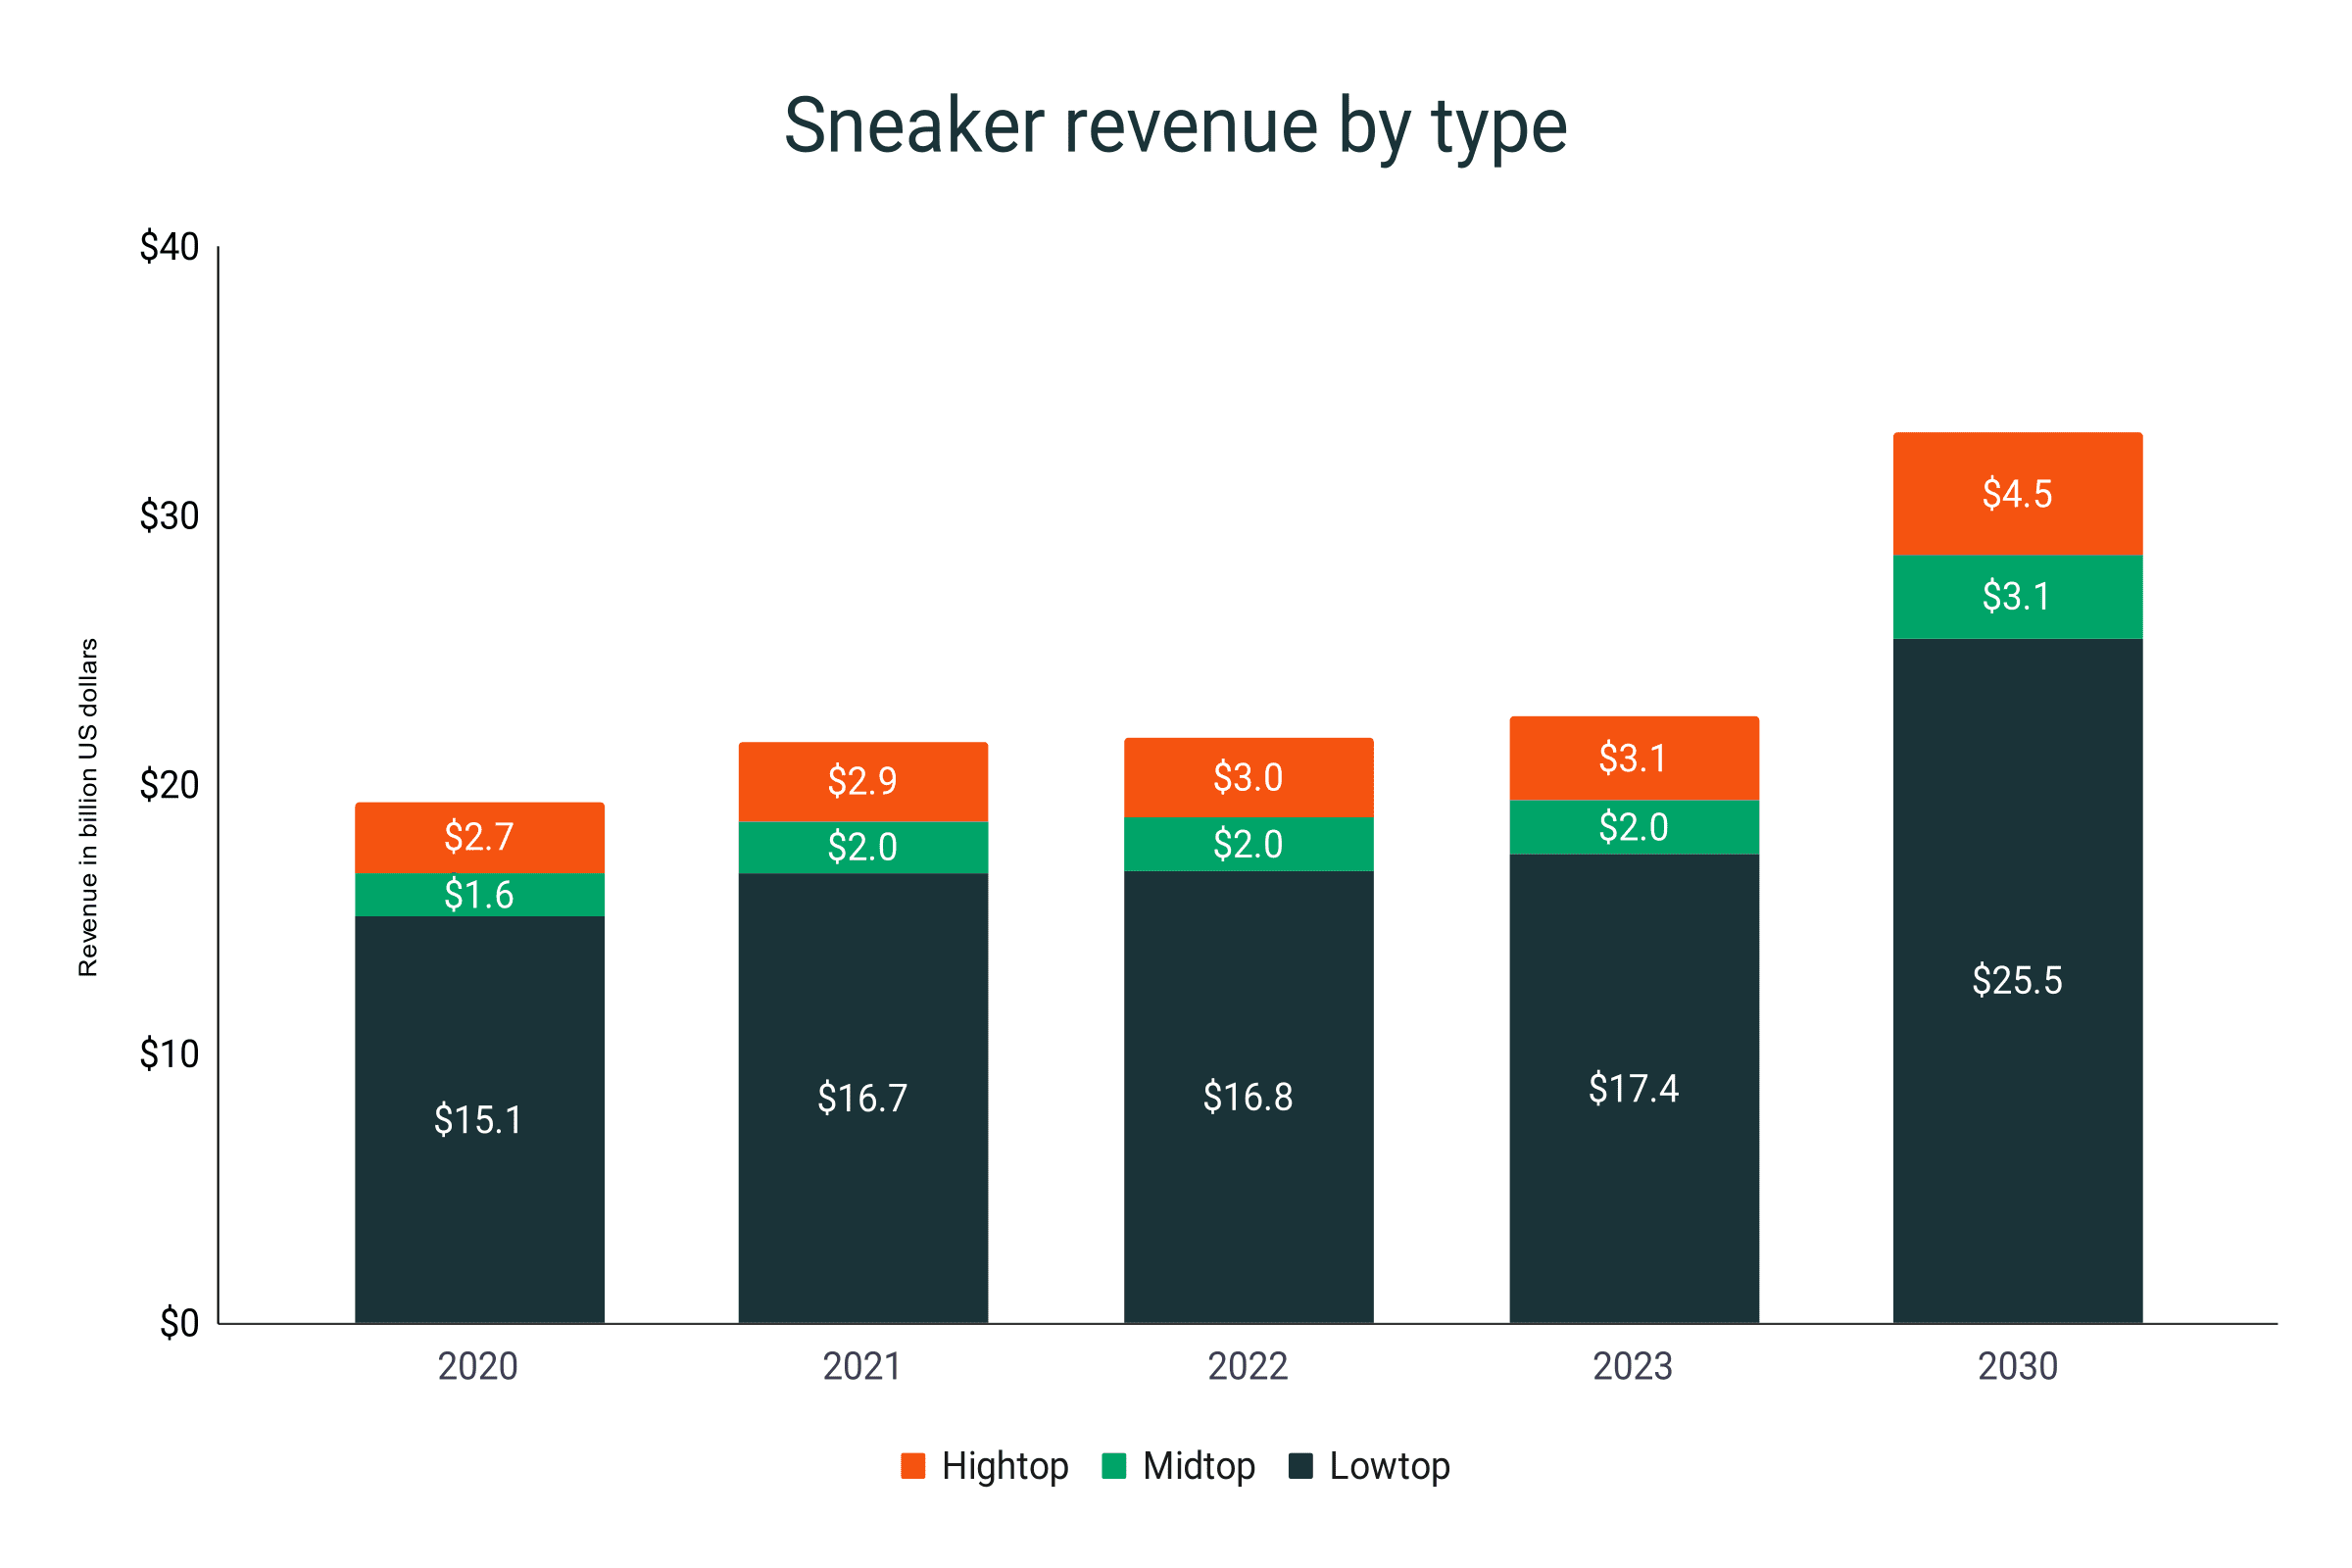
- Low-top sneakers will continue to be the bulk of the global sneaker market. It is expected to amass a total of $17.4 billion in revenues by the end of 2023.
- The ow-top market share will also reach 77.3% share.
- Between 2022 and 2023, the low-top sneaker market will grow by 3.7%.
- Mathematical models estimate that revenues from low-top sneakers will reach $25.5 billion in 2030.
- High-top sneaker market will be a far second at 13.8% share to cap 2023. Mid-top sneakers share will settle at 8.9%.
- By 2030, the high-top revenue will amount to $4.5 billion. Meanwhile, mid-top sales will total $3.1 billion approximately.
- However, in terms of total market share, the high-top sneaker market will drop by 0.07% between 2023-2030.
- Mid-top market will enjoy a 0.36% share increase in the same forecast period.
- The CAGR for the mid-top sneaker segment over 2020-2030 is 2.9%.
Sneaker revenue by type (in billion US dollars)
|
Year |
Hightop |
Midtop |
Lowtop |
|
2020 |
$2.7 |
$1.6 |
$15.1 |
|
2021 |
$2.9 |
$2.0 |
$16.7 |
|
2022 |
$3.0 |
$2.0 |
$16.8 |
|
2023 |
$3.1 |
$2.0 |
$17.4 |
|
2030 |
$4.5 |
$3.1 |
$25.5 |
Sneaker revenue by country
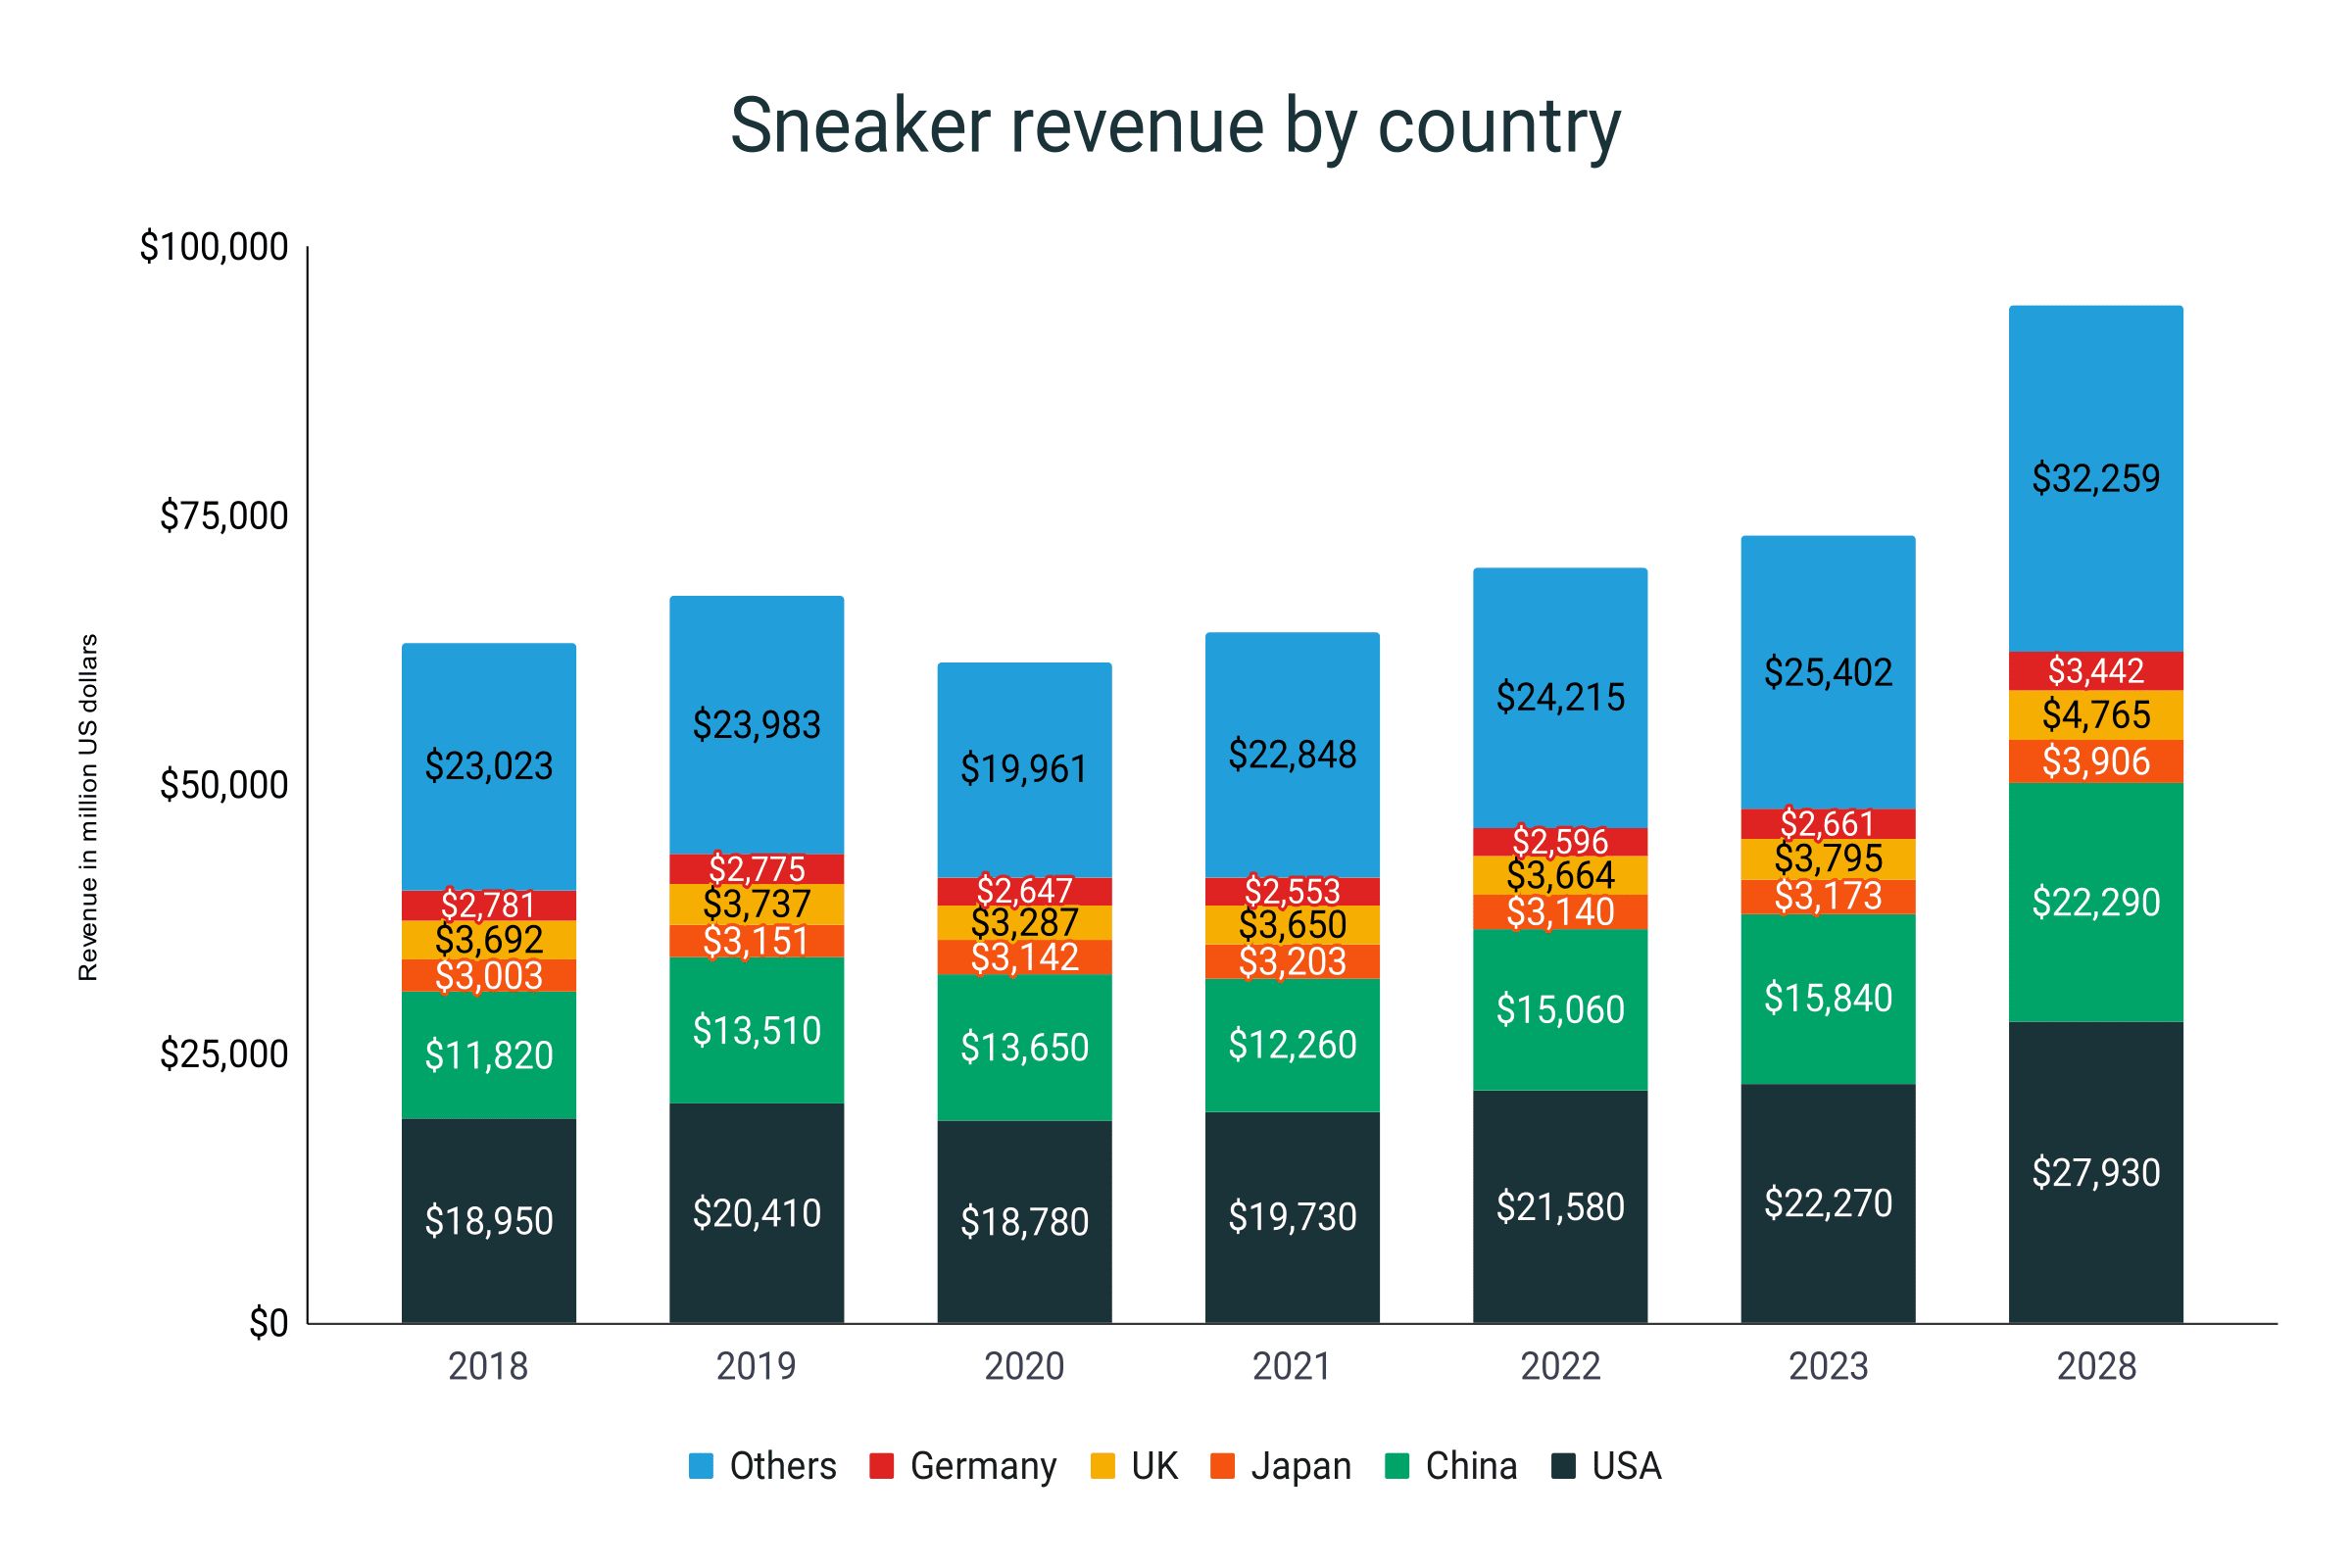
- The United States will lead the 2023 sneaker market with a $22.3 billion revenue.
- The US will be way ahead by about $6.5 billion of the $15.8 billion sales of China.
- During the 2018-2023 period, US sneaker sales will register a 14.9% growth.
- By estimates, the United States sneaker revenue will balloon to $27.9 billion by the end of 2028, equivalent to a 25.4% increase compared to figures in 2023.
- In 2020, during the COVID-19 pandemic, all sneaker markets saw a decrease in sales except for China which managed to increase its revenue by 1.5% from 2019 to 2020.
- By the end of 2028, mathematical models approximate China’s sneaker sales to reach $22.3 billion, joining the United States in the 20-billion-dollar industry mark.
- China is forecasted to be the fastest-growing sneaker market. It is expected to increase its 2023 figures by 40.7% by 2028.
- The United Kingdom is the third biggest sneaker market in 2022 raking up $3.7 billion.
- Great Britain is projected to tally $3.8 billion by 2023, signifying a 2.7% increase. This is the lowest growth seen among the market players of the world.
- Japan, Germany, and India will trail as the fourth, fifth, and sixth biggest sneaker markets by 2023 with $3.2, $2.7, and $2.6 billion in revenues.
- During the 2018-2023 period, India exhibited the greatest revenue increase with 23.1%.
- Among the top markets, Germany is the only one which showed signs of slowing down after registering a 4.5% dip from 2018 and 2023 total sales.
- The rest of the countries of the world combined will total $25.4 billion in revenue in 2023.
Sneaker Revenue by country (in billion US dollars)
|
Year |
USA |
China |
Japan |
UK |
Germany |
India |
Others |
|
2018 |
$19.0 |
$11.8 |
$3.0 |
$3.7 |
$2.8 |
$2.0 |
$23.0 |
|
2019 |
$20.4 |
$13.5 |
$3.2 |
$3.7 |
$2.8 |
$2.3 |
$24.0 |
|
2020 |
$18.8 |
$13.7 |
$3.1 |
$3.3 |
$2.6 |
$1.5 |
$20.0 |
|
2021 |
$19.7 |
$12.3 |
$3.2 |
$3.7 |
$2.6 |
$1.4 |
$22.8 |
|
2022 |
$21.6 |
$15.1 |
$3.1 |
$3.7 |
$2.6 |
$2.5 |
$24.2 |
|
2023 |
$22.3 |
$15.8 |
$3.2 |
$3.8 |
$2.7 |
$2.6 |
$25.4 |
|
2028 |
$27.9 |
$22.3 |
$3.9 |
$4.8 |
$3.4 |
$3.5 |
$32.3 |
|
Growth 2018-2023 |
14.9% |
25.4% |
5.4% |
2.7% |
-4.5% |
23.1% |
9.4% |
|
Growth 2023-2028 |
25.4% |
40.7% |
23.1% |
25.6% |
29.3% |
35.0% |
27.0% |
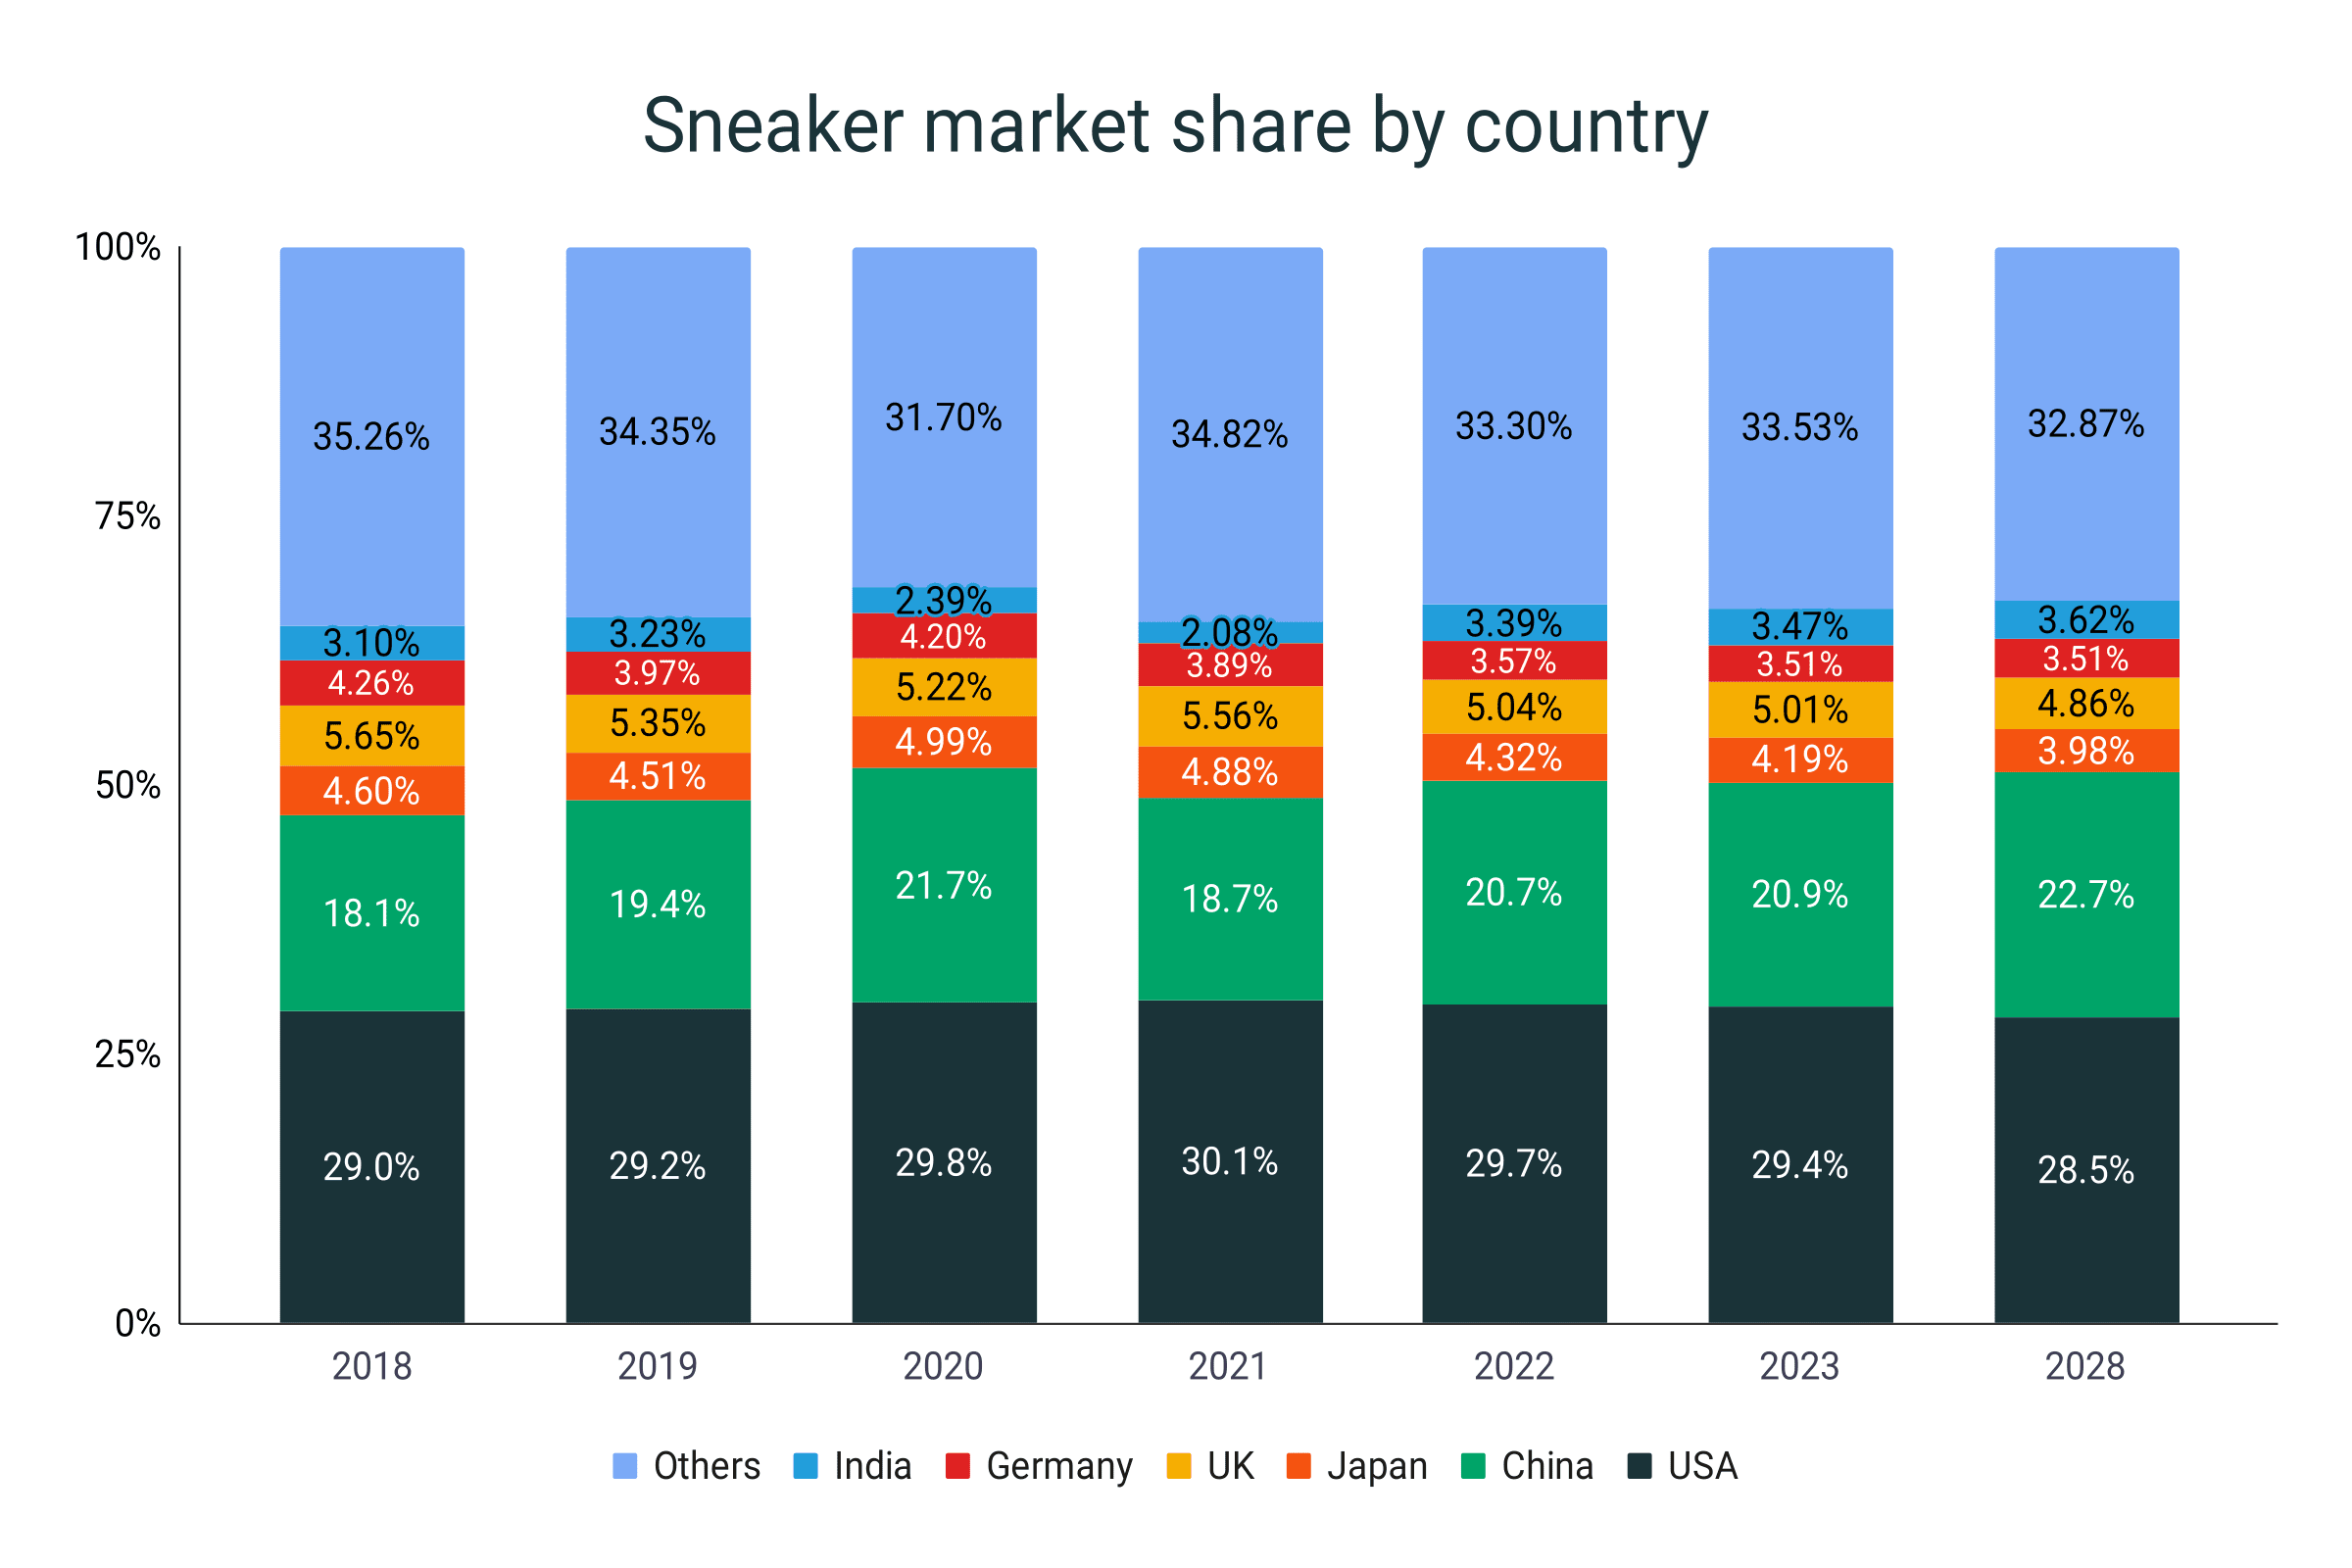
- With a 29.4% share, the United States will dominate the sneaker market in 2023.
- However, this is a 0.3% dip from the 29.7$ share in 2022.
- Continuing this trend, the market share of US sneakers will drop to 28.5% by 2028.
- In 2022, the US and China combined sneaker market accounted for 50.4% of the global revenue. By 2023, it will slightly dip to 50.3% combined share.
- At the peak of the COVID-19 pandemic in 2020, China enjoyed a 2.4% increase in its global sneaker market share.
- In the same year, Japan enjoyed a 0.5% rise while the US also managed to improve their own market potion by 0.6% each in 2020.
- Projection models show that by 2028, China will take a 22.7% sneaker market share.
- The United Kingdom, on the other hand, will enjoy a 5% market portion by the end of 2023. Japan will closely follow with a 4.2% share.
- By 2028, India will overtake Germany as the fifth biggest sneaker market with a 3.6% share compared to the latter’s 3.5%.
- Japan, the UK, and Germany will suffer a decrease in the overall sneaker market share from 2018 to 2023 with 0.4%, 0.7%, and 0.8% drops, respectively.
- India will enjoy a 0.5% gain from 2018 to 2028.
- In 2018, the rest of the countries of the world took up 35.3% of the entire sneaker market. By 2023, it will be 33.5%.
- According to projections, the combined sneaker market share of the rest of the world will continue to drop to 32.9% in 2028.
Sneaker market share by country
|
Year |
USA |
China |
Japan |
UK |
Germany |
India |
Others |
|
2018 |
29.0% |
18.1% |
4.6% |
5.7% |
4.3% |
3.1% |
35.3% |
|
2019 |
29.2% |
19.3% |
4.5% |
5.4% |
4.0% |
3.2% |
34.3% |
|
2020 |
29.8% |
21.7% |
5.0% |
5.2% |
4.2% |
2.4% |
31.7% |
|
2021 |
30.1% |
18.7% |
4.9% |
5.6% |
3.9% |
2.1% |
34.8% |
|
2022 |
29.7% |
20.7% |
4.3% |
5.0% |
3.6% |
3.4% |
33.3% |
|
2023 |
29.4% |
20.9% |
4.2% |
5.0% |
3.5% |
3.5% |
33.5% |
|
2028 |
28.5% |
22.7% |
4.0% |
4.9% |
3.5% |
3.6% |
32.9% |
Sneaker revenue per capita
- As of 2023, the average revenue per capita of the sneaker industry is $9.9.
- This represents a 3.2% growth compared to the $9.6 recorded in 2022.
- Over the past five years, the mean revenue per capita has risen by 10.5%.
- It is projected that the growth rate will catapult by 24.24% in 2028, reaching an average of $12.3 in revenue per capita.
- Notably, during the peak of the COVID-19 pandemic in 2020, the data experienced a significant drop of 10.7%.
Revenue per capita by year
|
Year |
Revenue per capita (in US dollars) |
Growth |
|
2018 |
$8.9 |
|
|
2019 |
$9.4 |
5.8% |
|
2020 |
$8.4 |
-10.7% |
|
2021 |
$8.7 |
3.2% |
|
2022 |
$9.6 |
9.8% |
|
2023 |
$9.9 |
3.2% |
|
2028 |
$12.3 |
24.2% |
Sneaker production statistics
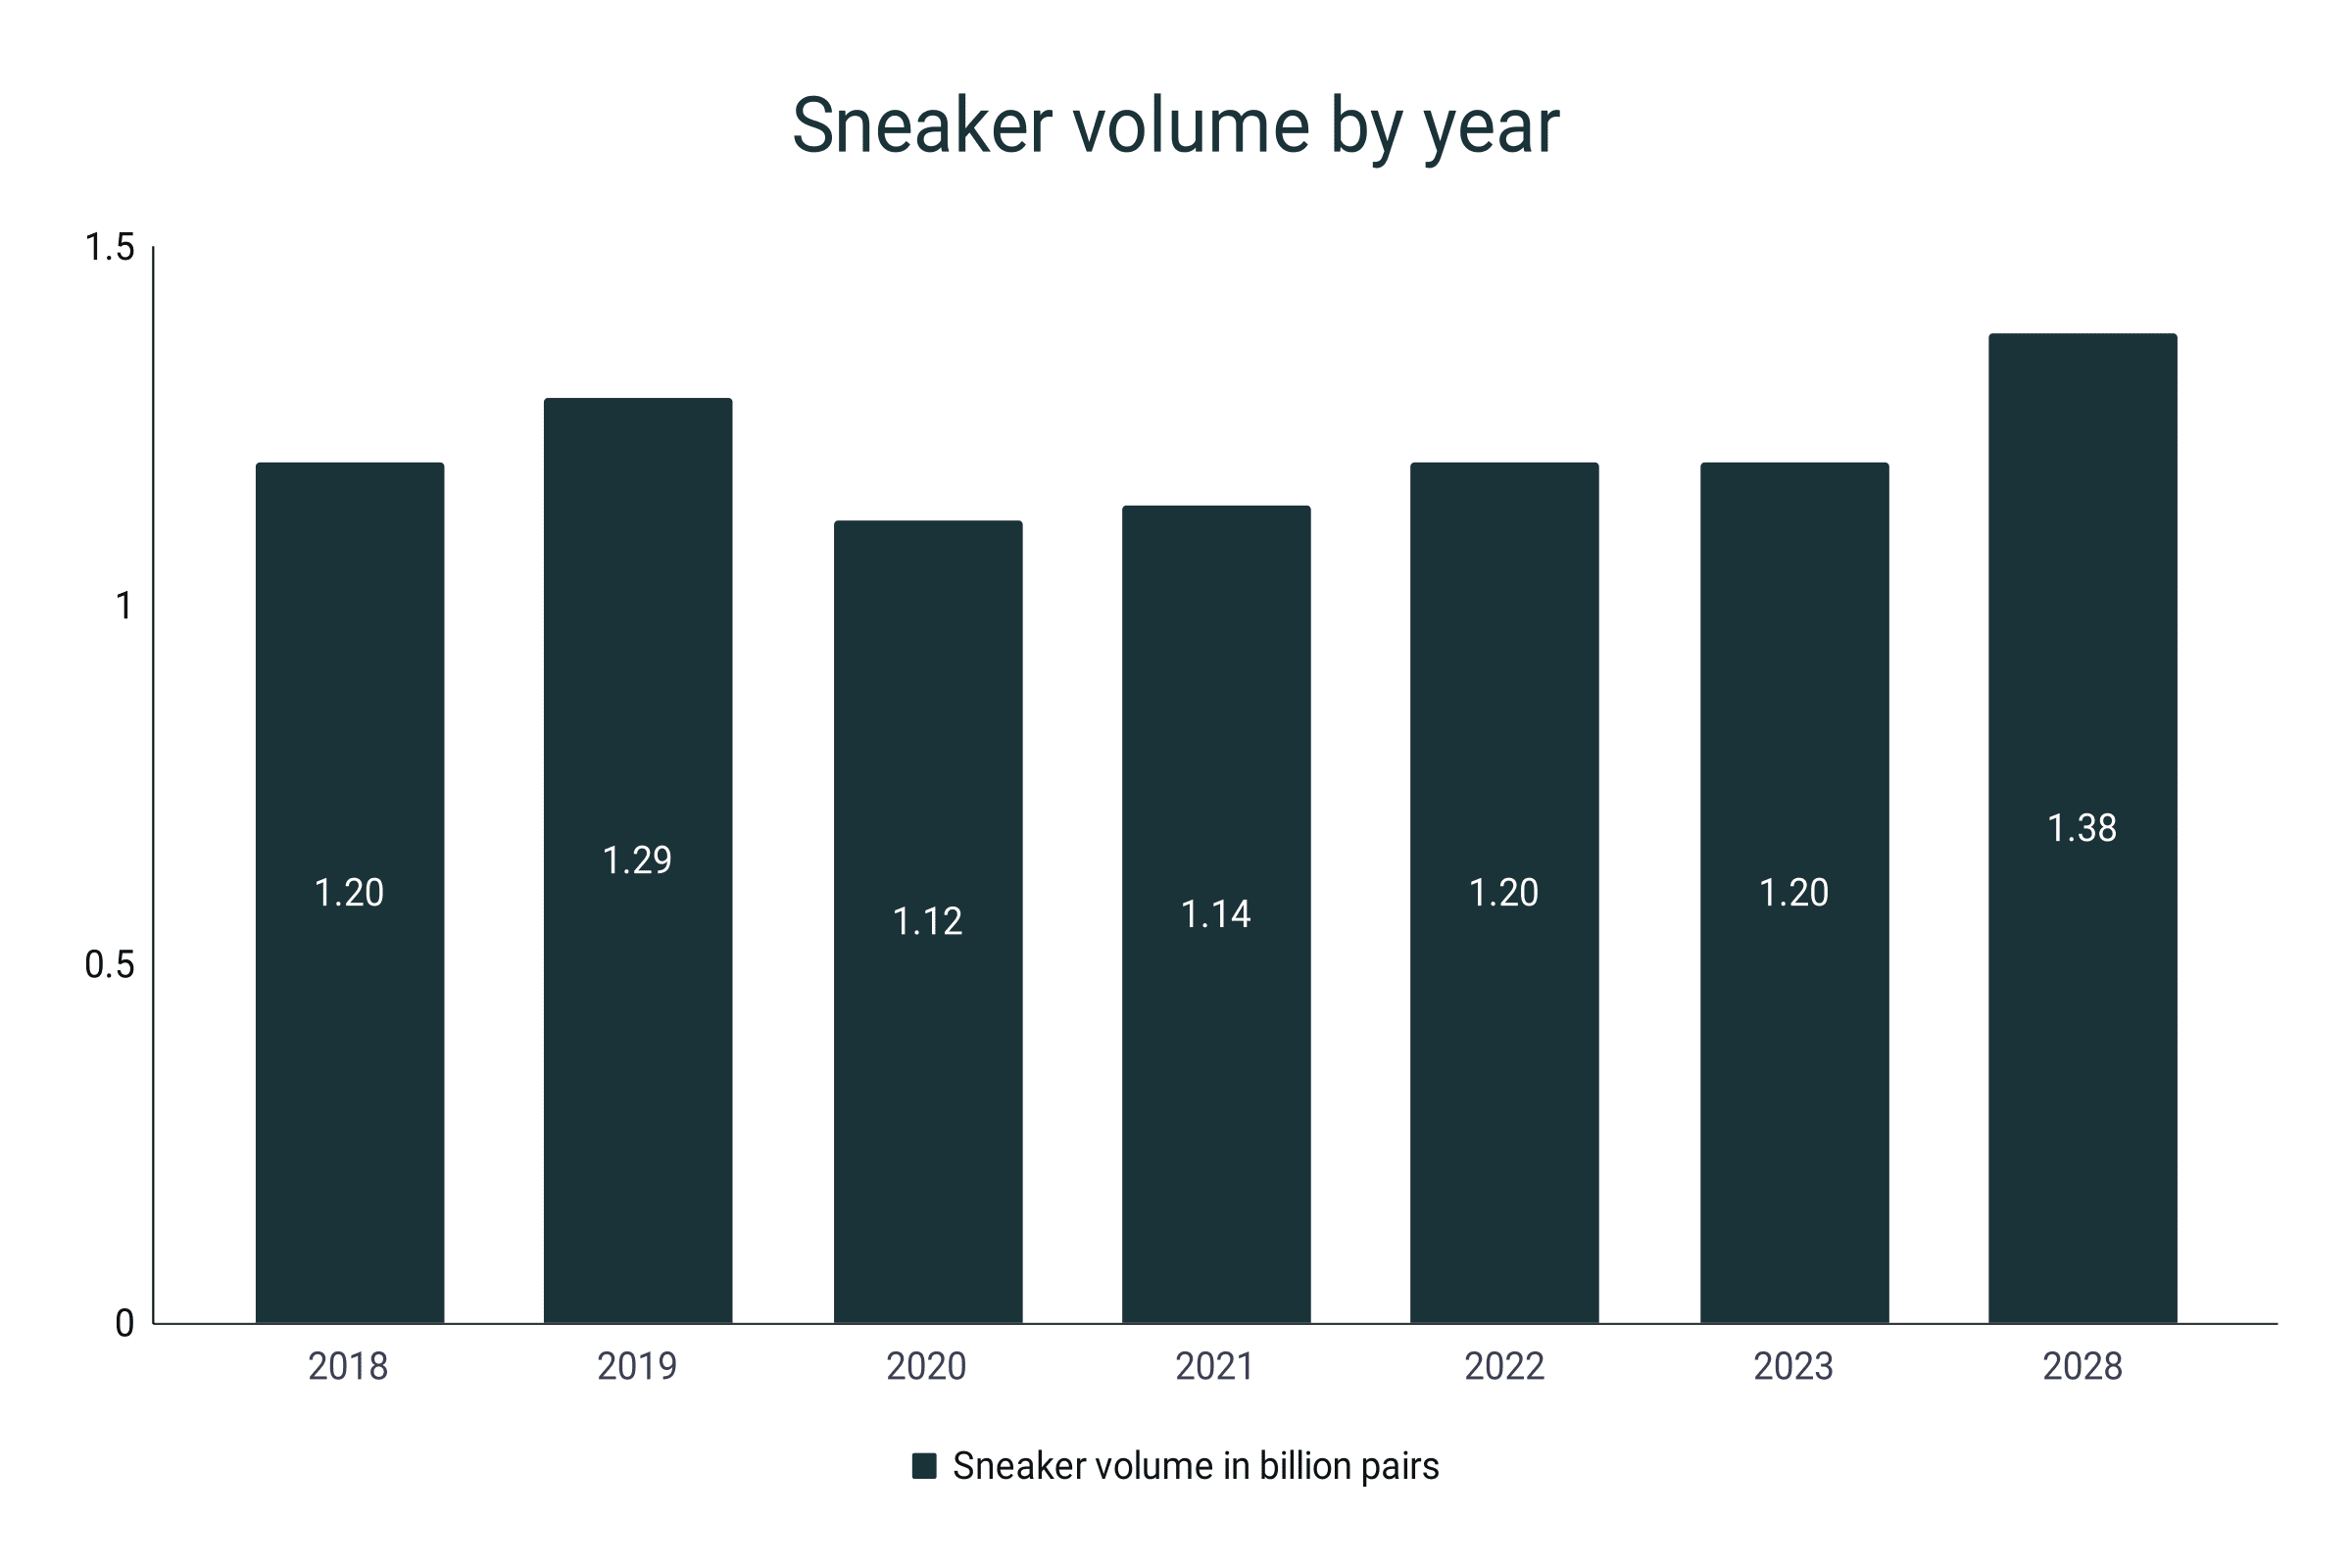
- About 1.2 billion pairs of sneakers will be produced in 2023, matching the numbers recorded in 2022 and 2018.
- This number is almost twice the amount of sneakers globally manufactured in 2012.
- The sneaker volume per capita by the end of 2023 will be 0.16 pairs.
- At the height of the pandemic in 2020, the bulk of sneakers manufactured worldwide dropped to 1.12 billion pairs.
- This is a 13.2% dip compared to the 1.29 billion worldwide total in 2019, the highest in the last six years.
- As the world exits the pandemic in 2022, the figures rose by 5.26%.
- Furthermore, mathematical models predict that by 2026, the global production volume will amount to 1.31 billion pairs.
- The numbers will continue to rise, reaching 1.38 billion in 2028, translating to a 0.17 average sneaker pair per person.
Sneaker volume by year
|
Year |
Volume (in billion pairs) |
Volume per capita (in pairs) |
|
2018 |
1.20 |
0.16 |
|
2019 |
1.29 |
0.17 |
|
2020 |
1.12 |
0.15 |
|
2021 |
1.14 |
0.15 |
|
2022 |
1.20 |
0.16 |
|
2023 |
1.20 |
0.16 |
|
2028 |
1.38 |
0.17 |
Sneaker consumption by category
- In 2022, the women’s sneaker market accounted for $27 billion in revenues. It has more than doubled its value in 2016.
- Women’s sneaker segment in 2021 raked up $24.21 billion, a 36.9% share of the market.
- Women’s sneaker revenues have increased by 11.5% from 2021 to 2022.
- The women end-user share has grown from 20% in 2014 to 37.1% in 2022. A 17.1% difference over the span of nine years.
- It is expected to grow to $51.7 billion in 2032 with a CAGR of 6.7%.
- With $5.45 billion in sales, the kids’ sneaker segment accounted for an 8.3% share.
- Meanwhile, the men’s sneaker segment in 2021 amounted to $36 billion in revenue.
- This is equal to a 54.8% share of the entire sneaker sales in the same year.
Sneaker revenue by category in 2021
|
Channel |
Revenue (in billions of US$) |
Share in % |
|
Men |
35.95 |
54.8 |
|
Women |
24.21 |
36.9 |
|
Kids |
5.45 |
8.3 |
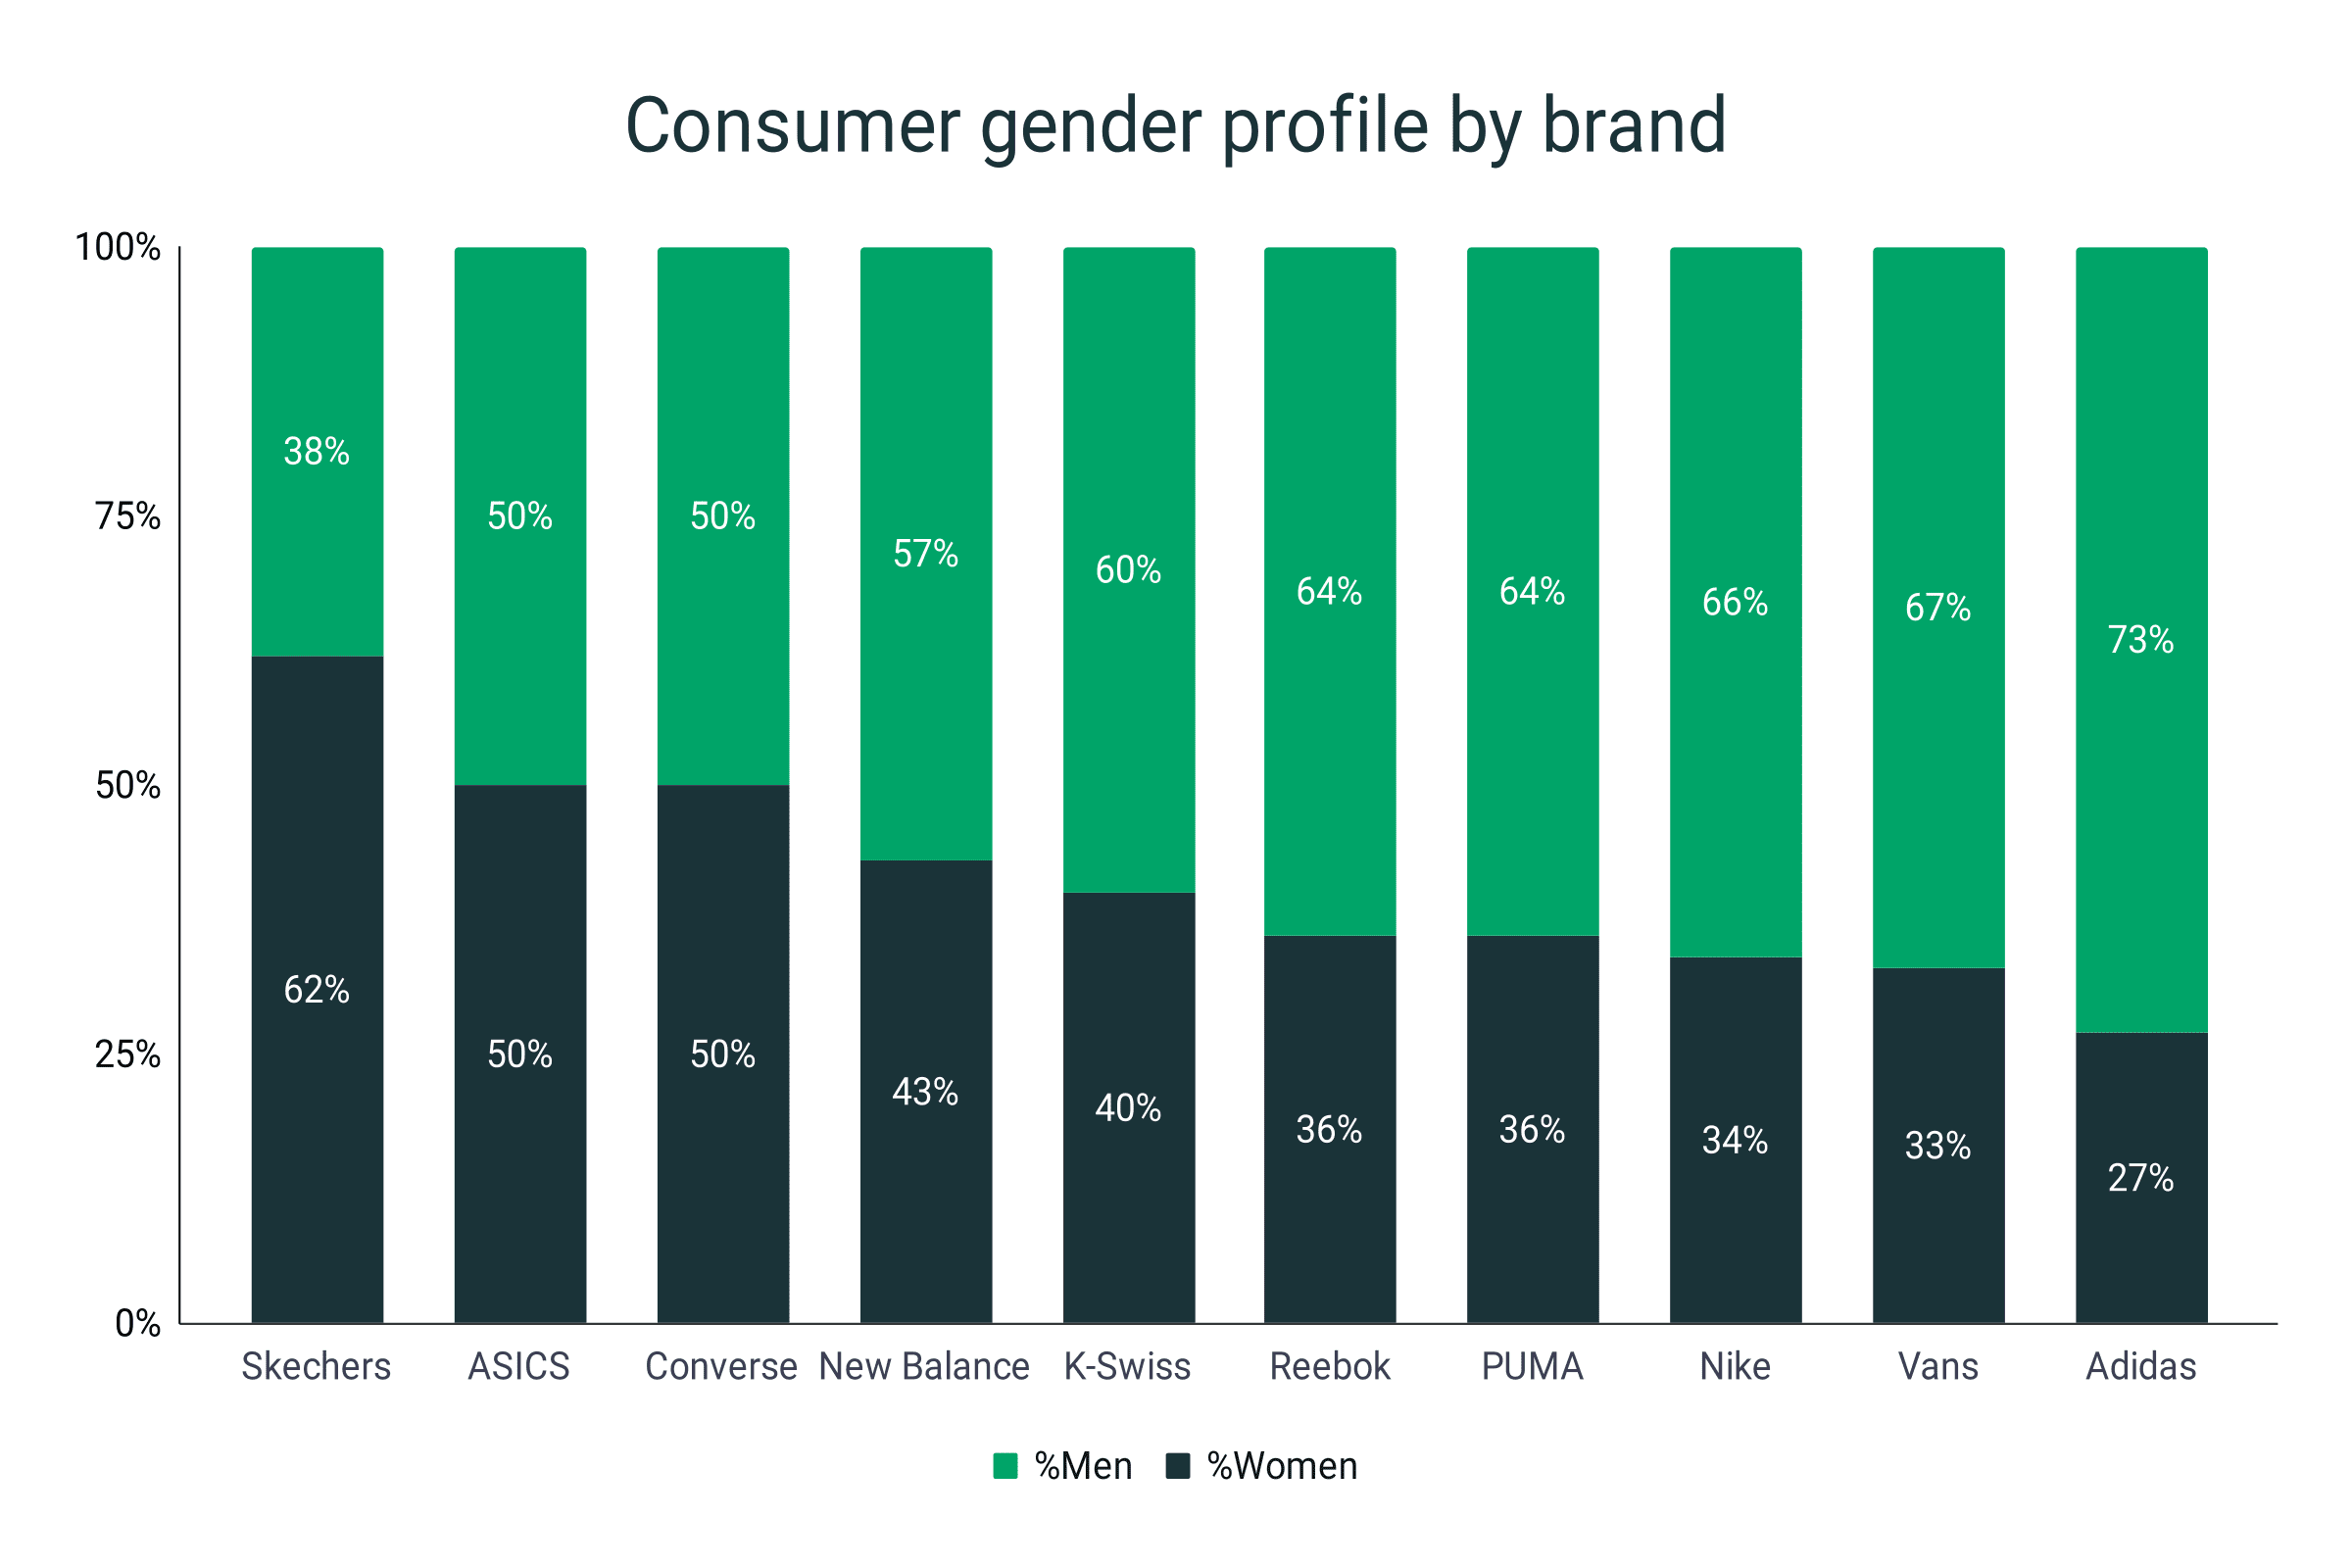
- Skechers is the only women-dominated sneaker brand in 2021. According to data, 62% of its shoppers are women.
- ASICS and Converse reported an equal number of men and women sneaker consumers in the same year.
- Additionally, Reebok and PUMA reported that 36% of their consumers are women while 65% are male.
- Adidas showed the biggest disparity between men and women buyers in 2021. Seventy-three percent of the consumers are men, outnumbering the women by 46%.
Men's and women's sneaker consumption by brand in 2021
|
Brand |
%Women |
%Men |
|
Skechers |
62 |
38 |
|
ASICS |
50 |
50 |
|
Converse |
50 |
50 |
|
New Balance |
43 |
57 |
|
K-Swiss |
40 |
60 |
|
Reebok |
36 |
64 |
|
PUMA |
36 |
64 |
|
Nike |
34 |
66 |
|
Vans |
33 |
67 |
|
adidas |
27 |
73 |
Sneaker revenue by sales channel
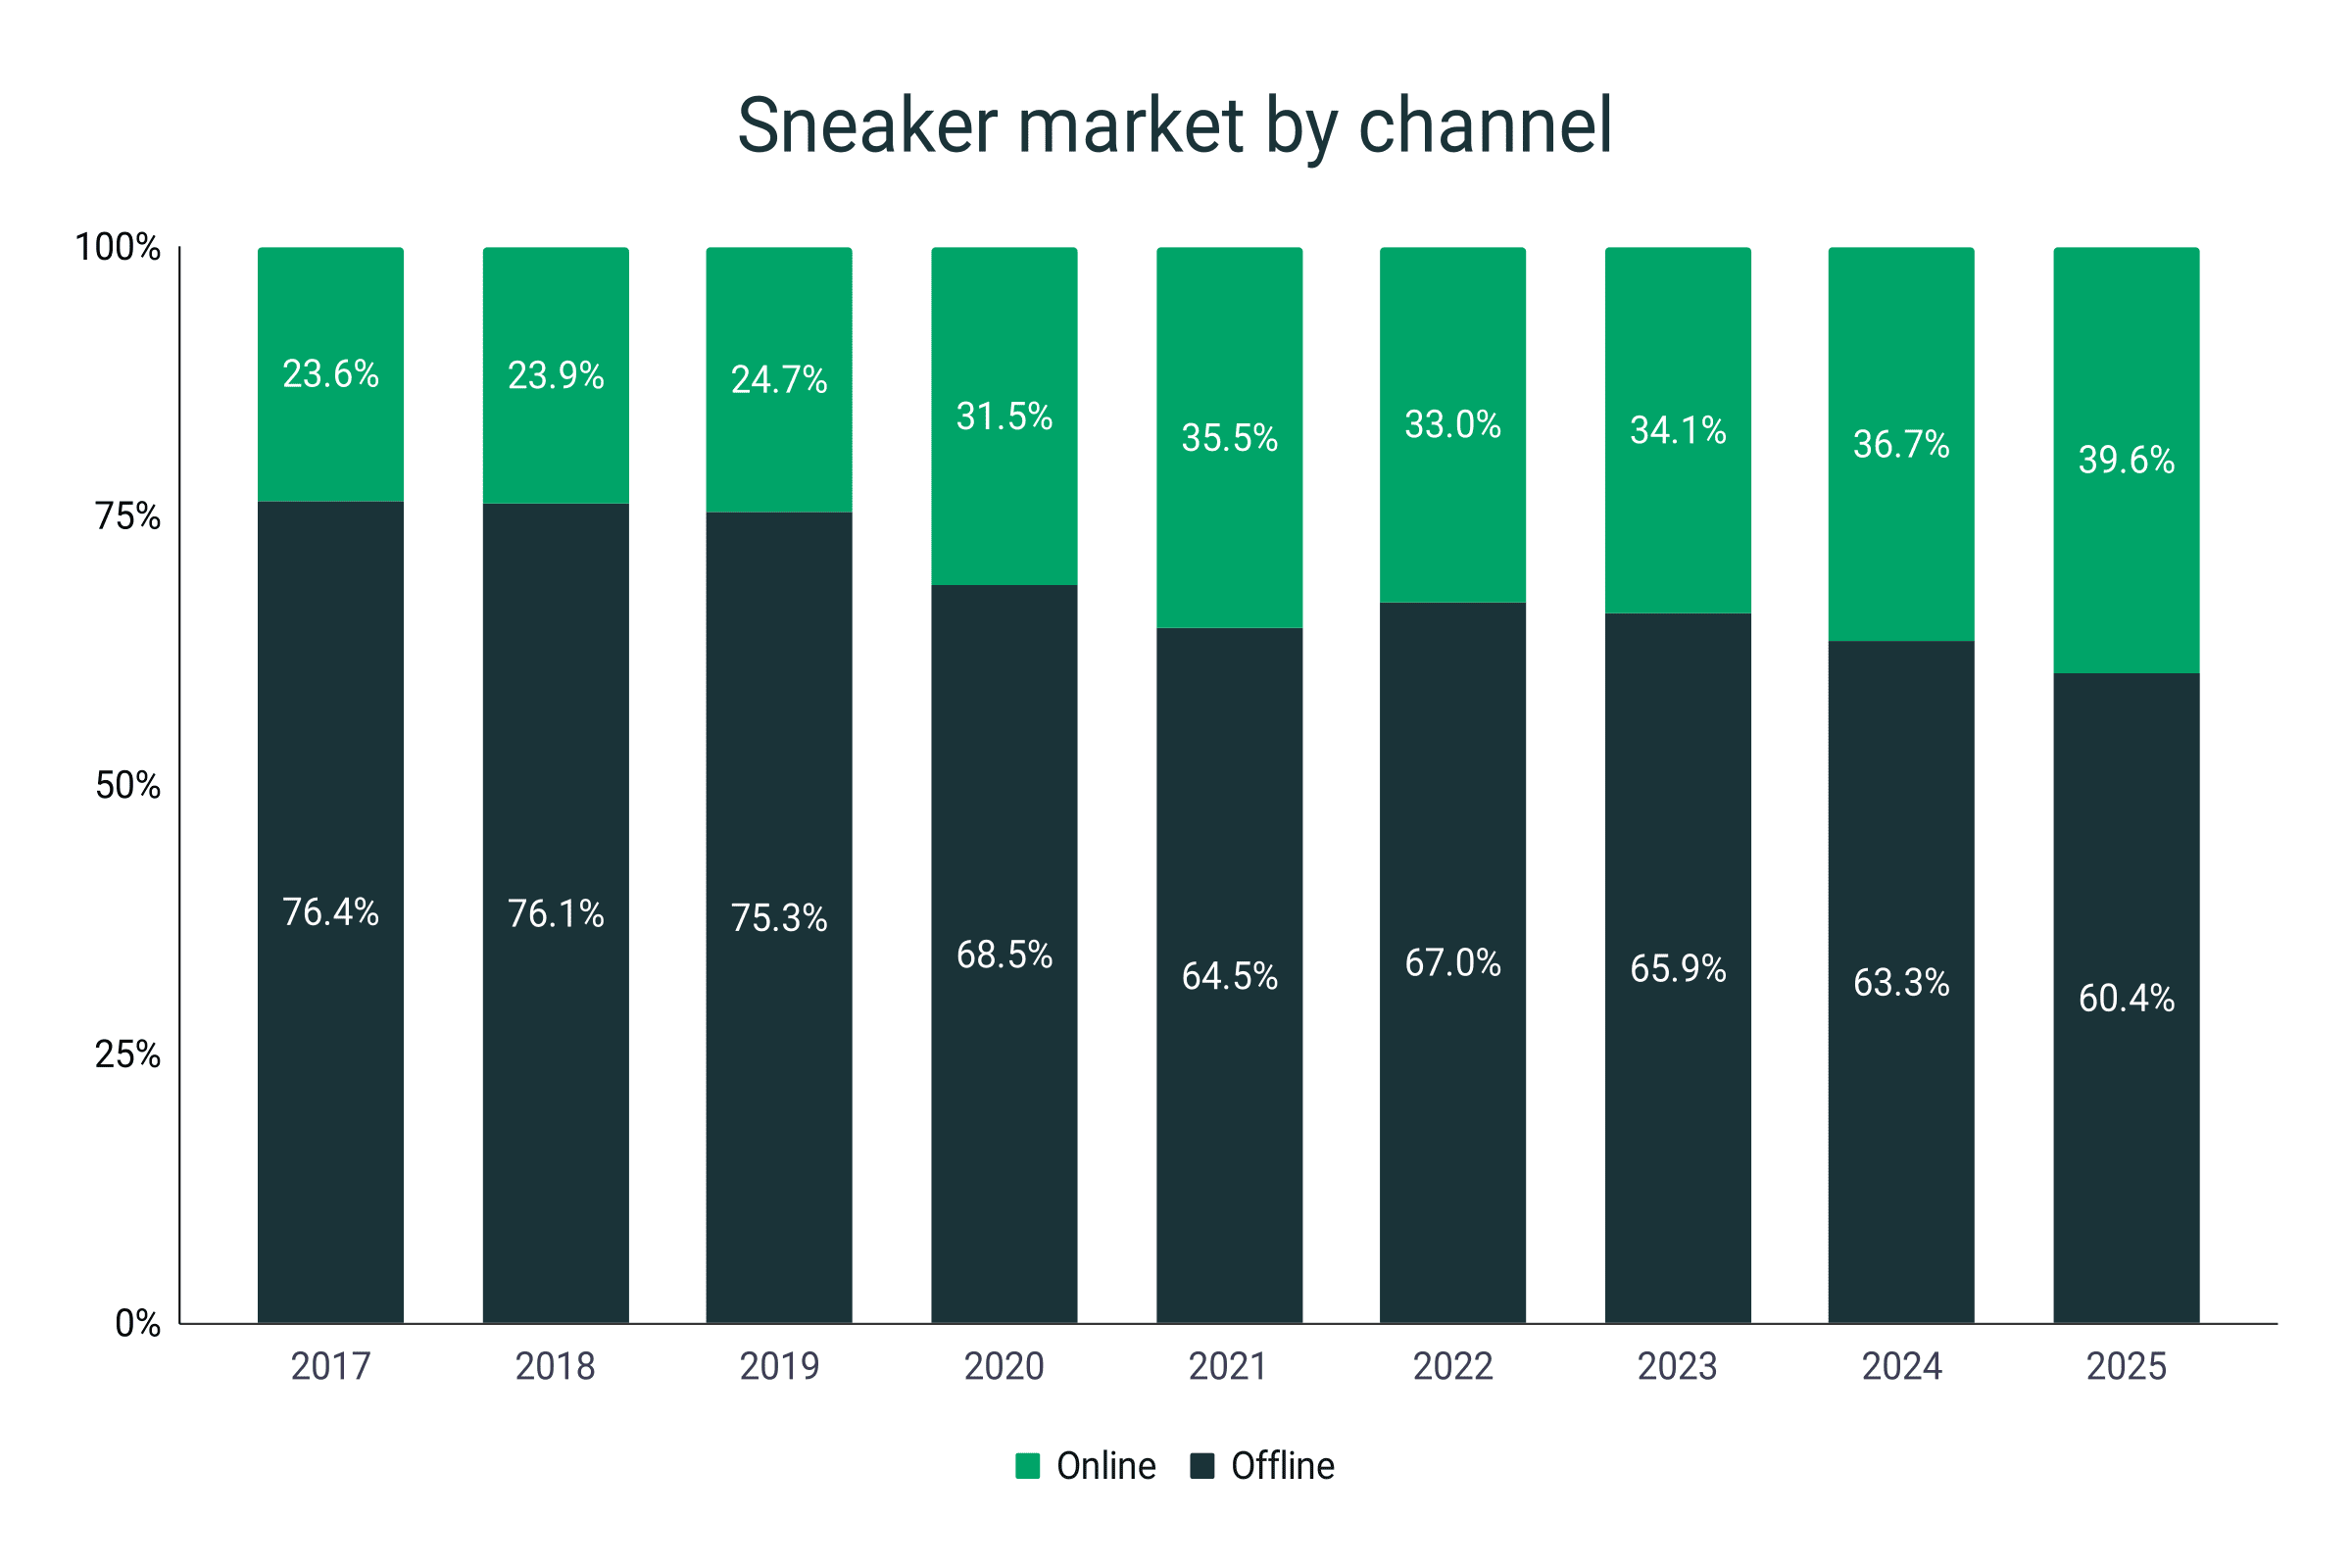
- In the sneaker segment, offline transaction revenue by the end of 2023 will tally 65.9% of the total sales. This is equivalent to about $50 billion.
- Meanwhile, the online market share will reach 34.1% or roughly $25.8 billion.
- There has been a 1.1% drop from the 67% offline market share tallied in 2022.
- In contrast to the 76.4% share in 2017, the total decline in offline market revenue has amounted to 10.5% as of 2023.
- In 2021, the lowest offline-to-online share difference was recorded at 29%. This means that the offline market exceeded the e-commerce share by more than $19 billion.
- Consequently, the highest e-commerce market share rose to a record-breaking 35.5% in the same year.
- According to estimates, the online sneaker market will continue to grow by as much as 39.6% by 2025, leaving a 60.4-percent portion to the offline market.
- In the U.S. today, 25% of current sneaker purchases are from online retailers.
Offline and online market share
|
Year |
Offline (in %) |
Online (in %) |
Difference (in %) |
|
2017 |
76.4 |
23.6 |
52.8 |
|
2018 |
76.1 |
23.9 |
52.2 |
|
2019 |
75.3 |
24.7 |
50.6 |
|
2020 |
68.5 |
31.5 |
37.0 |
|
2021 |
64.5 |
35.5 |
29.0 |
|
2022 |
67 |
33 |
34.0 |
|
2023 |
65.9 |
34.1 |
31.8 |
|
2024 |
63.3 |
36.7 |
26.6 |
|
2025 |
60.4 |
39.6 |
20.8 |
White sneakers statistics
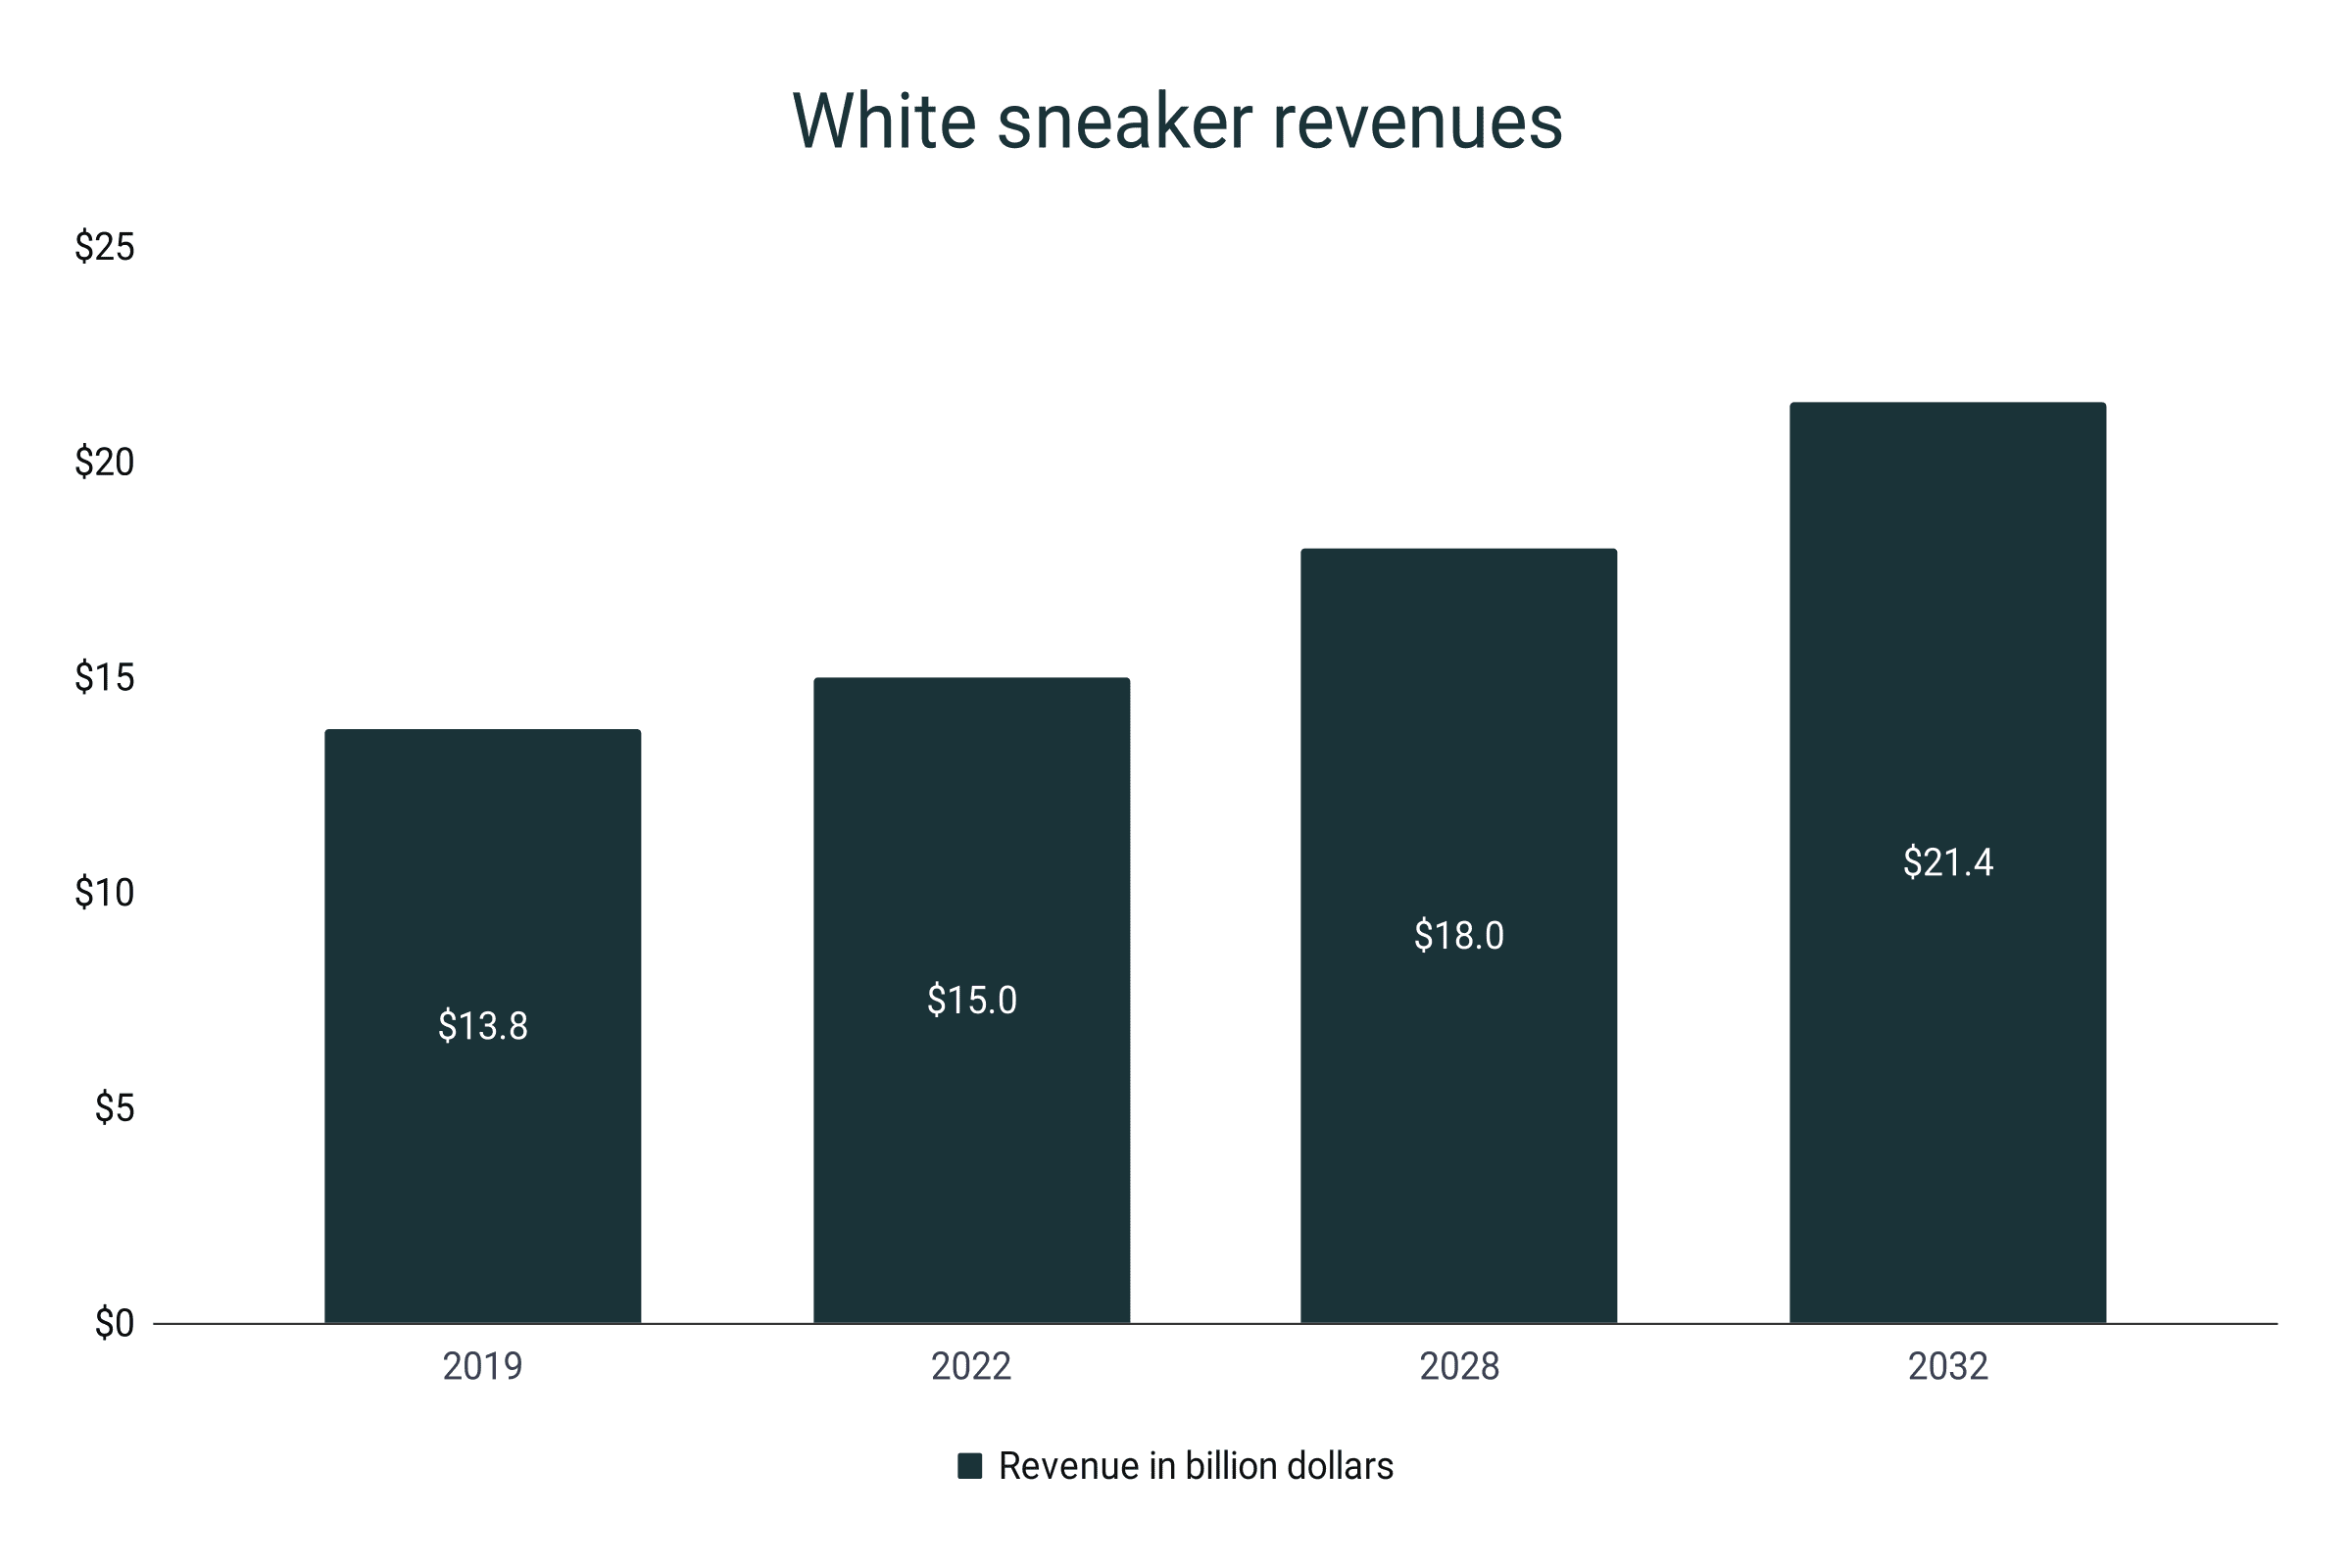
- The total revenue from white sneakers in 2022 generated $15 billion.
- From its $13.8 billion figure in 2019, the white sneaker market has experienced an 8.7% growth.
- It is projected that in 2028, the white sneaker market will be valued at $18 billion, a 20% increase from its valuation in 2022.
- From 2022 to 2028, the CAGR of the white sneaker industry is 3%.
- Further projection estimates that by 2032 the white sneaker market will breach the 20-billion dollar mark, tallying $21.4 billion in sales.
- This will signify a 42.7% growth from its value in 2022.
- North America holds the biggest chunk of the white sneaker market in 2022 at 28.9%.
- With a market portion of 28.9%, specialty stores are the biggest white sneaker channel.
- Male end-user segment is expected to register a 55.2% share in white sneaker sales by the end of 2032.
White sneaker revenue
|
Year |
Revenue |
Growth |
|
2019 |
$13.8 billion |
|
|
2022 |
$15 billion |
8.7% |
|
2028 |
$18 billion |
20% |
|
2032 |
$21.4 billion |
18.9% |
Sneaker resale market statistics
- As of 2022, the sneaker resale market has skyrocketed into a $10.6 billion global industry, taking 14.6% of the total revenue.
- The resale market has a remarkable 500% increase compared to the $1 billion revenue recorded in 2014.
- Nike dominated the resell market with a 27% share.
- The resale market is expected to reach $27.4 billion in 2032, equivalent to a 16.4% compound annual growth.
- The United States will cap 2023 with a $2 billion revenue from reselling.
- In 2019, the Nike MAG (Plutonium Case) registered a 5,430% increase from an original price of $179 to a jaw-dropping $9,900 reselling price.
Counterfeit sneaker market statistics
- Approximately, counterfeit products account for 2.5% of the total international trade.
- The global counterfeit sneaker market is estimated to be $600 billion in 2023.
- This signifies an 11.11% increase compared to the estimated $450 billion figure in 2020.
- Towards the end of 2023, the counterfeit sneaker market will be 8 times the legitimate sneaker industry.
- At this rate, the counterfeit sneaker market will breach the $1 trillion mark in about 25 years.
- According to the US Customs and Border Protection (CBP), about 14% of all counterfeit products they seized were counterfeit footwear.
- One in four online shoppers have bought and/or received a fake item in 2019 according to a study by Better Business Bureau.
- A survey in 2021 reported that 46% of the study participants admitted to buying fake sneakers.
- Another survey of American consumers reveals that 31% of those who received a counterfeit sneaker are dissatisfied. Surprisingly, 69% of the respondents are okay with receiving a fake item.