Size Don’t Matter – D.C. Outruns Its Neighbours for the Last 8 Years
For this study, we have analyzed 2,373,724 results from 28,732 running races. We compared Washington D.C. to its neighbor states Virginia and Maryland, and added also Pennsylvania and West Virginia, because of their proximity. And D.C. has the best runners in all most popular running distances - 5 Kilometer, 10 Kilometer, Half Marathon, and Marathon.
Feel free to use any material from this page, as long as you refer to this original source.

Results from our comparison
Our research shows that Washington D.C. runners are superior to the ones from its neighboring states. And this is true for the last 8 years in all four distances.
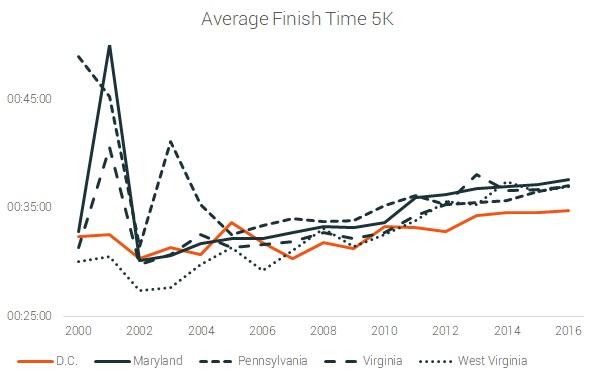
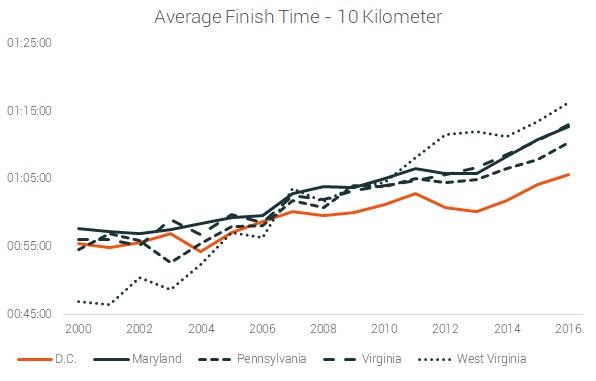
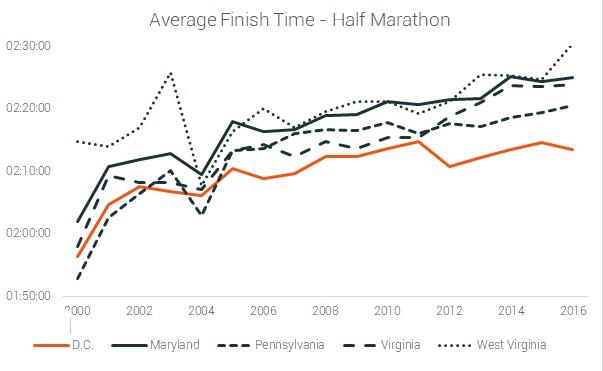
All the conclusions made in this article are valid for all four distances, but onwards we will focus on marathon running.
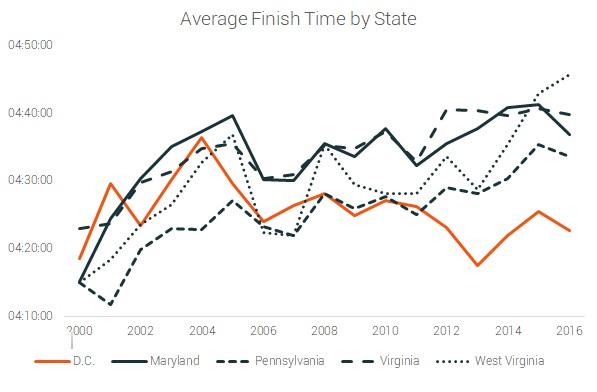
This becomes more clear if we look at the trends in the finish times of those four states.
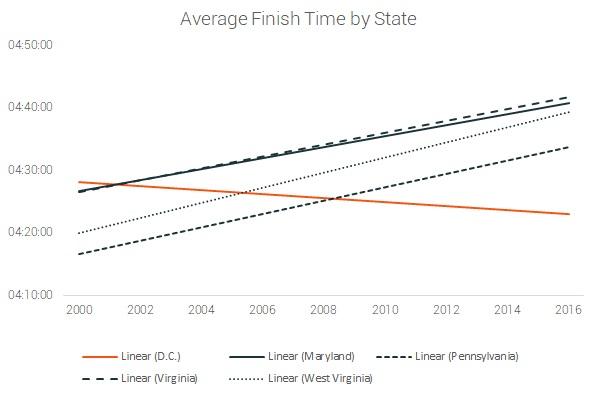
As we see D.C. is the only one of the five that is getting faster. Also, District Columbia does not comply with the general trend of slowing down. The marathoners from D.C. have become 2.6% faster in the last 17 years, where the runners from the other states have slowed down. Maryland by 4.7%, Virginia - 6.1%, Pennsylvania - 8.7% and West Virginia with 10.6%.
For more information on American runners slowing down see our previous study.
Also, in 2016 D.C. marathon runners are 1.92% faster than the national average.
By Number of Participants
Let's look at the state's population. Washington D.C. has the smallest population of the four states - around 700 thousand people. Maryland has a population of about 6 million, Virginia - just above 8 million, Pensylvania has just under 13 million and West Virginia about 2 million.
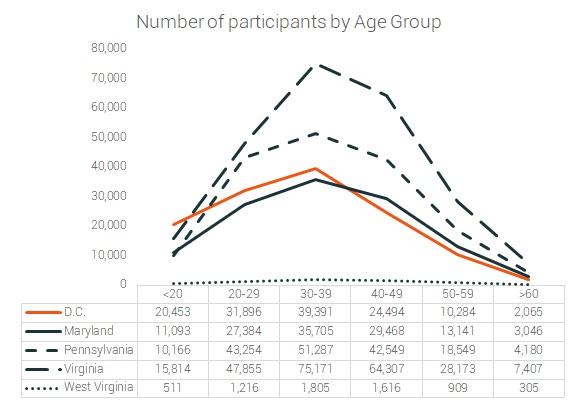
With just a fraction of the population of the four comparing states, D.C. ranks third in the absolute number of participants and first in the number of young participants - under 20.
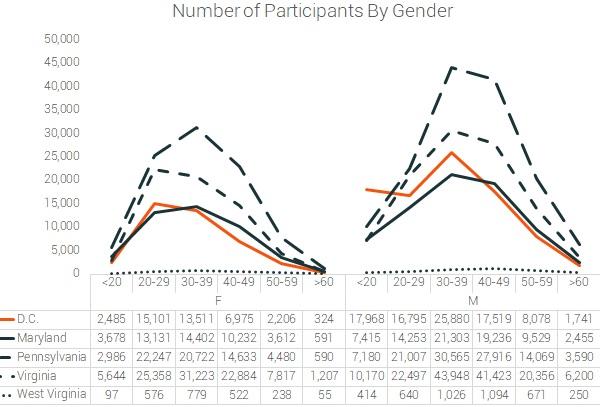
These proportions remain almost unchanged if we divide the runners by gender. But what we see here is that the young participant from D.C. are mostly men and they are a lot more numerous than in any of the other states we look into.
We looked at the absolute measures by now, but still, the populations of the four states are vastly different. Let's level the playing field and look at the number of participants as percentage of the state's population
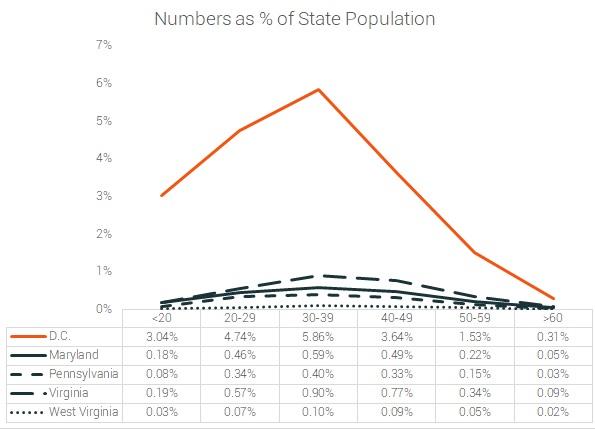
From here we can see that D.C. has more than 5 times the marathon runners per capita for every age group compared to the other states.
By Gender
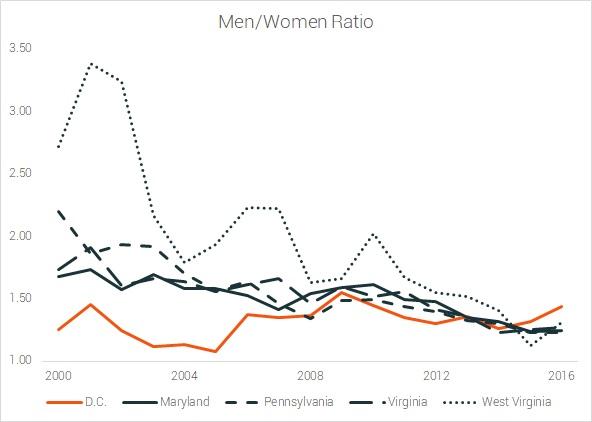
Тhe next chart shows the proportion of men to women. For example in the year 2000 for every female marathon runner from D.C, there were 1.25 male participants.
D.C. consistently has a big proportion of female participants, though in the later years there proportions become closer and closer.
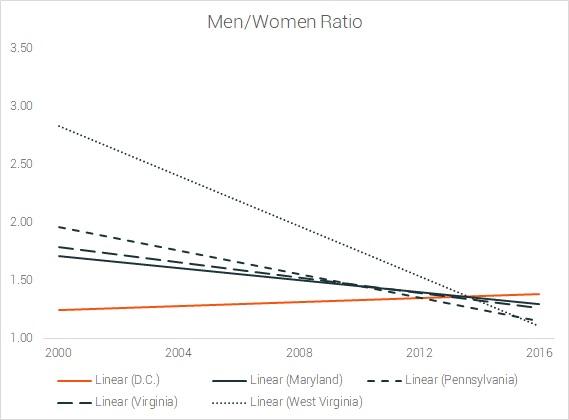
The trends in the men to women ratios show that in D.C. there is a slight decline in women percentage. For the other four states, there is a steep increase in the numbers of female participants. This might account for some of the finish time trends we have seen in the beginning of the article. But still with a consistently high percentage of female participants D.C. is the fastest of the four states.
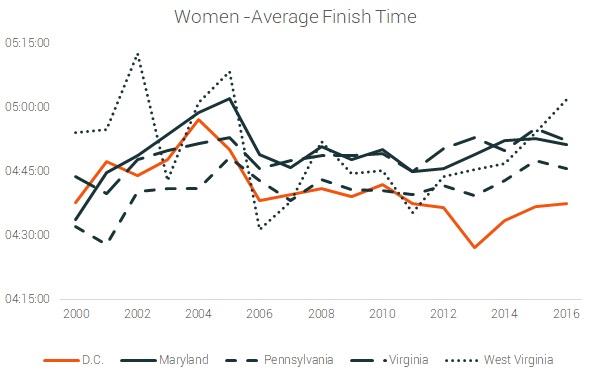
Now let's see how men's and women's average times have changed in the last 17 years.
For a clearer view let's look at the trends. D.C. women improved their finish time by 3.5%. West Virginia's women also have an improvement of 3%, but their rate of improvement is smaller and also their finish is still 8.7% slower in 2016.
Maryland women have a 2.3% slow down in the 2000-2016 period and are 5% slower in 2016. Virginia women lost 4.4% of their speed in the same period and are 5.3% slower than D.C. women in 2016. Pennsylvania women lost 6.7% of their speed in the last 17 years and are 3% slower than the D.C. women in 2016.
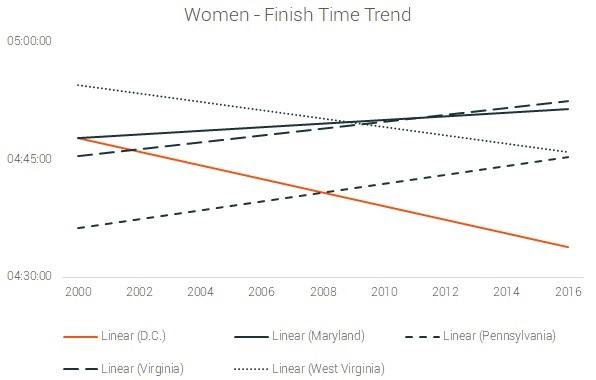
So, D.C. women have the best rate of improvement and the best time in 2016.
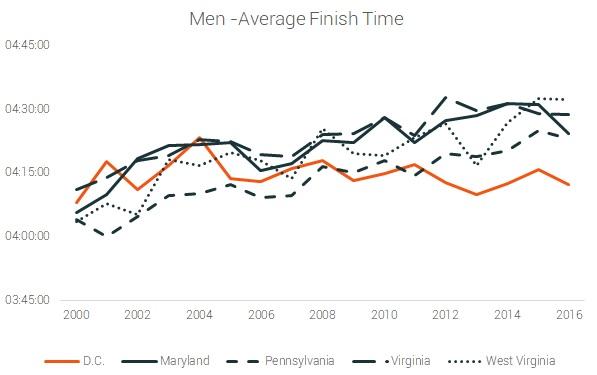
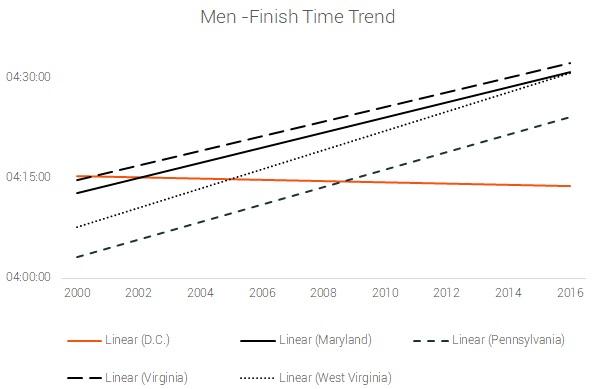
From here we can see that D.C. men are the only ones who have an improvement in their finish time - 2.1%. All four other states have a decline in performance. Maryland - 5.7%, Virginia - 5.6%, Pennsylvania men - 9.6%, and West Virginia men lost 9.8% of their speed.
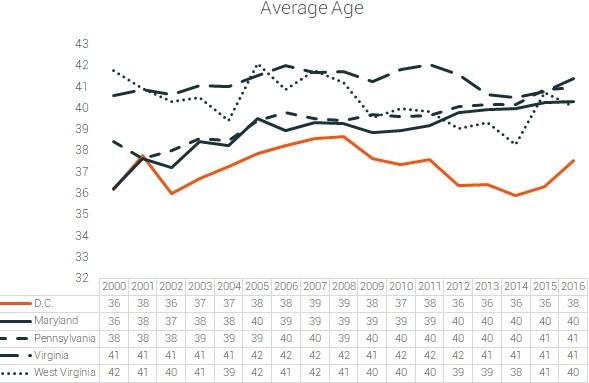
Also, the average age of the D.C. participant is quite younger than the average participant from the other four states in question. This might seem like a likely explanation to why D.C. runners are faster, but this is not the case - the difference between the finish time of 37-year-olds and 41-year-olds is 0.06%, which is negligible.
Conclusion
Washington D.C. has the best runners in the area. This is true for the four most popular distances - Marathon, Half Marathon, 10 Kilometer and 5 Kilometer. D.C. is the only state of the four with overall improving finish time in the last 17 years.
About The Researchers
The study was led by Jens Jakob Andersen and assisted by Vania Andreeva Nikolova. Andersen is a former competitive runner and statistician from Copenhagen Business School. Nikolova holds a Ph.D. in Mathematical Analysis.
Use of content
- We are happy to give interviews on the topic at any time. Reach out to Jens at jens@runrepeat.com.
- For web usage, any minor text sections, all data, and all graphics may be used as long as a reference is added to this original piece.
- For print usage, reach out to jens@runrepeat.com.

