Red cards down 21.4% in last decade [Analysis of 19,985 games]
To understand the impact that red cards have on football matches we have collected data from 19,985 games in Europe’s top 5 leagues over the last 11 years.
The data below includes games from the German Bundesliga, French Ligue 1, Spanish La Liga, Italian Serie A, and English Premier League between seasons 2009/10 and 2019/20.
This is the first of a series of articles analyzing 11 years’ worth of red card data and focuses on the frequency of red cards.
Key Findings:
- Red cards have decreased by 21.41% since 2009/10
- The largest single-season decrease (16.34%) coincided with the introduction of the “double jeopardy” rule in 2016/17
- After VAR, red cards have gone up in EPL & La Liga and down in Bundesliga & Ligue 1
- 1 in 5 games contain at least 1 red card
- The English Premier League and German Bundesliga consistently have the fewest red cards
1 in 5 games contain at least 1 red card
Over the course of the 19,985 games across the top 5 leagues, players received 4,574 red cards.
This works out as a red card every 393.13 minutes or, essentially, a red card every 4.5 games.
Number of games by number of red cards given
| Number of red cards | Count of games | % of total games |
| 0 | 16,081 | 80.47% |
| 1 | 3,310 | 16.56% |
| 2 | 527 | 2.64% |
| 3 | 60 | 0.30% |
| 4+ | 7 | 0.04% |
| Total | 19,985 | 100% |
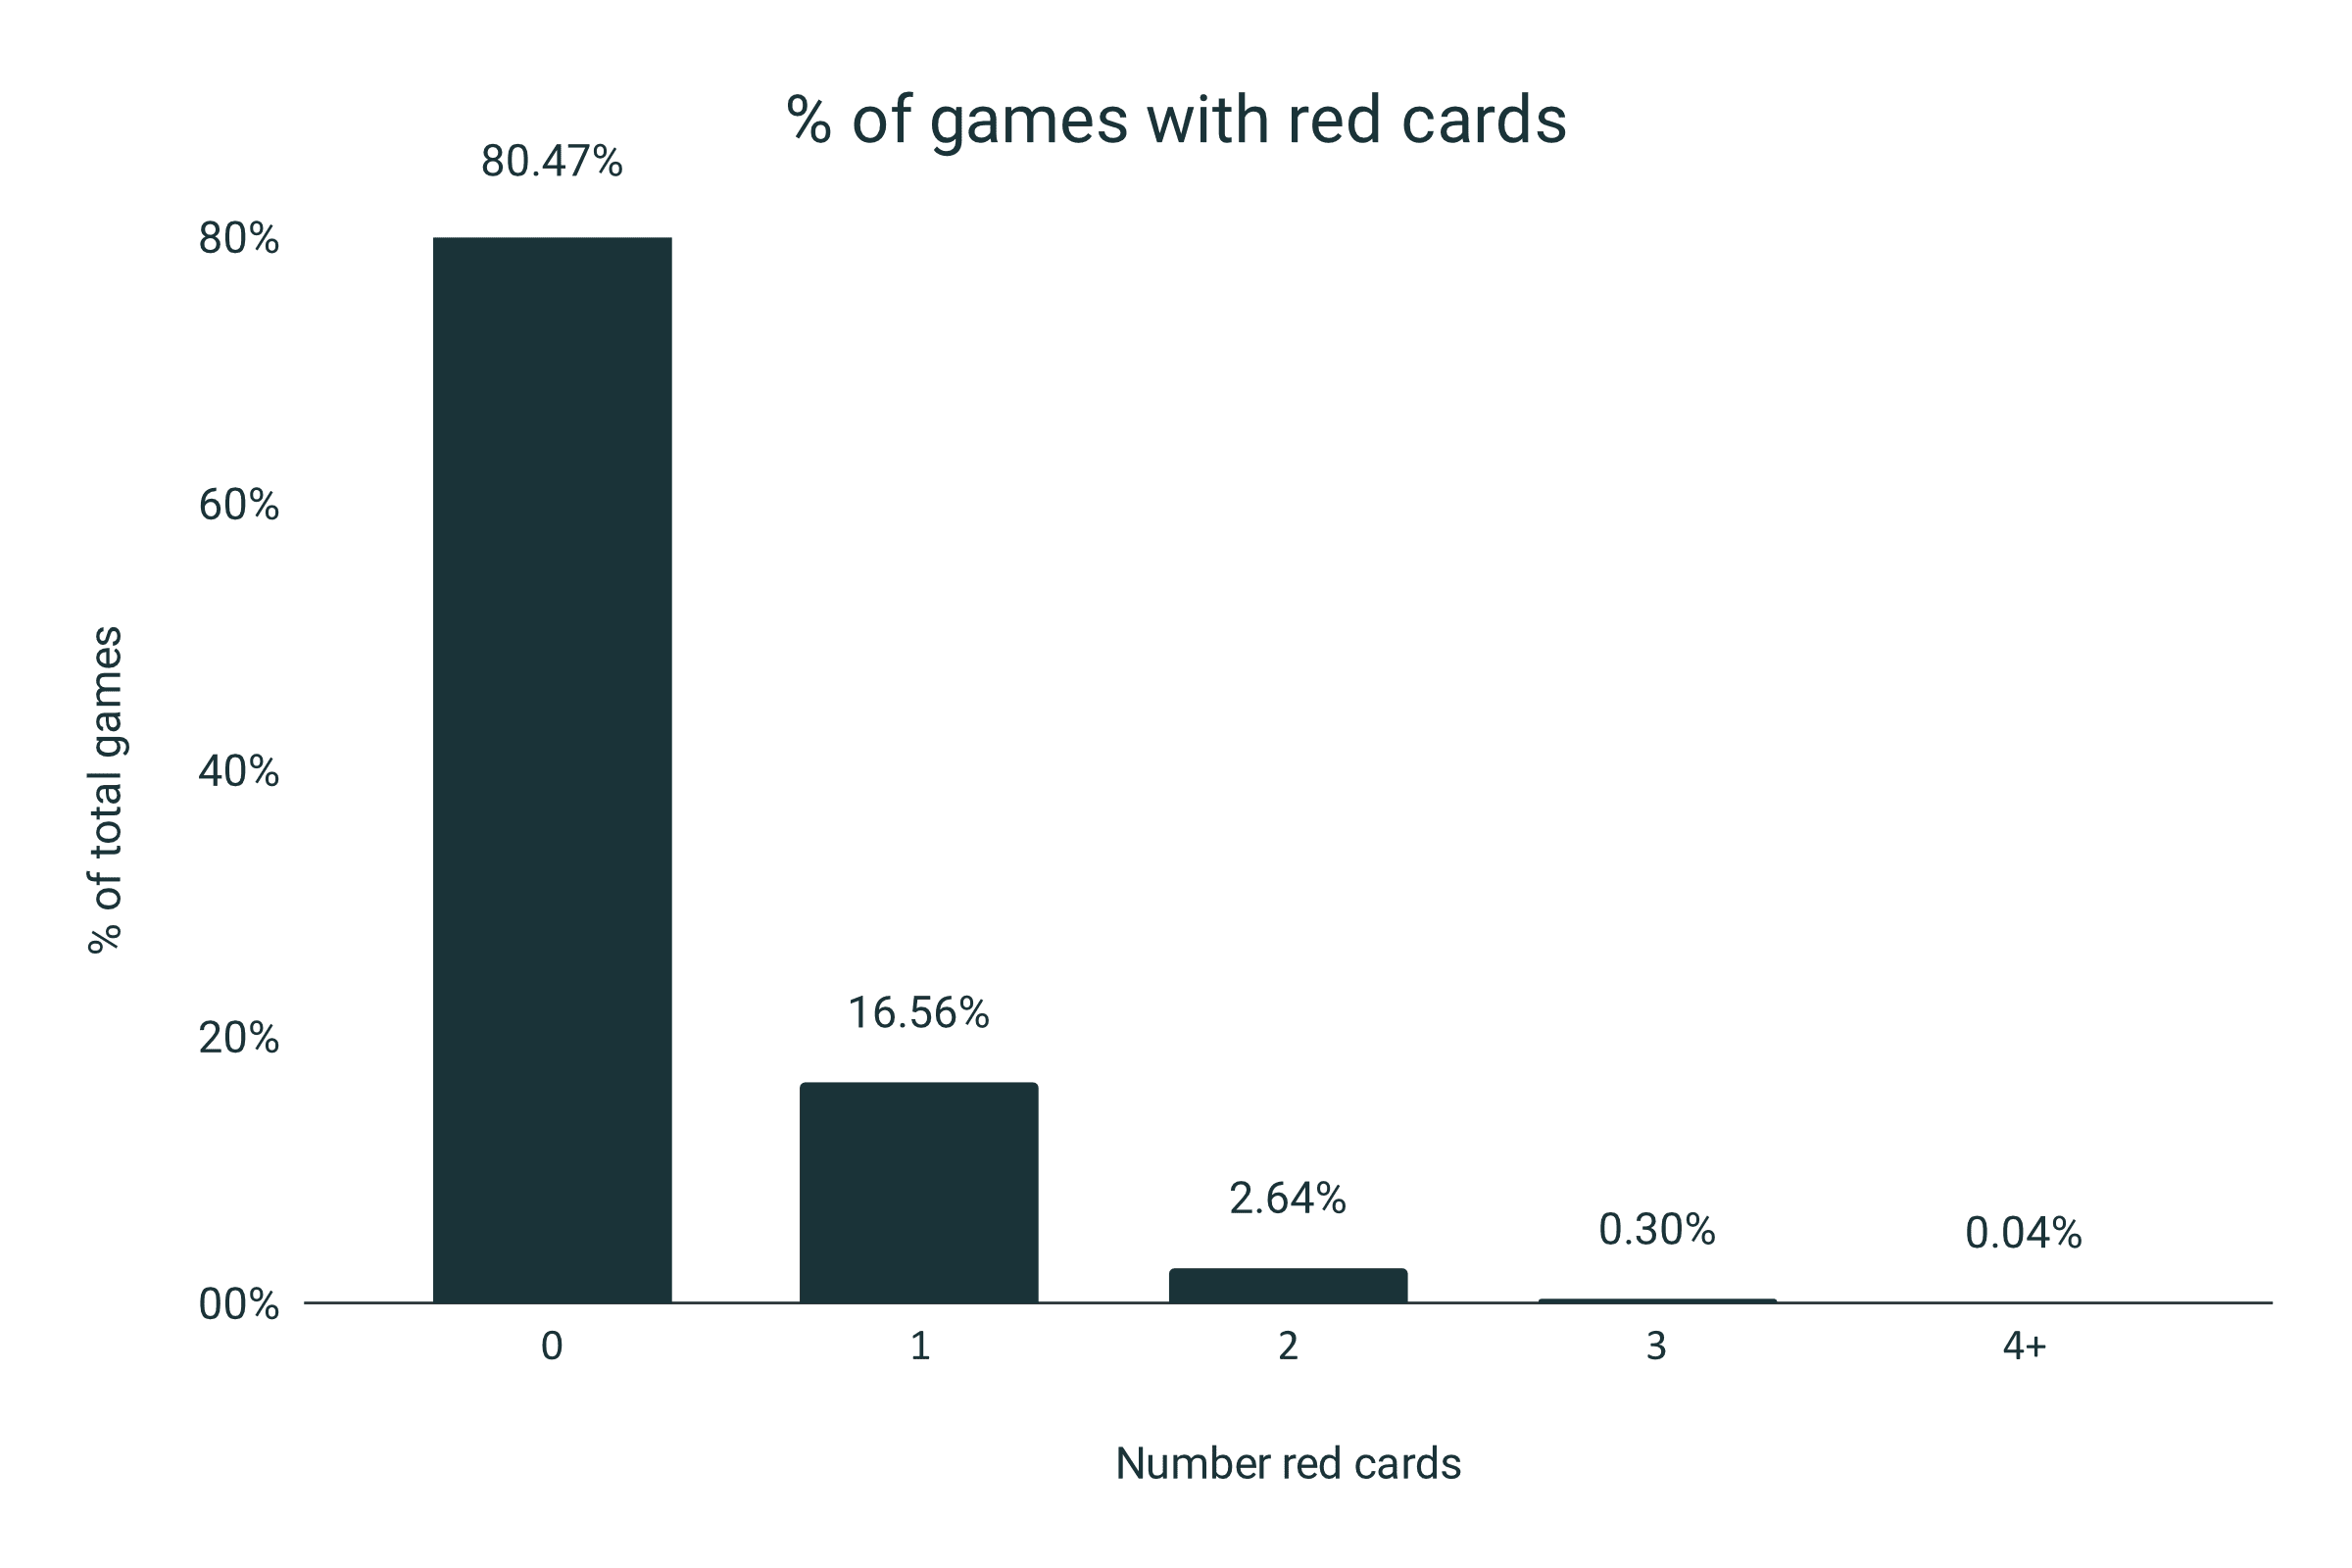
Over the course of the 19,985 games, 3,904 games contained at least one red card. That works out at 19.53% -- nearly 1 in 5 games contain at least 1 red card.
Multiple red cards in a game
In this section, we are only looking at the 3,904 games that contained at least one red card:
- In 84.78% of these games, only 1 red card was shown
- 2 red cards were shown in 13.50% of red card games
- 3 or more red cards were shown in just 1.72% of red card games
21.41% decrease in red cards over 10 years
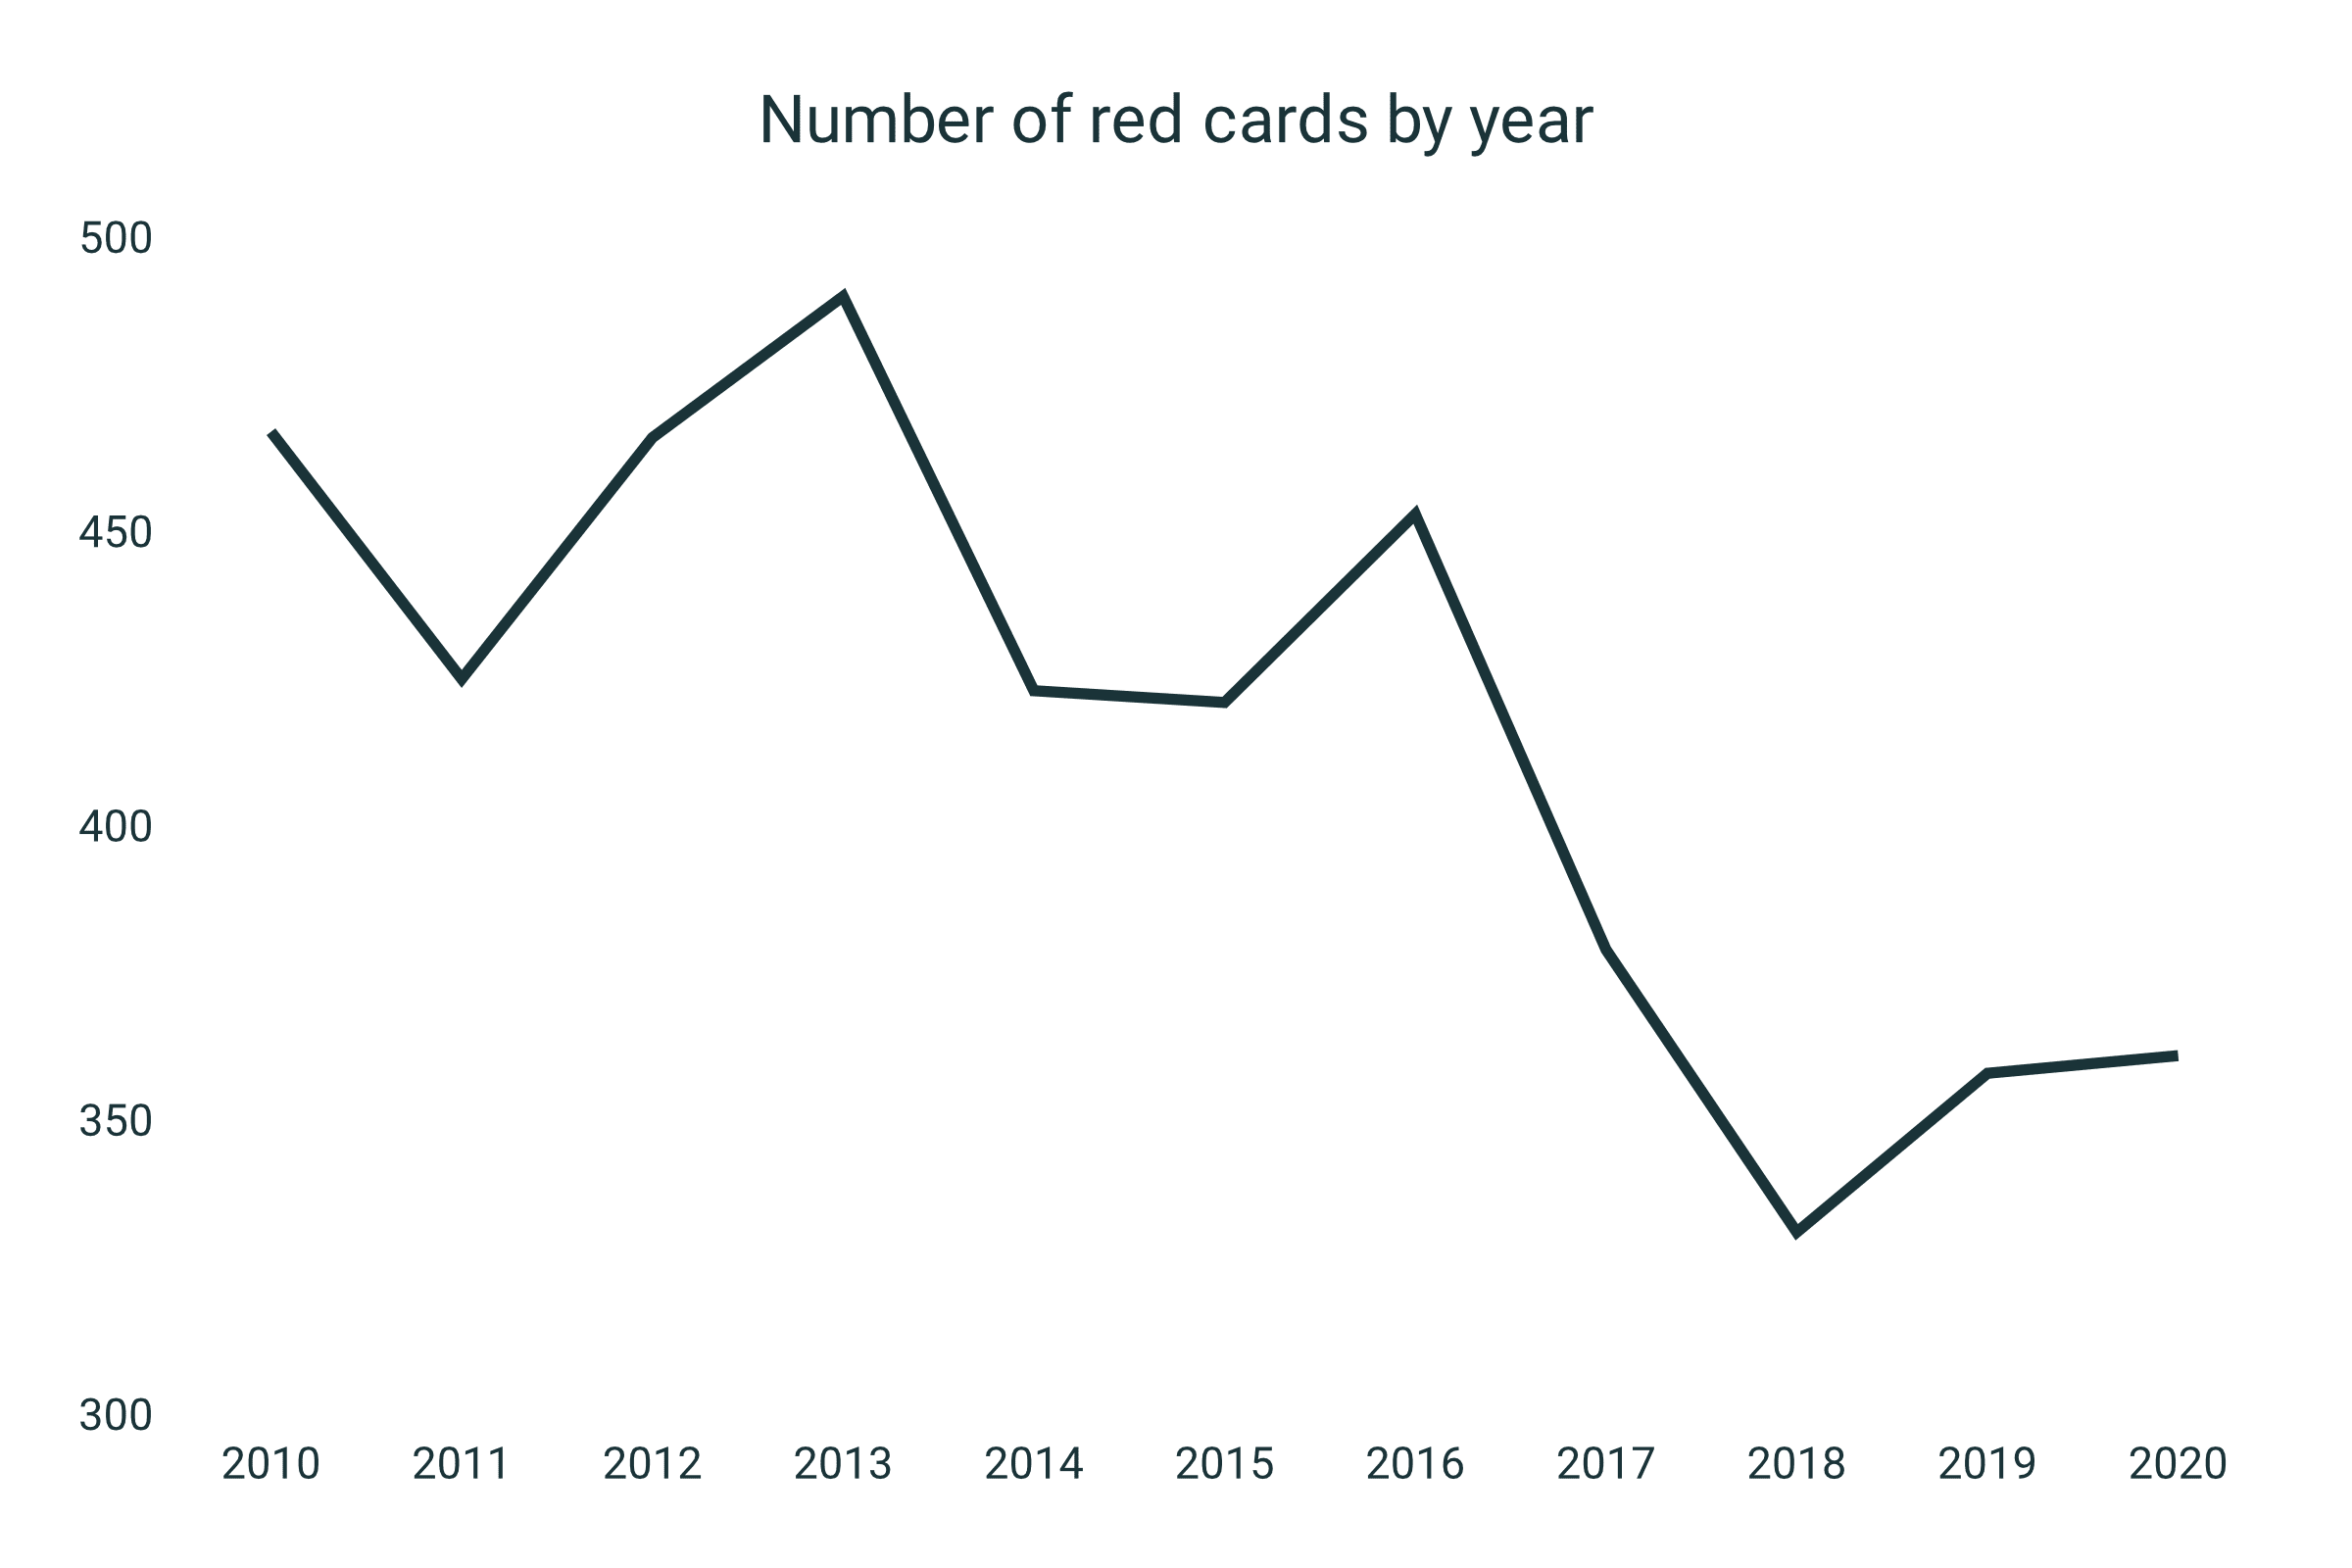
Over the previous 10 years, there has been a 21.41% reduction in the number of red cards from 467 in 2009/10 to 361 in 2020.
Interestingly, the sharpest decline happened from season 15/16 to season 16/17. Red cards decreased by 16.34% from 453 to 379 after the implementation of the “double jeopardy” rule where players no longer receive a red card for a foul in the box that accidentally denies a goalscoring opportunity while making a legitimate play for the ball.
League by league
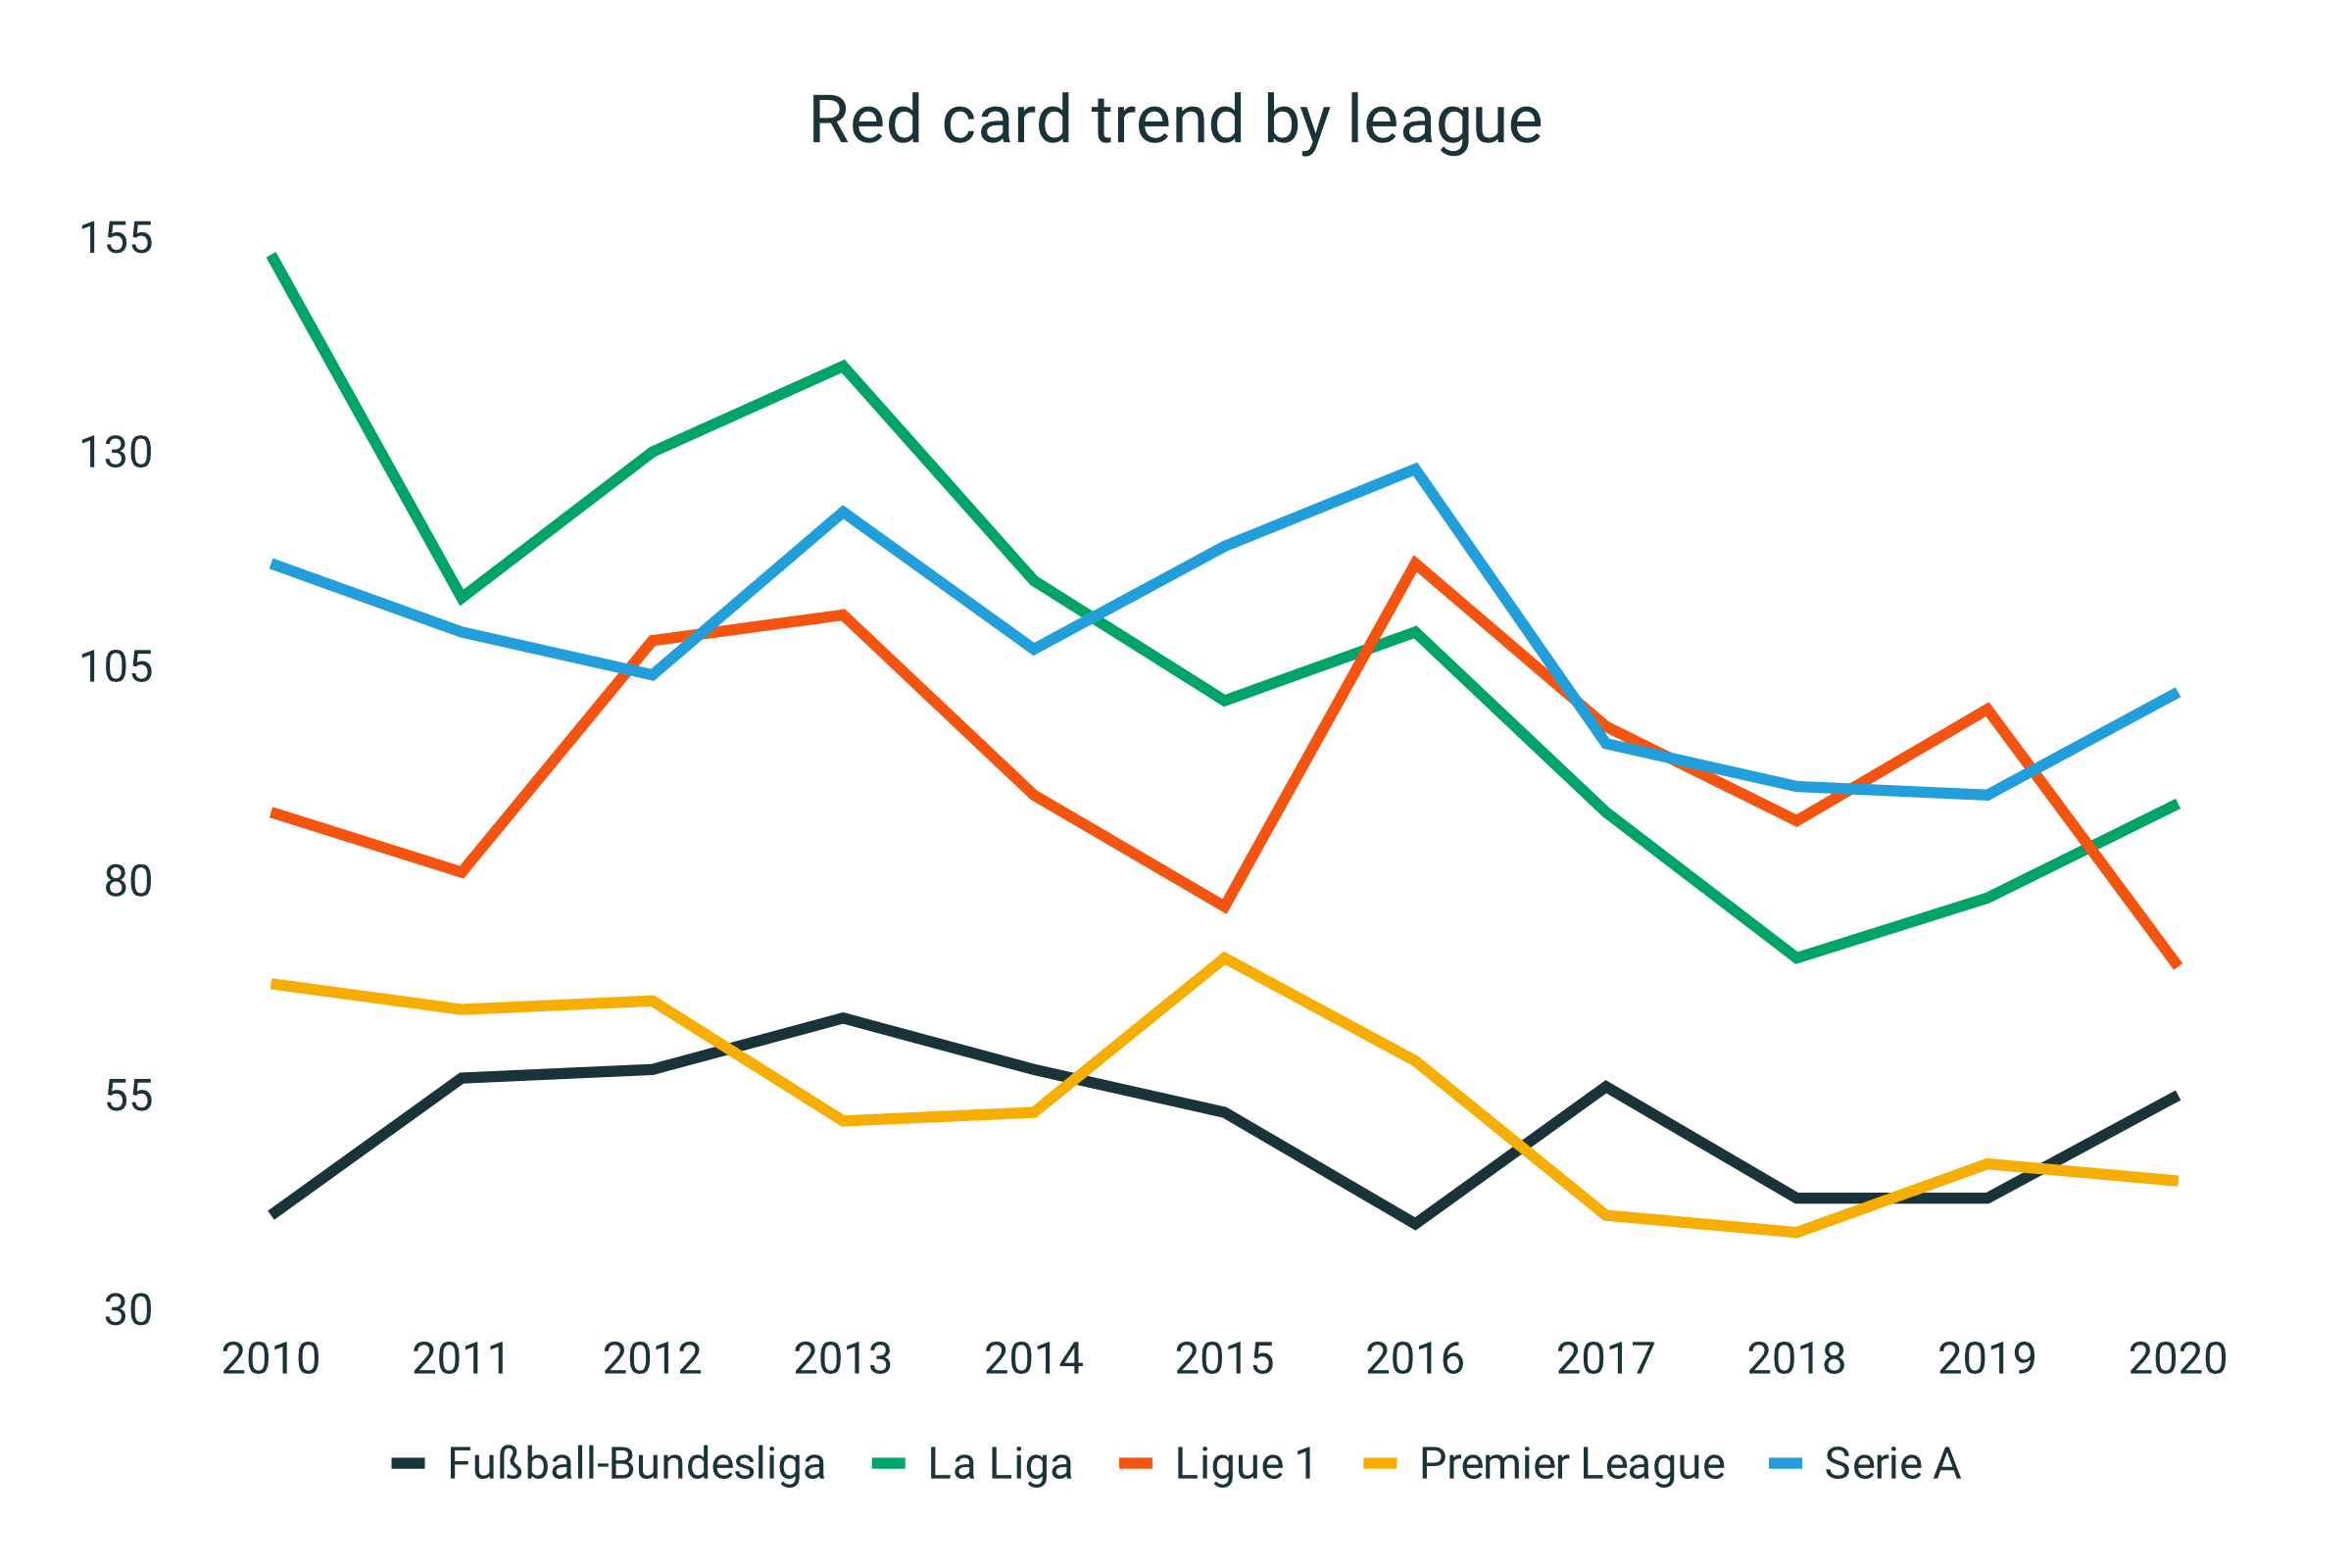
Interestingly, the German Bundesliga and English Premier League have consistently seen the fewest number of red cards over the past 10 years.
Considering these two leagues, especially the Premier League, are often perceived as the most physical or rugged of the top-5 leagues, this came as a surprise.
Ligue 1 was the league with the most red cards in 18/19. In the midst of the pandemic, Ligue 1 was cut short after 28 matchdays in 19/20. Despite all other leagues finishing their seasons, Ligue 1 still had more red cards than the Premier League and Bundesliga.
Interestingly, the Bundesliga is the only league to have had more red cards in season 2019/20 than they did in season 2009/10.
VAR leads to more and less red cards
As with everything VAR, nothing makes much sense.
The double jeopardy rule had a clear impact in reducing the number of red cards per season. To get a fair understanding of the number of red cards prior to VAR, we analyzed the average number of red cards per season after double jeopardy was introduced but prior to the introduction of VAR.
This was then compared to the average number of red cards per season after VAR was introduced. We believe this is the fairest way to truly understand what impact VAR has had on the number of red cards being shown across Europe’s top 5 leagues.
When looking at this data, it tells a confusing story:
In Serie A, nothing much changed with the difference well within the expected fluctuation we see from season to season.
Across the other 4 leagues, there was a split. In La Liga and the Premier League, red cards increased by 5.03% and 6.30% respectively.
In Ligue 1 and the Bundesliga, red cards decreased by 8.11% and 16.07%.
Average red cards per season before and after the introduction of VAR
| Competition | Avg. Prior to VAR** | Avg. after VAR | % Change |
| Serie A | 96.00 | 94.33 | -1.74% |
| La Liga | 79.50 | 83.50 | +5.03% |
| Bundesliga | 56.00 | 47.00 | -16.07% |
| Premier League | 42.33 | 45.00 | +6.30% |
| Ligue 1 | 92.50 | 85.00 | -8.11% |
| All Leagues | 69.22 | 73.27 | +5.85% |
*The first season of VAR for each league was: Serie A - 17/18, La Liga - 18/19, Bundesliga - 17/18, Premier League - 19/20, Ligue 1 - 18/19.
**Avg. prior to var is calculated based on red card totals per league after the implementation of double jeopardy and prior to the implementation of VAR in order to reflect the most complete and accurate data.
Use of data
This data has been collected from 19,985 games in Europe’s top 5 leagues between seasons 2009/10 and 2019/20.
It contains:
- German Bundesliga: 3,366 games
- Spanish La Liga: 4,180 games
- French Ligue 1: 4,079 games (due to Covid shortened 2019/20)
- English Premier League: 4,180 games
- Italian Serie A: 4,180 games
Data may be used and reprinted with full attribution to runrepeat.com/red-card-frequency.