PUMA business statistics
Top PUMA business statistics
- PUMA SE (PUM) is valued at €16.88 billion
- PUMA generates €5.23 billion of sales each year
- 96% of PUMA products are sourced or manufactured in Asia
- The three-person management board of PUMA, including the CEO, were paid a combined €2.2 million in 2020, less than 5% of the Nike CEO’s total compensation in 2020
- PUMA spend €1 billion per year on marketing and retail expenses
PUMA financial statistics

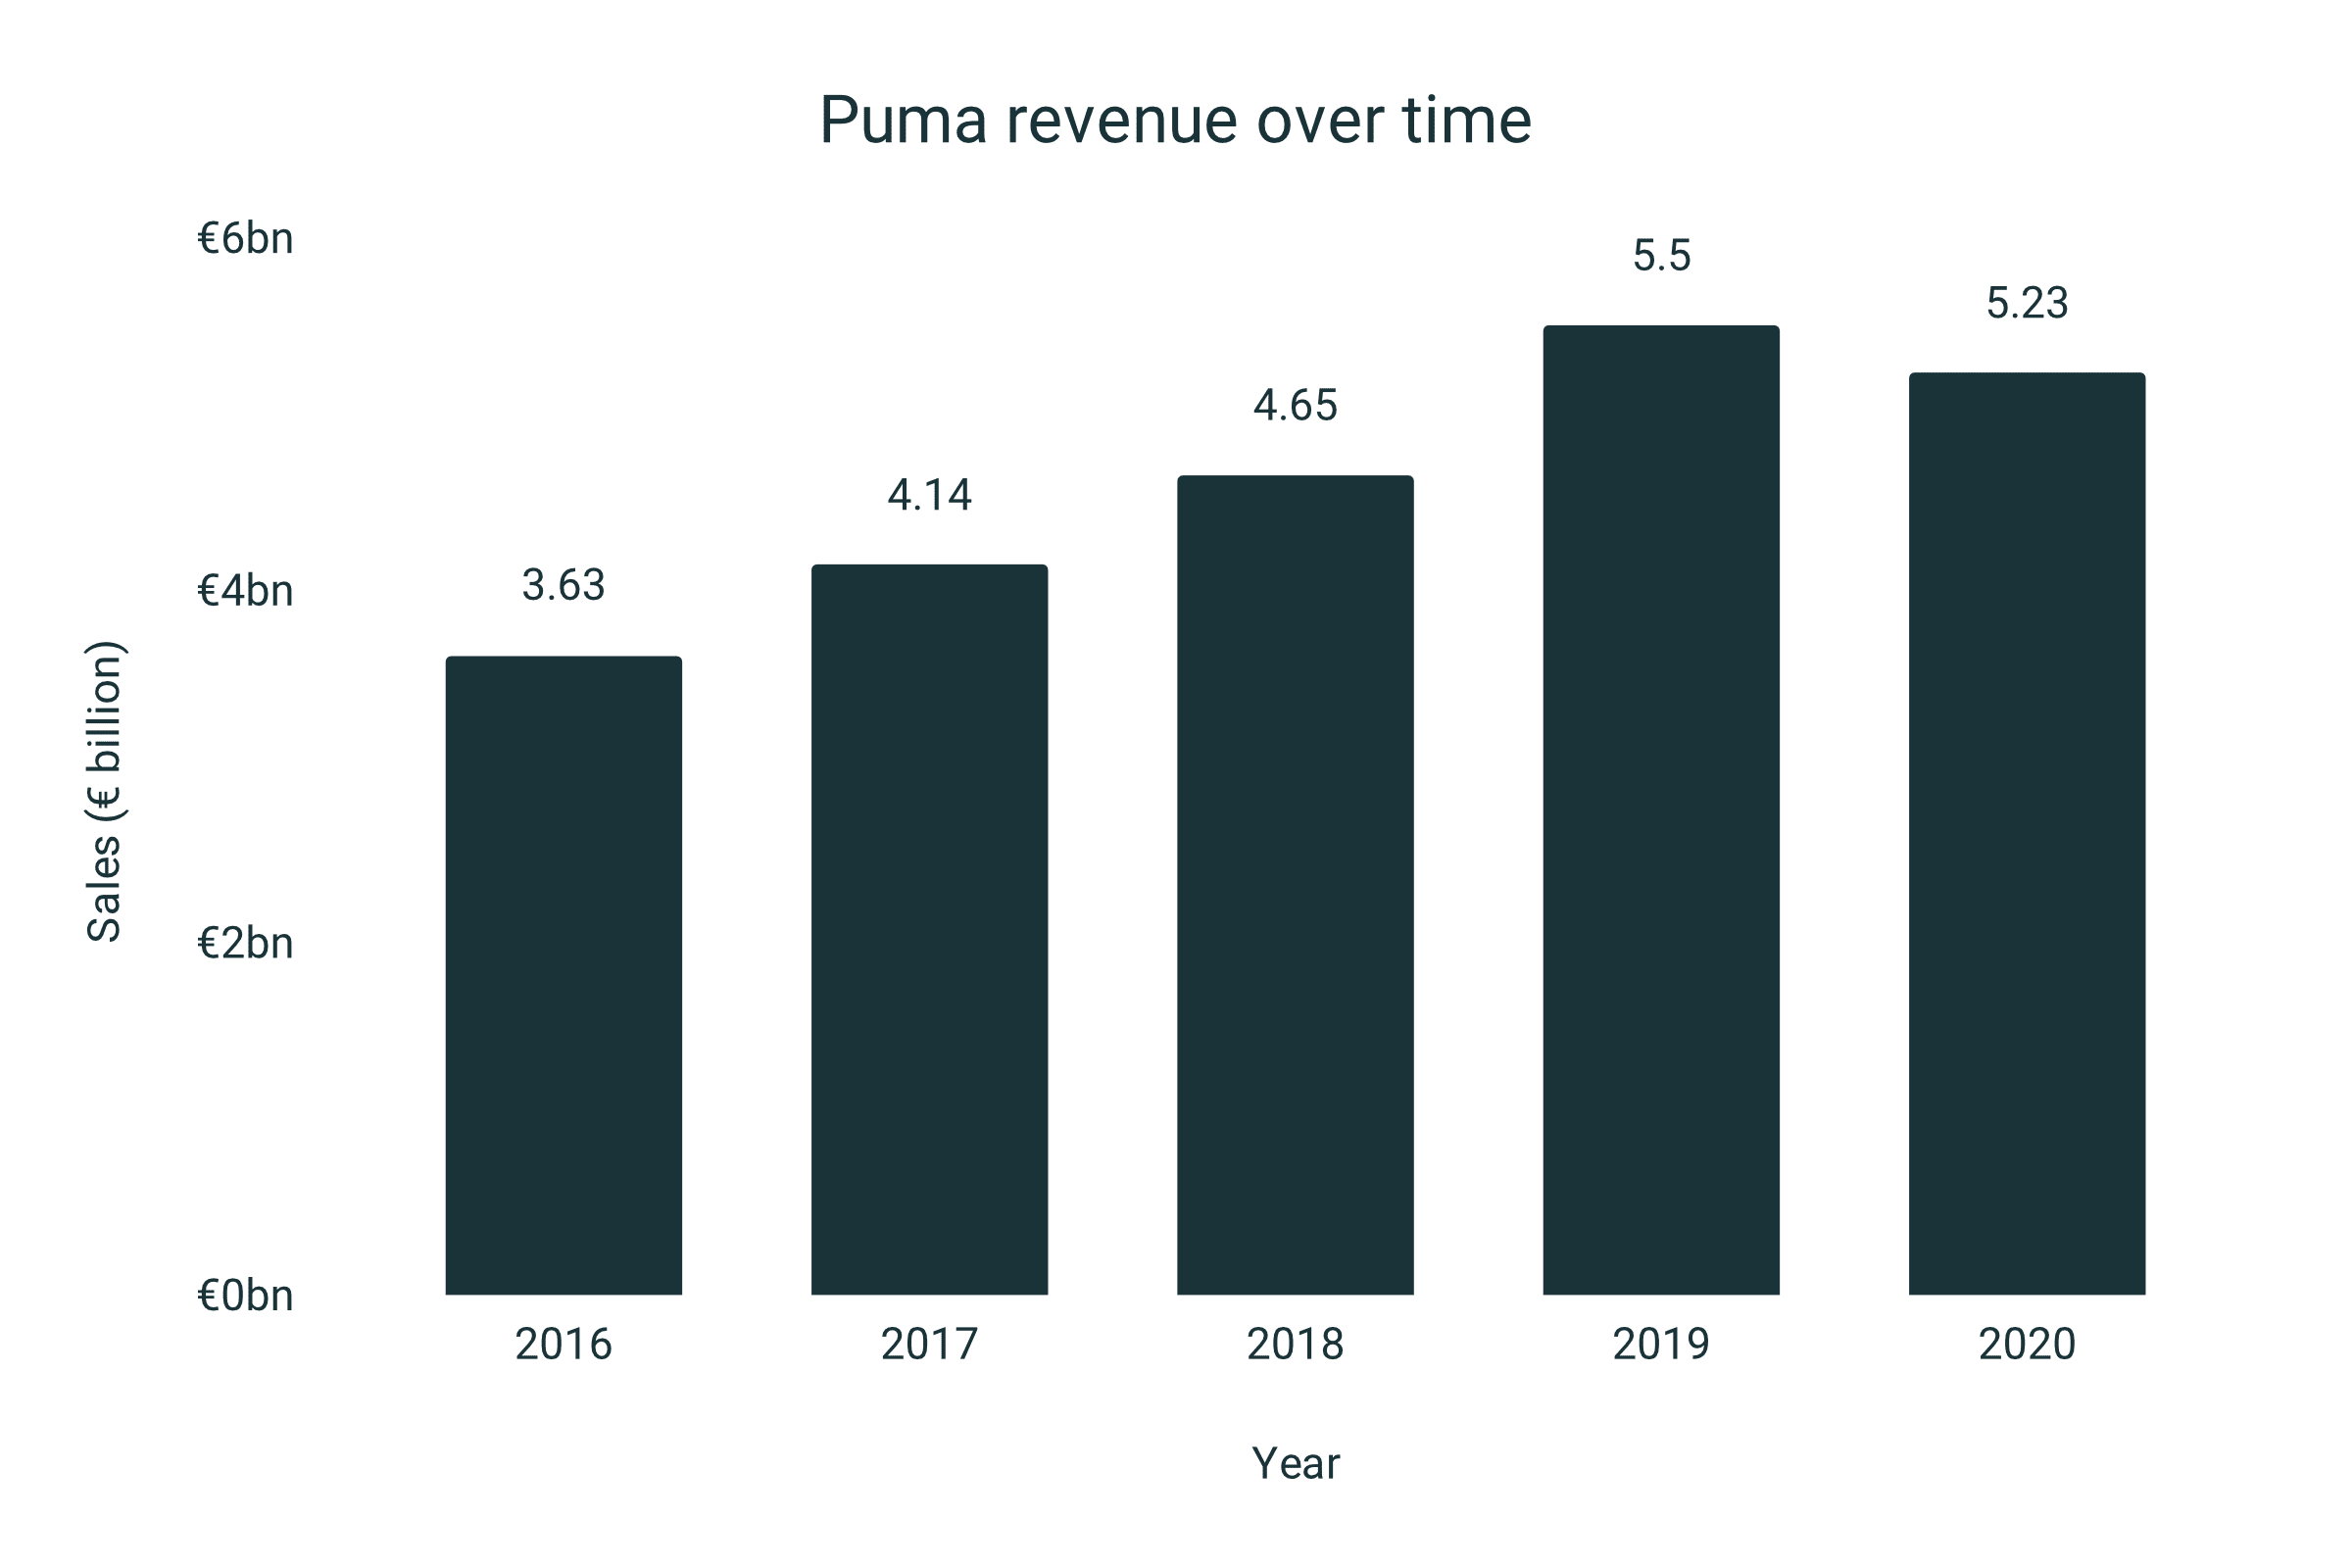
- PUMA’s revenue in 2020 was €5.23 billion
- PUMA’s revenues grew 51.51% from 2016 to 2019 before their growth was interrupted by the pandemic in 2020
- In the 3rd quarter of 2020, PUMA had their best-ever quarter generating sales of €1.58 billion
- PUMA pay €39.2 million in taxes at a rate of 24.2%
PUMA sales by region
- PUMA sold €1.98 billion worth of product in their EMEA region (Europe, Middle East and Africa)
- PUMA generated sales of €1.77 billion in the Americas
- PUMA generated sales of €1.47 billion in the Asia-Pacific region
PUMA sales by channel
- PUMA’s wholesale revenue makes up 72.7% of all sales at €3.8 billion
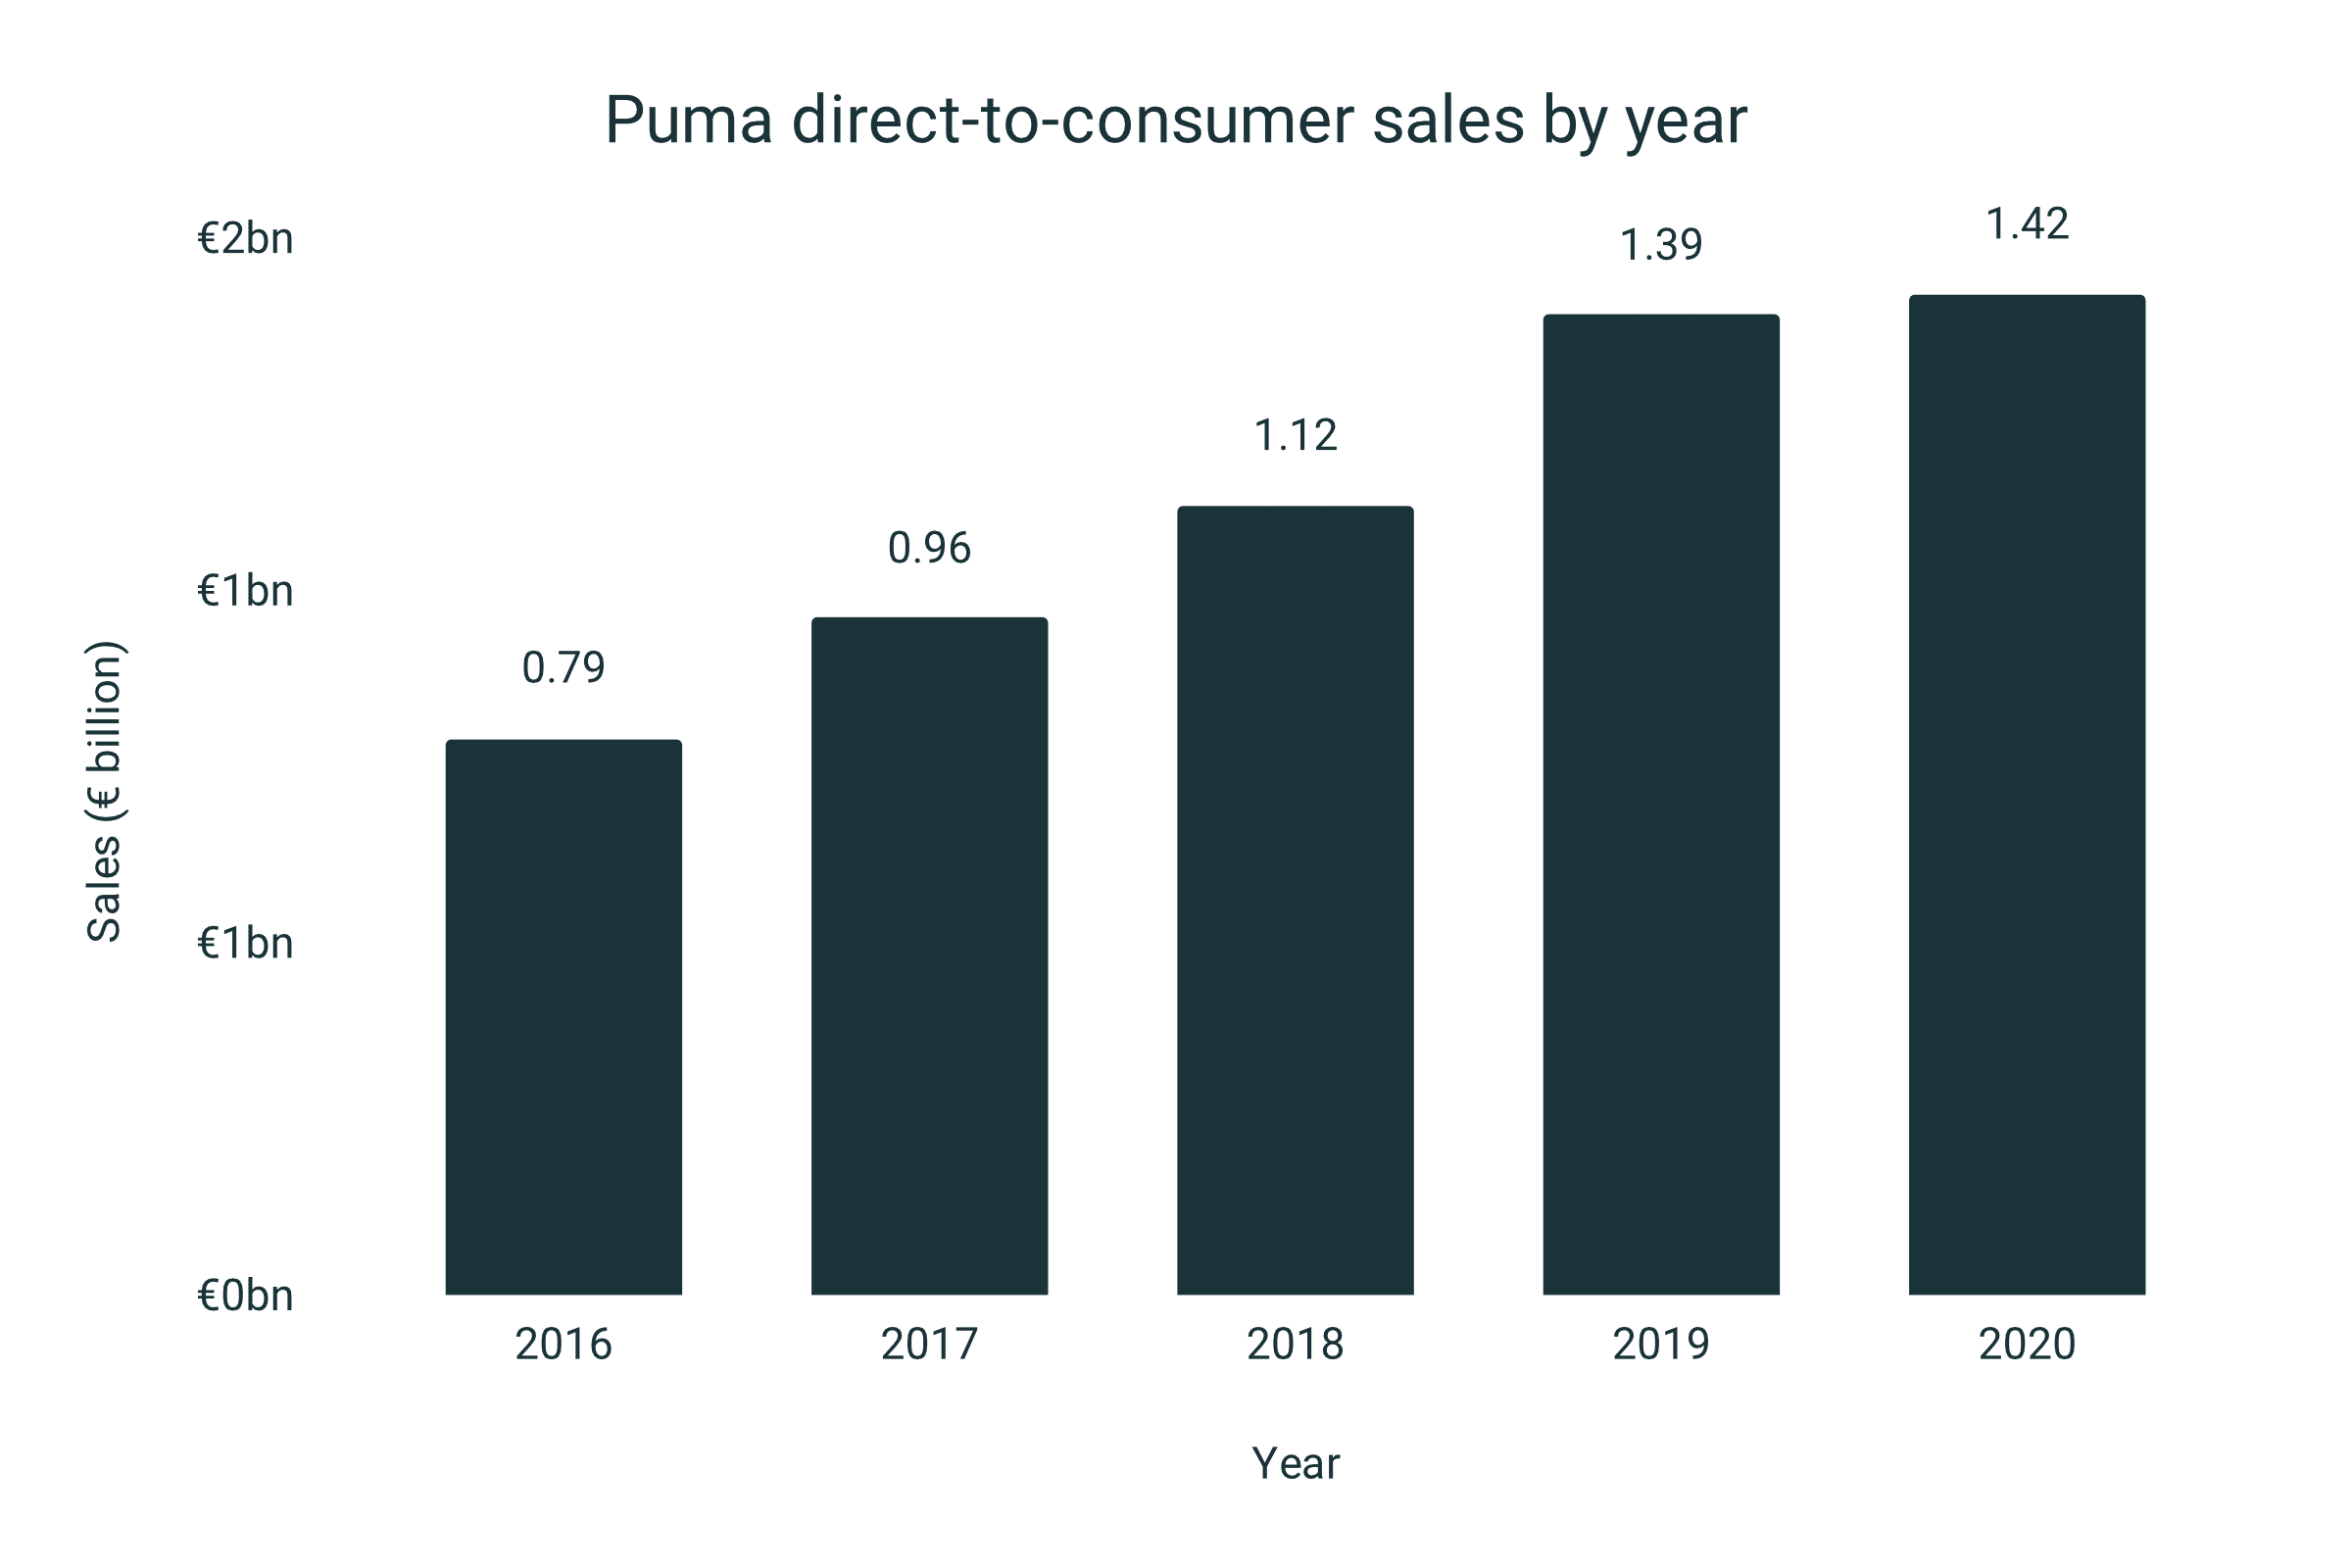
- PUMA’s direct-to-consumer sales make up 27.2% of all sales at €1.42 billion
- Direct to Consumer (Retail stores and e-commerce) increased by 6.4% despite the pandemic and sales at PUMA’s own retail stores declined
- This is due to the PUMA e-commerce business growing by over 60%
- PUMA’s direct-to-consumer sales have almost doubled since 2016, growing by 97.2%
- PUMA’s licensing income from royalties and commissions decreased by 36% to €16.1 million
PUMA sales by product
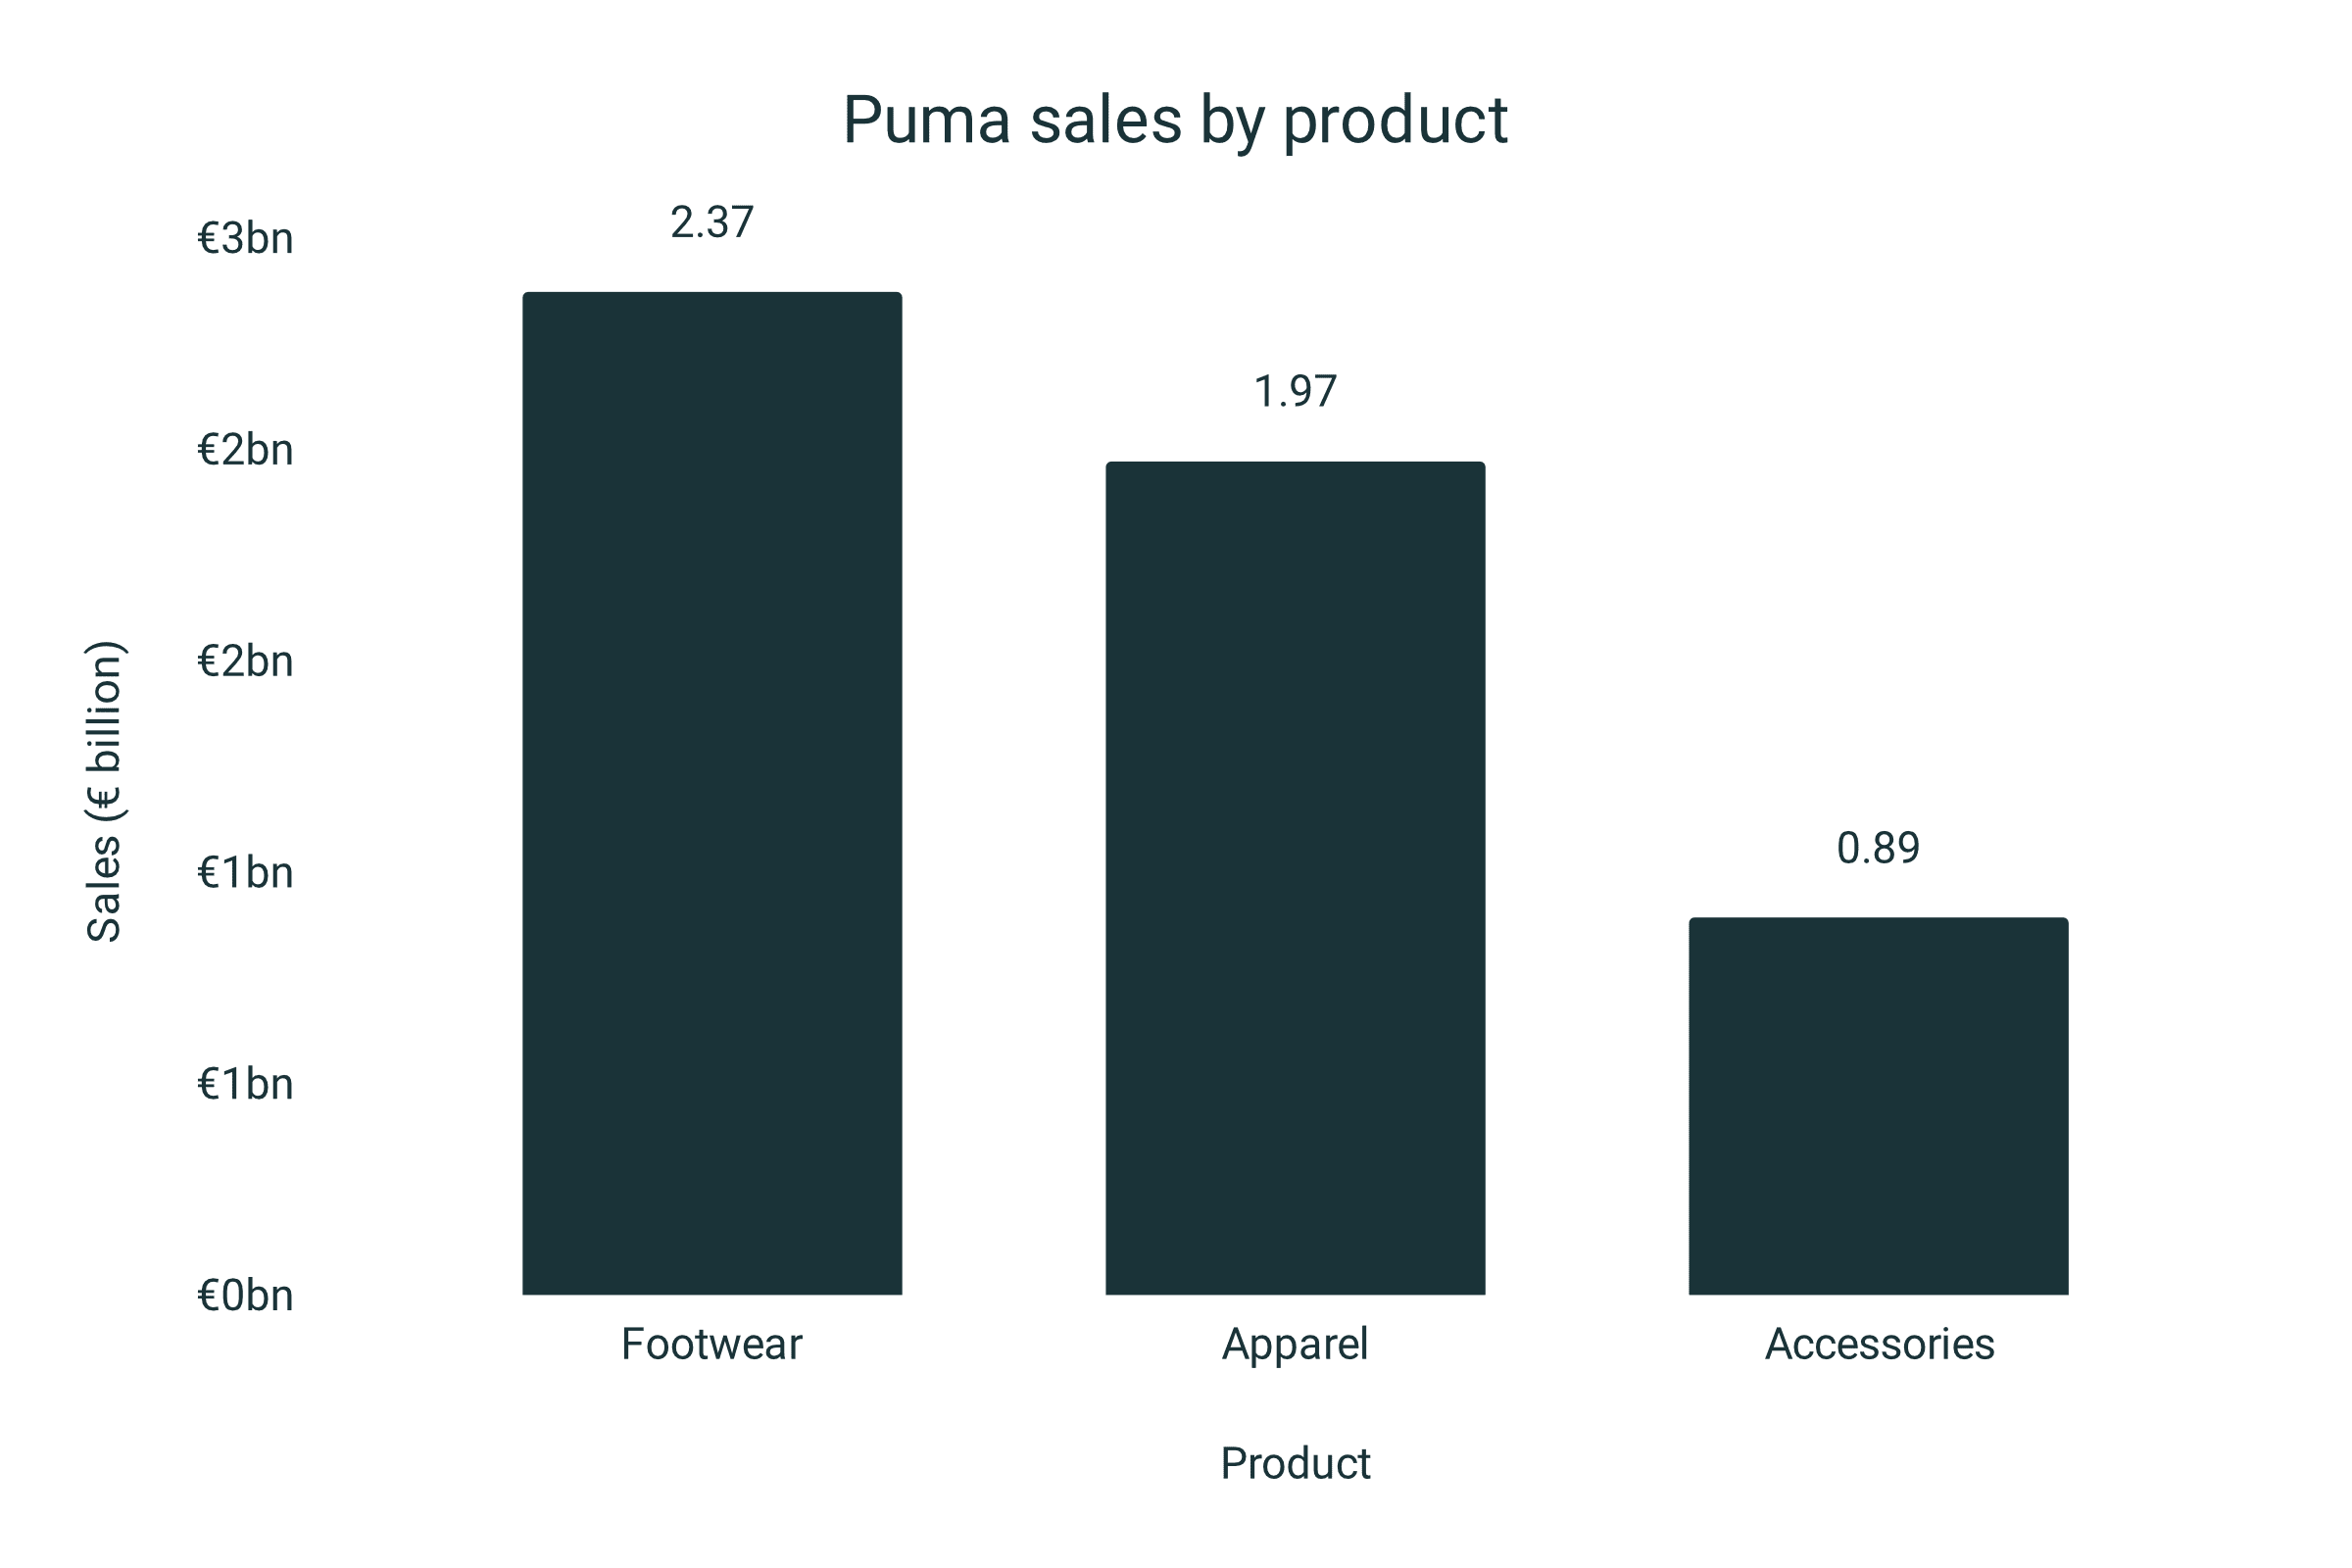
- Footwear makes up 45.2% of PUMA sales at €2.37 billion
- Apparel makes up 37.7% of PUMA sales at €1.97 billion
- Sales of PUMA accessories total €892 million
Covid-19’s impact on PUMA
- At the start of the pandemic, PUMA secured total credit lines of €1.8 billion
- €900 million of this was from KfW, the German state bank
- PUMA worked to protect suppliers, employee jobs, and wholesale retail partners
- Retail partners were offered delayed deliveries and extended payment terms
- Suppliers were asked to slow down production but not to cancel orders
- PUMA held more inventory in warehouses
- Less than 1% of all orders from suppliers were canceled
PUMA manufacturing and distribution
- PUMA outsources almost all of its production to 139 independent suppliers
- These suppliers are in 31 countries around the world
- 96% of PUMA products are sourced or manufactured in Asia
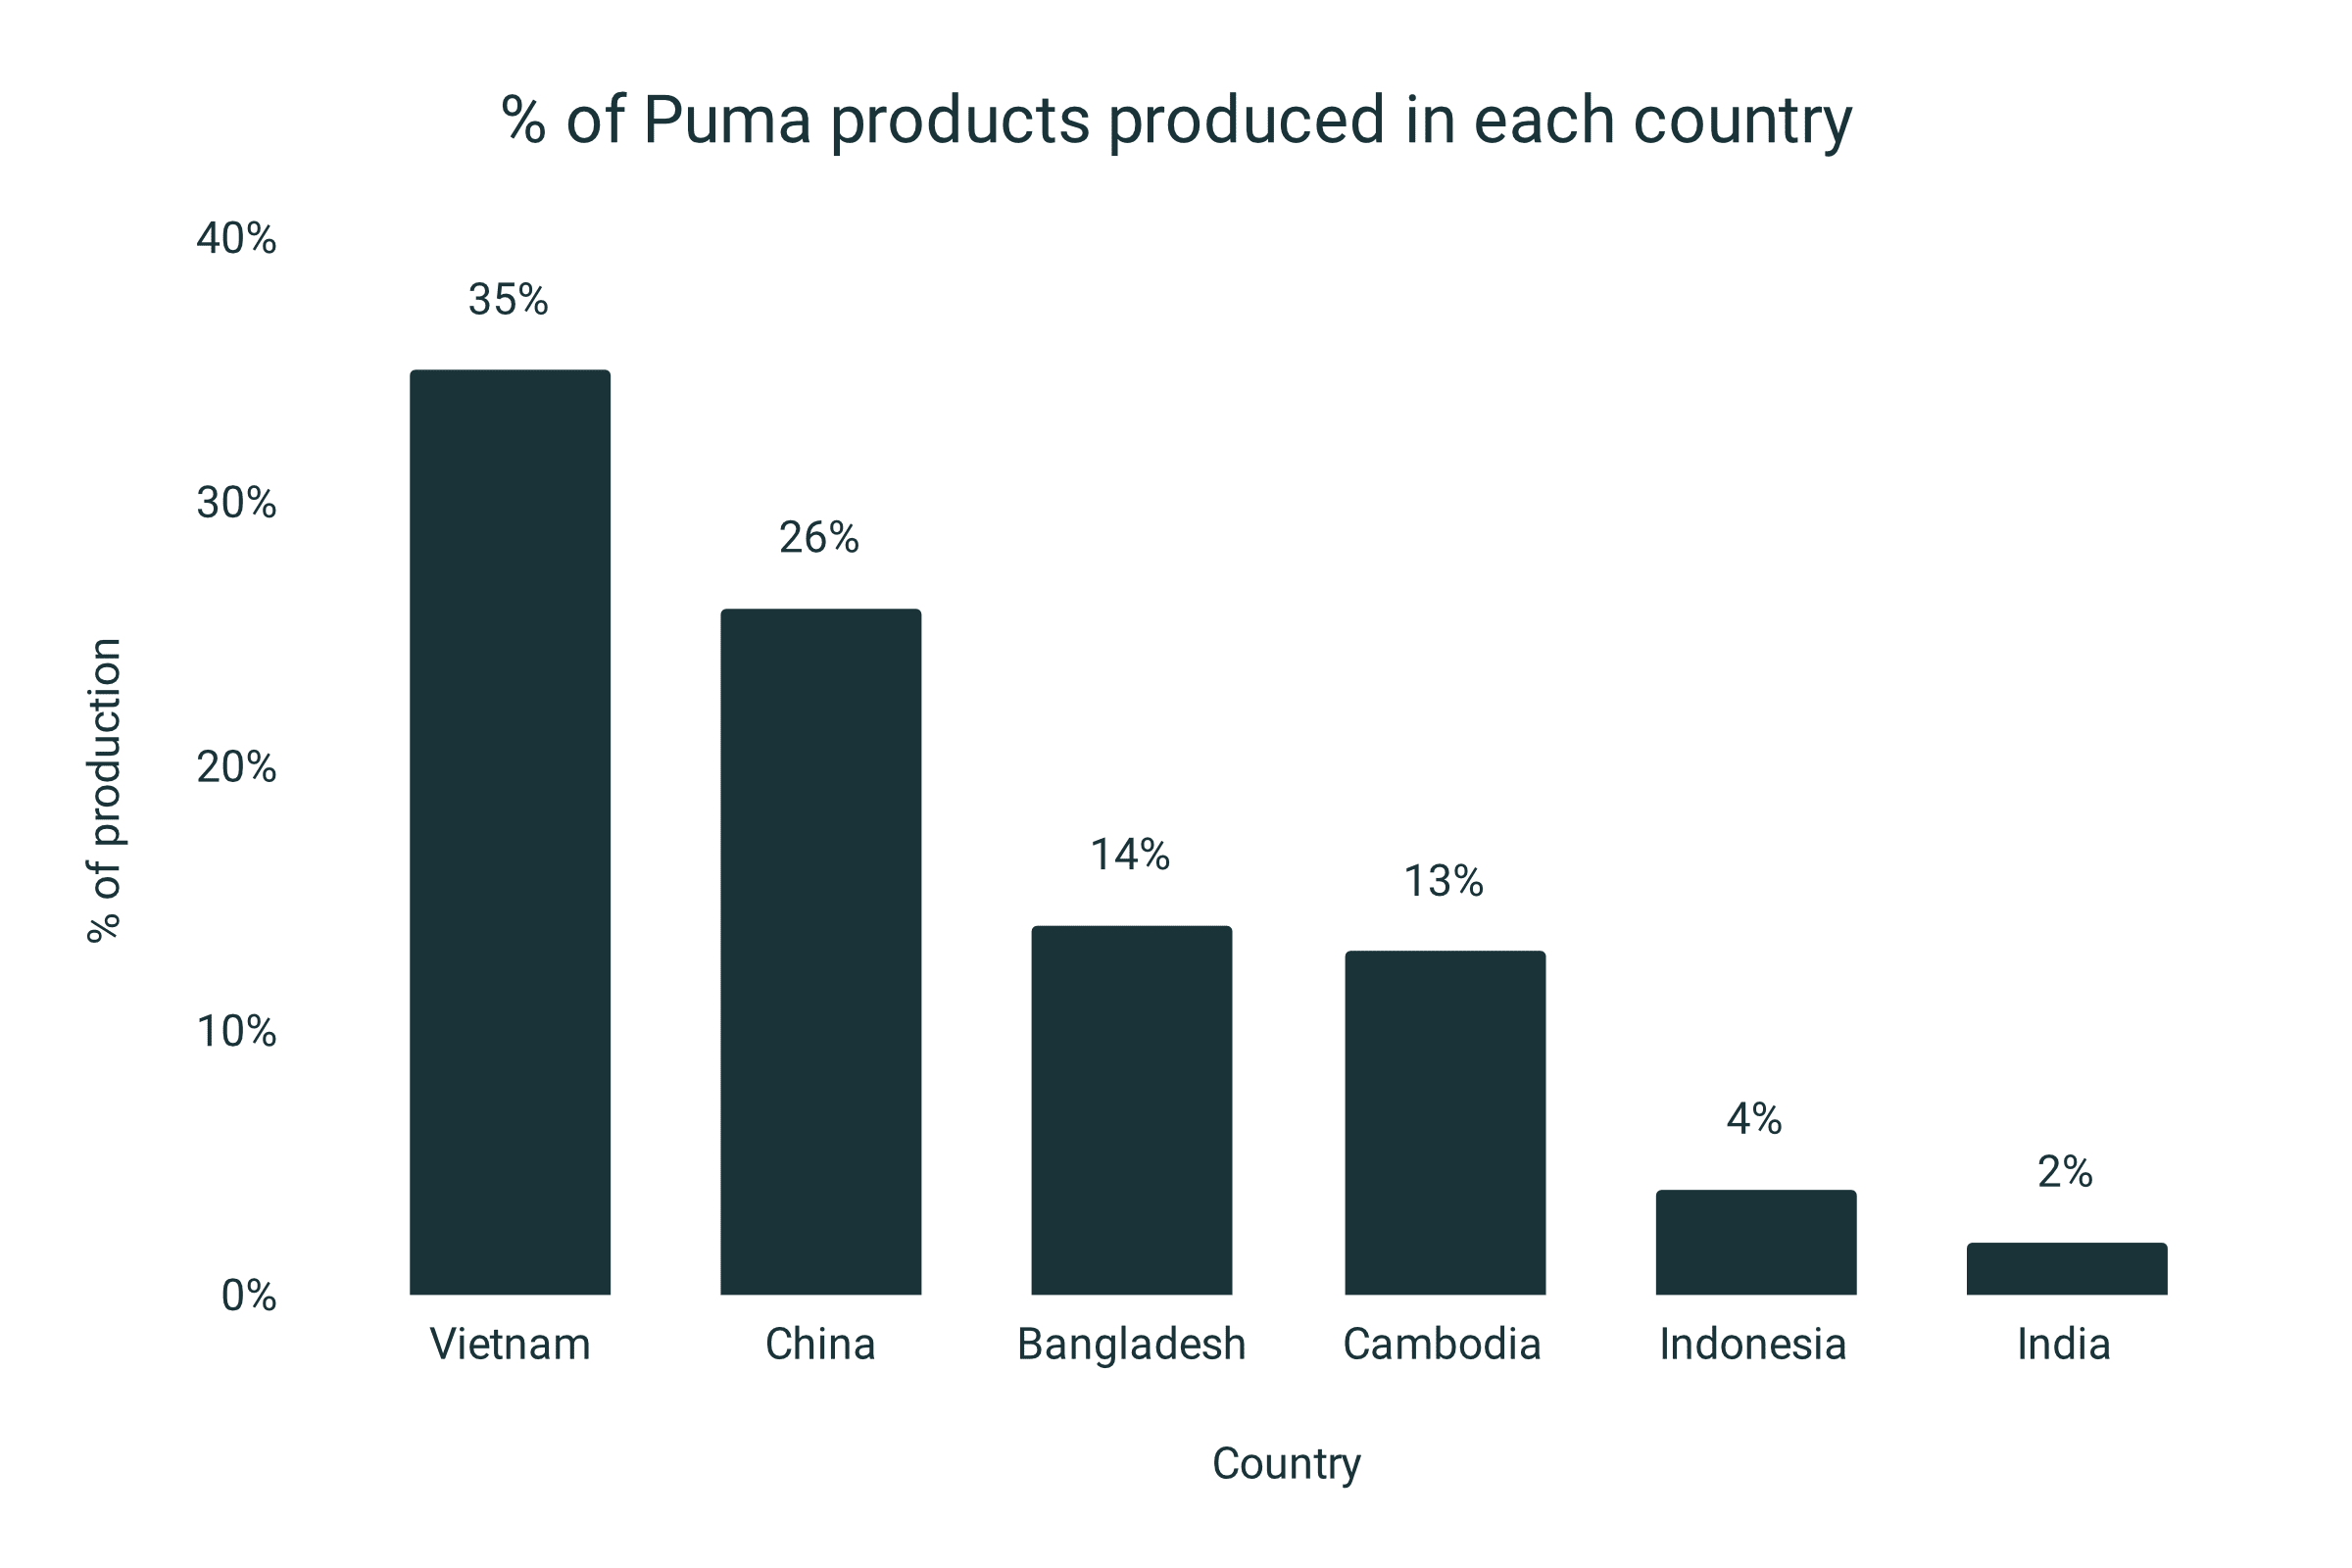
- 6 countries are responsible for 94% of all production
- Vietnam - 35%
- China - 26%
- Bangladesh - 14%
- Cambodia - 13%
- Indonesia - 4%
PUMA Sustainability
- 100% of the cotton used in PUMA products is “more sustainable”
- PUMA uses 650 tons of plastic shopping bags each year
- 400 tons in store
- 250 tons in product packaging
- Only 4.9% of these plastic bags contain recycled materials
- 81% of PUMA apparel contains at least 50% “more sustainable” material
- This compares to 47% of accessories and 24% of footwear being made of more than 50% more sustainable materials
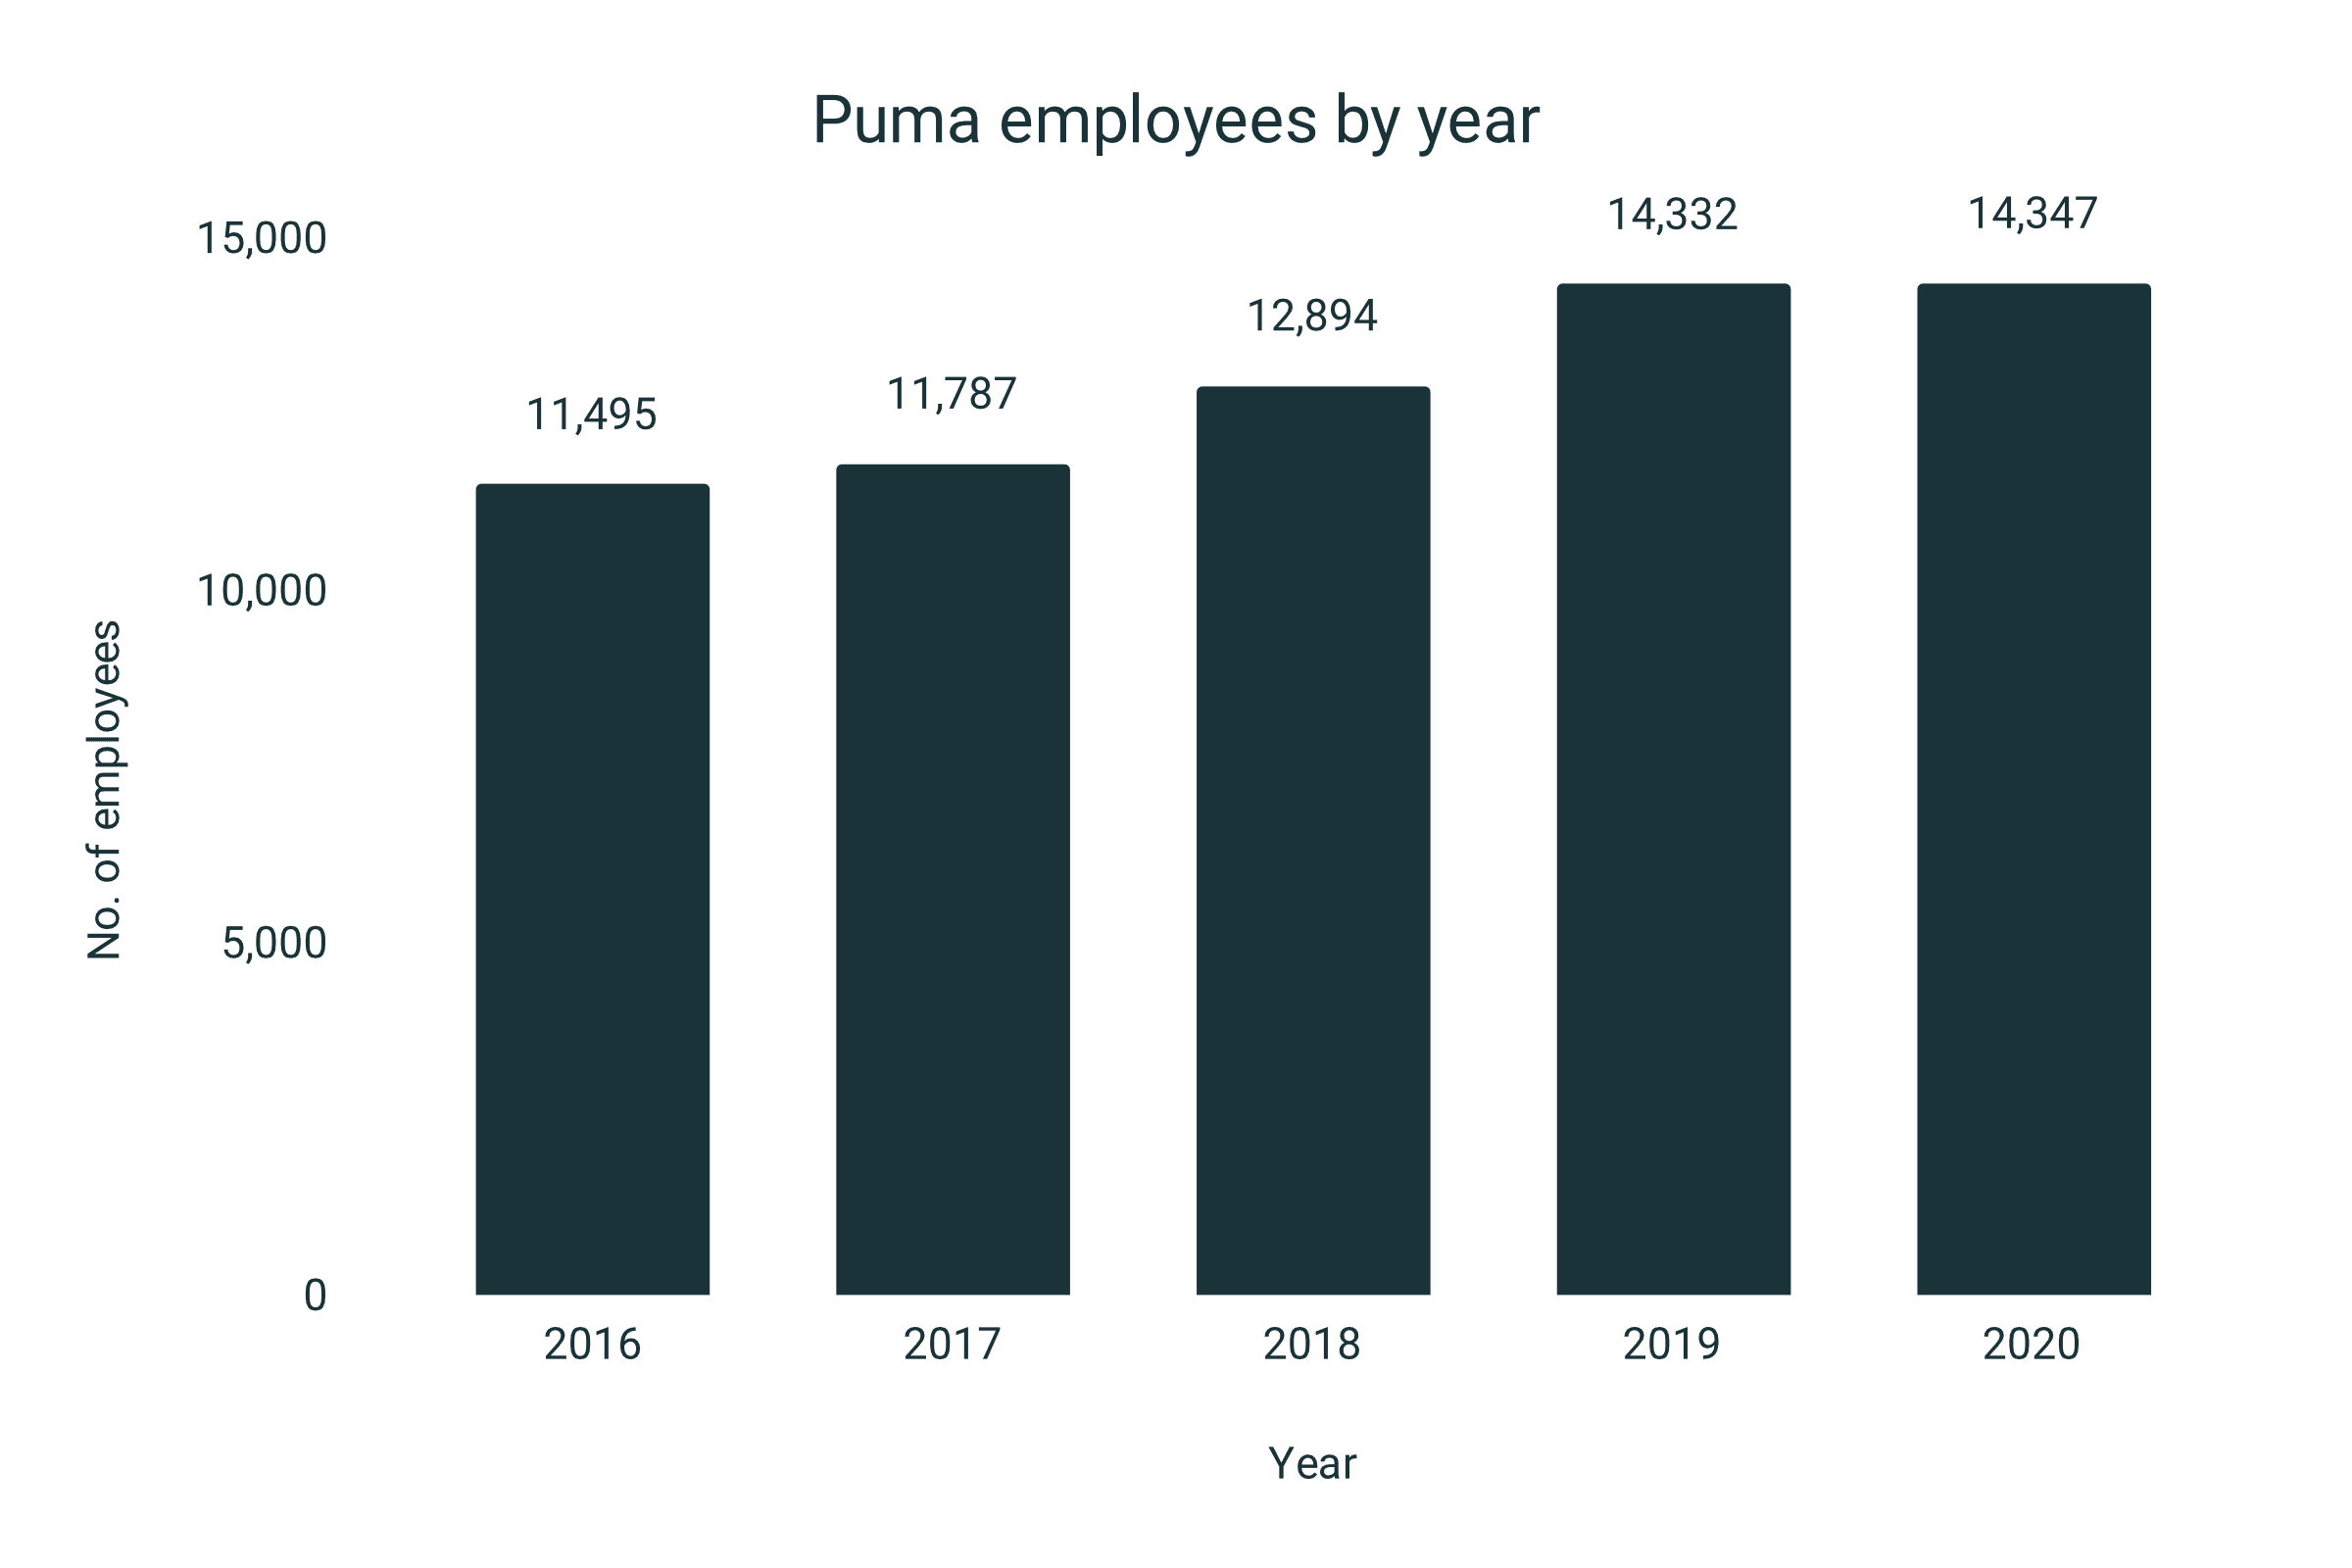
PUMA employee statistics
- PUMA has 14,347 employees
- PUMA spends €441.9 million wages and salaries each year
- The average salary for a PUMA employee is €30,743
- There is a 50% to 50% male-to-female ratio of employees across all locations in which PUMA operate
- 29% of PUMA employees are covered by a collective bargaining agreement
|
Department |
No. of Employees |
|
Marketing, retail and sales |
10,761 |
|
R&D |
1,049 |
|
Administration |
2,564 |
- The entire PUMA management board (3 members) were paid €2.2 million - working out at approximately €733,000 each if split equally
- This is less than 5% of the Nike CEO’s total compensation in 2020