Online Shoe Sales Statistics
Top online shoe sales statistics
- Worldwide online shoe sales are valued at $113.04 billion as of 2023.
- At a 6.8% CAGR, these numbers are forecasted to reach $157.06 billion by the end of 2028.
- As of 2023, shoe sales via e-commerce take up about a third of the footwear market.
- Physical share in the same year takes 68.8% of the market.
- Mobile devices are the preferred means to purchase shoes online as of 2023, taking up a 58.8% share of the market.
- Desktop computers are responsible for 41.2% of online shoe revenue in the same year.
- Among footwear types, leather shoes have a big presence in online shoe sales, generating 69.37 billion as of 2023.
- Based on 2021 data, amazon.com and walmart.com dominated in online footwear revenue, with the former netting $1,636 million in sales.
- Roughly 63% of consumers look forward to doing their shoe footwear shopping online during the 2023 holidays.
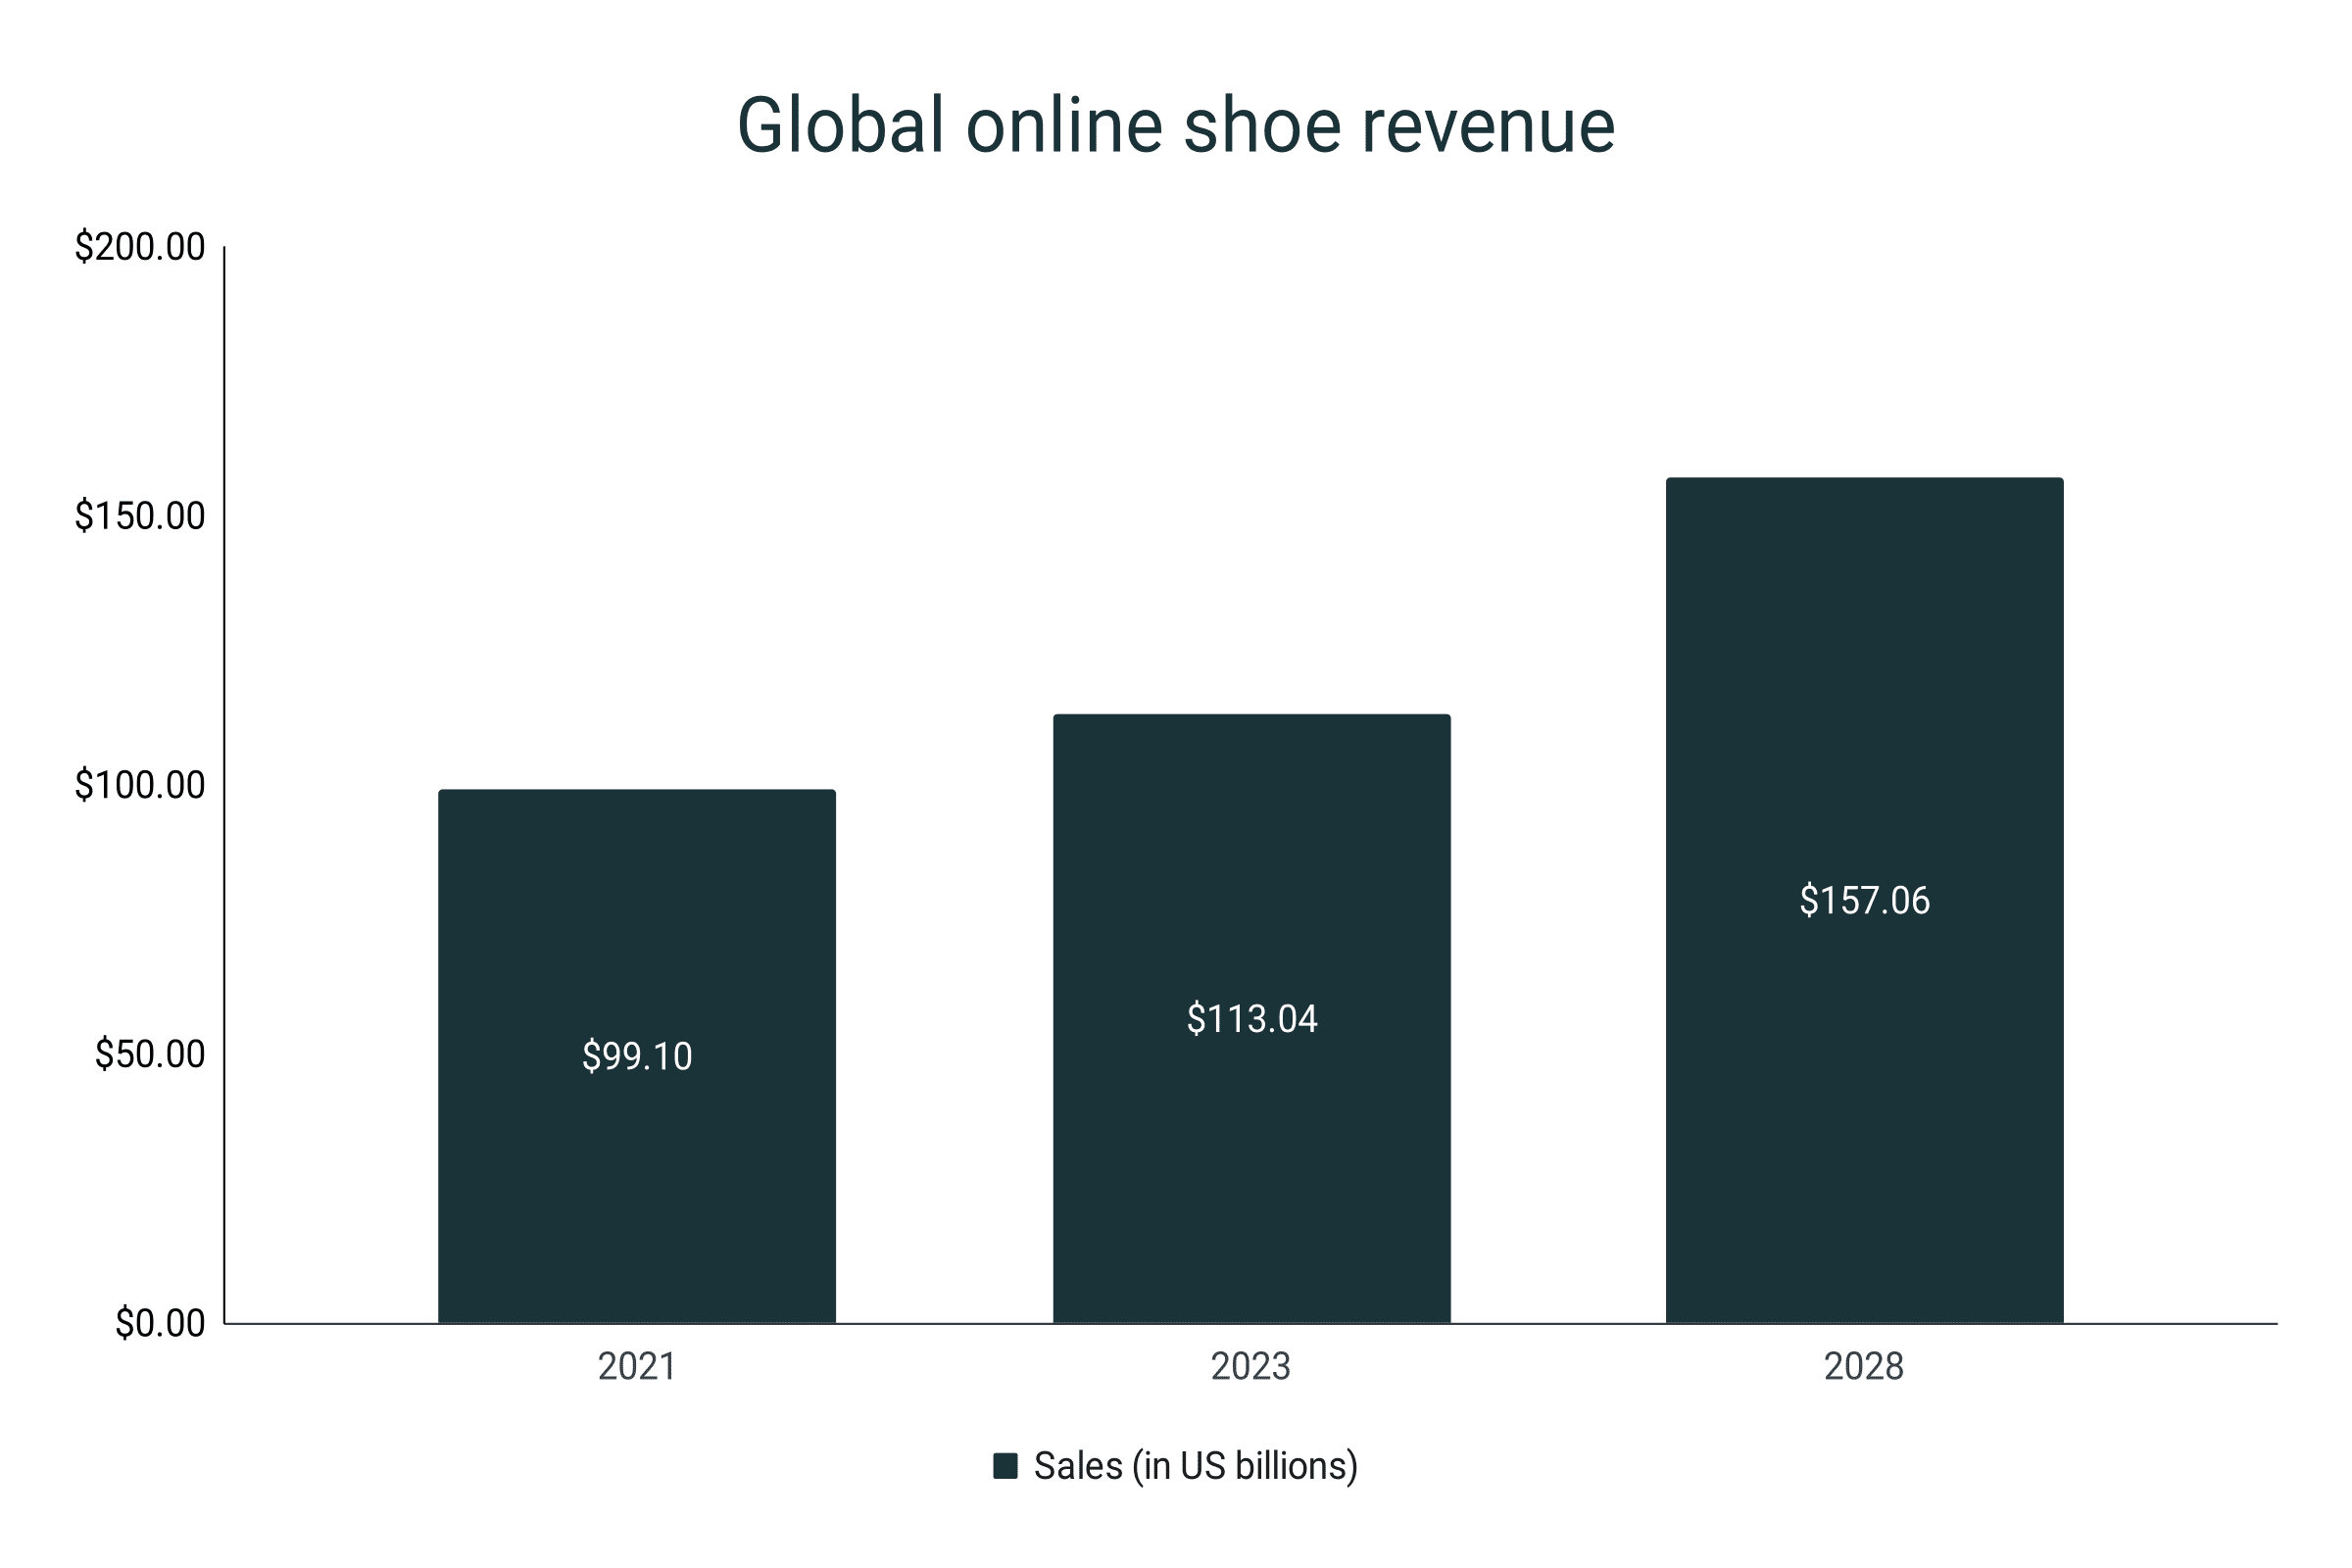
Global online shoe revenue
- As of 2023, global online shoe sales sit at $113.04 billion.
- These numbers are forecasted to grow at a CAGR of 6.8% until 2028.
- By the end of the projected period (2022-2028), shoe sales through e-commerce are expected to reach a total of $157.06 billion.
- The estimated 2028 revenue is roughly a 39% sales growth from the 2023 numbers.
- Worldwide online shoe sales back in 2021 almost broke the 100-billion mark at $99.1 billion.
|
Year |
Total revenue (in US billions) |
|
2021 |
$99.1 |
|
2023 |
$113.04 |
|
2028 |
$157.06 |
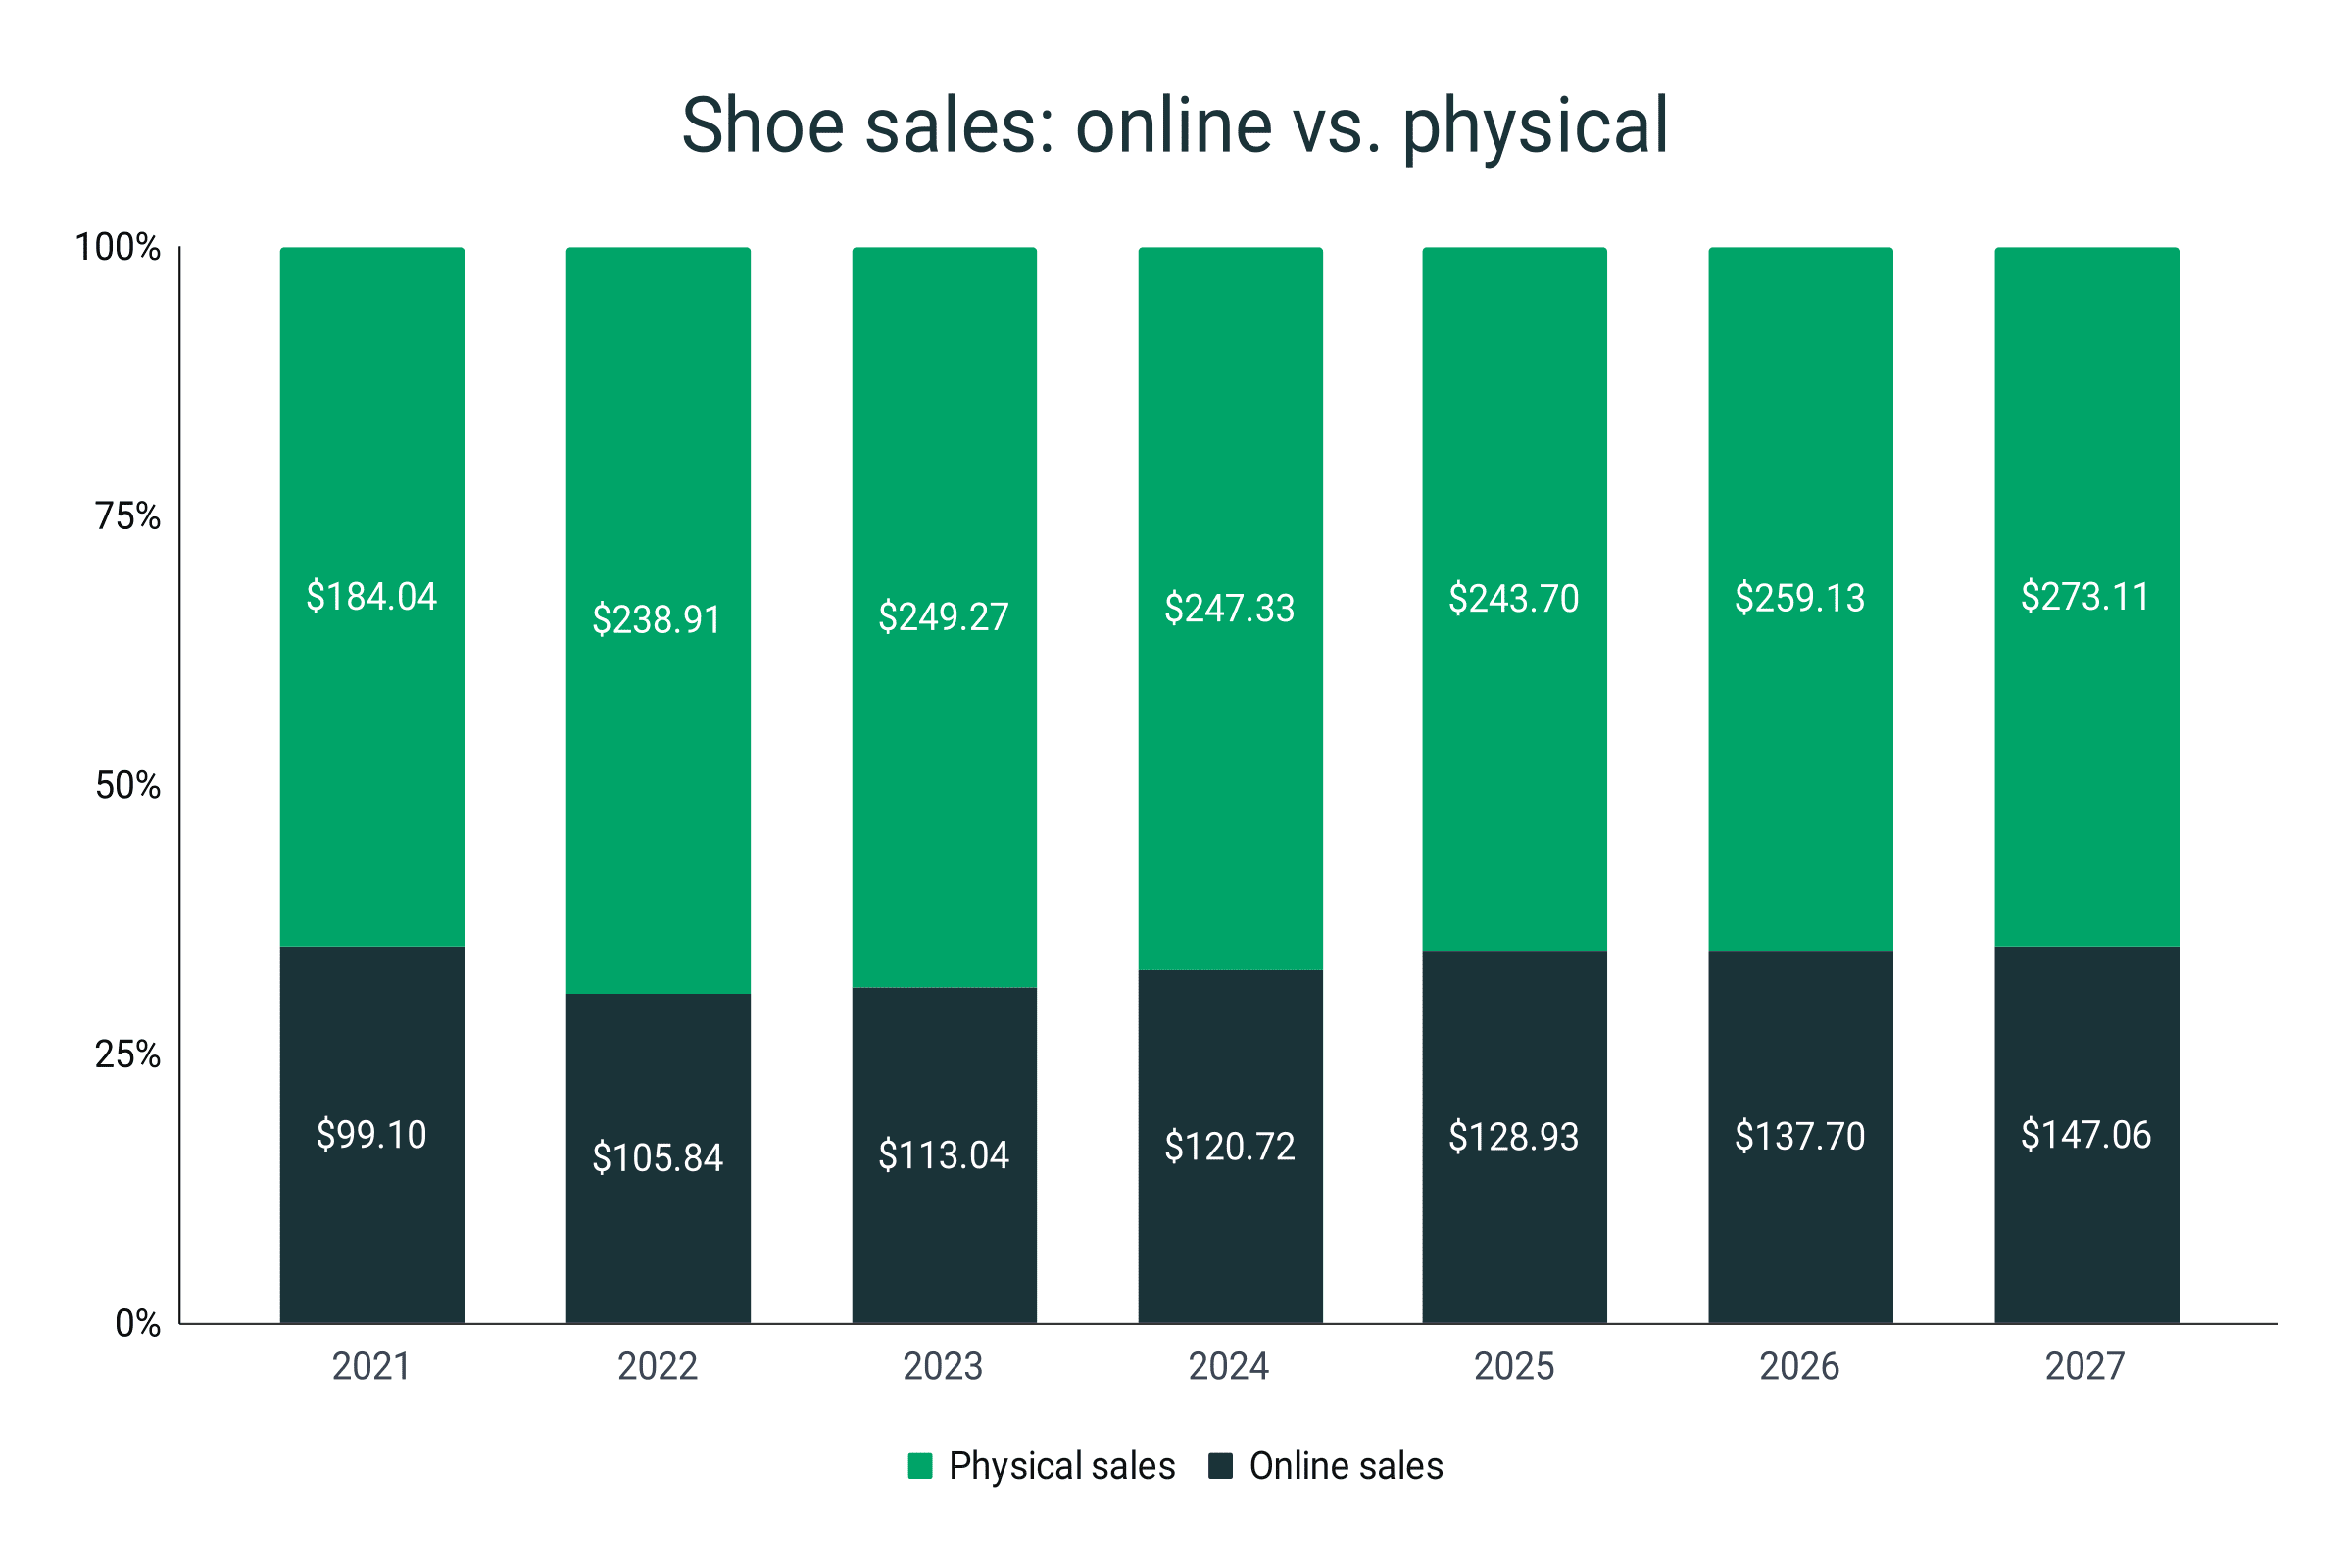
Online shoe sales vs. physical sales
- 31.2% of the 2023 footwear market share belongs to online sales, while physical retail takes 68.8%.
- This means that, as of 2023, physical shoe sales sit at $249.27 billion.
- By 2027, the online shoe market is anticipated to increase to 35%, taking 3.8% from physical retail based on 2023 numbers.
- Back in 2021, online and physical shares were at 35% and 65%, respectively.
- Worldwide footwear sales in the same year reached $283.14 billion, with offline revenue making up $184.04 billion of it.
|
Year |
Online sales (in US billions) |
Physical sales (in US billions) |
|
2021 |
$99.10 |
$184.04 |
|
2022 |
$105.84 |
$238.91 |
|
2023 |
$113.04 |
$249.27 |
|
2024 |
$120.72 |
$247.33 |
|
2025 |
$128.93 |
$243.70 |
|
2026 |
$137.70 |
$259.13 |
|
2027 |
$147.06 |
$273.11 |
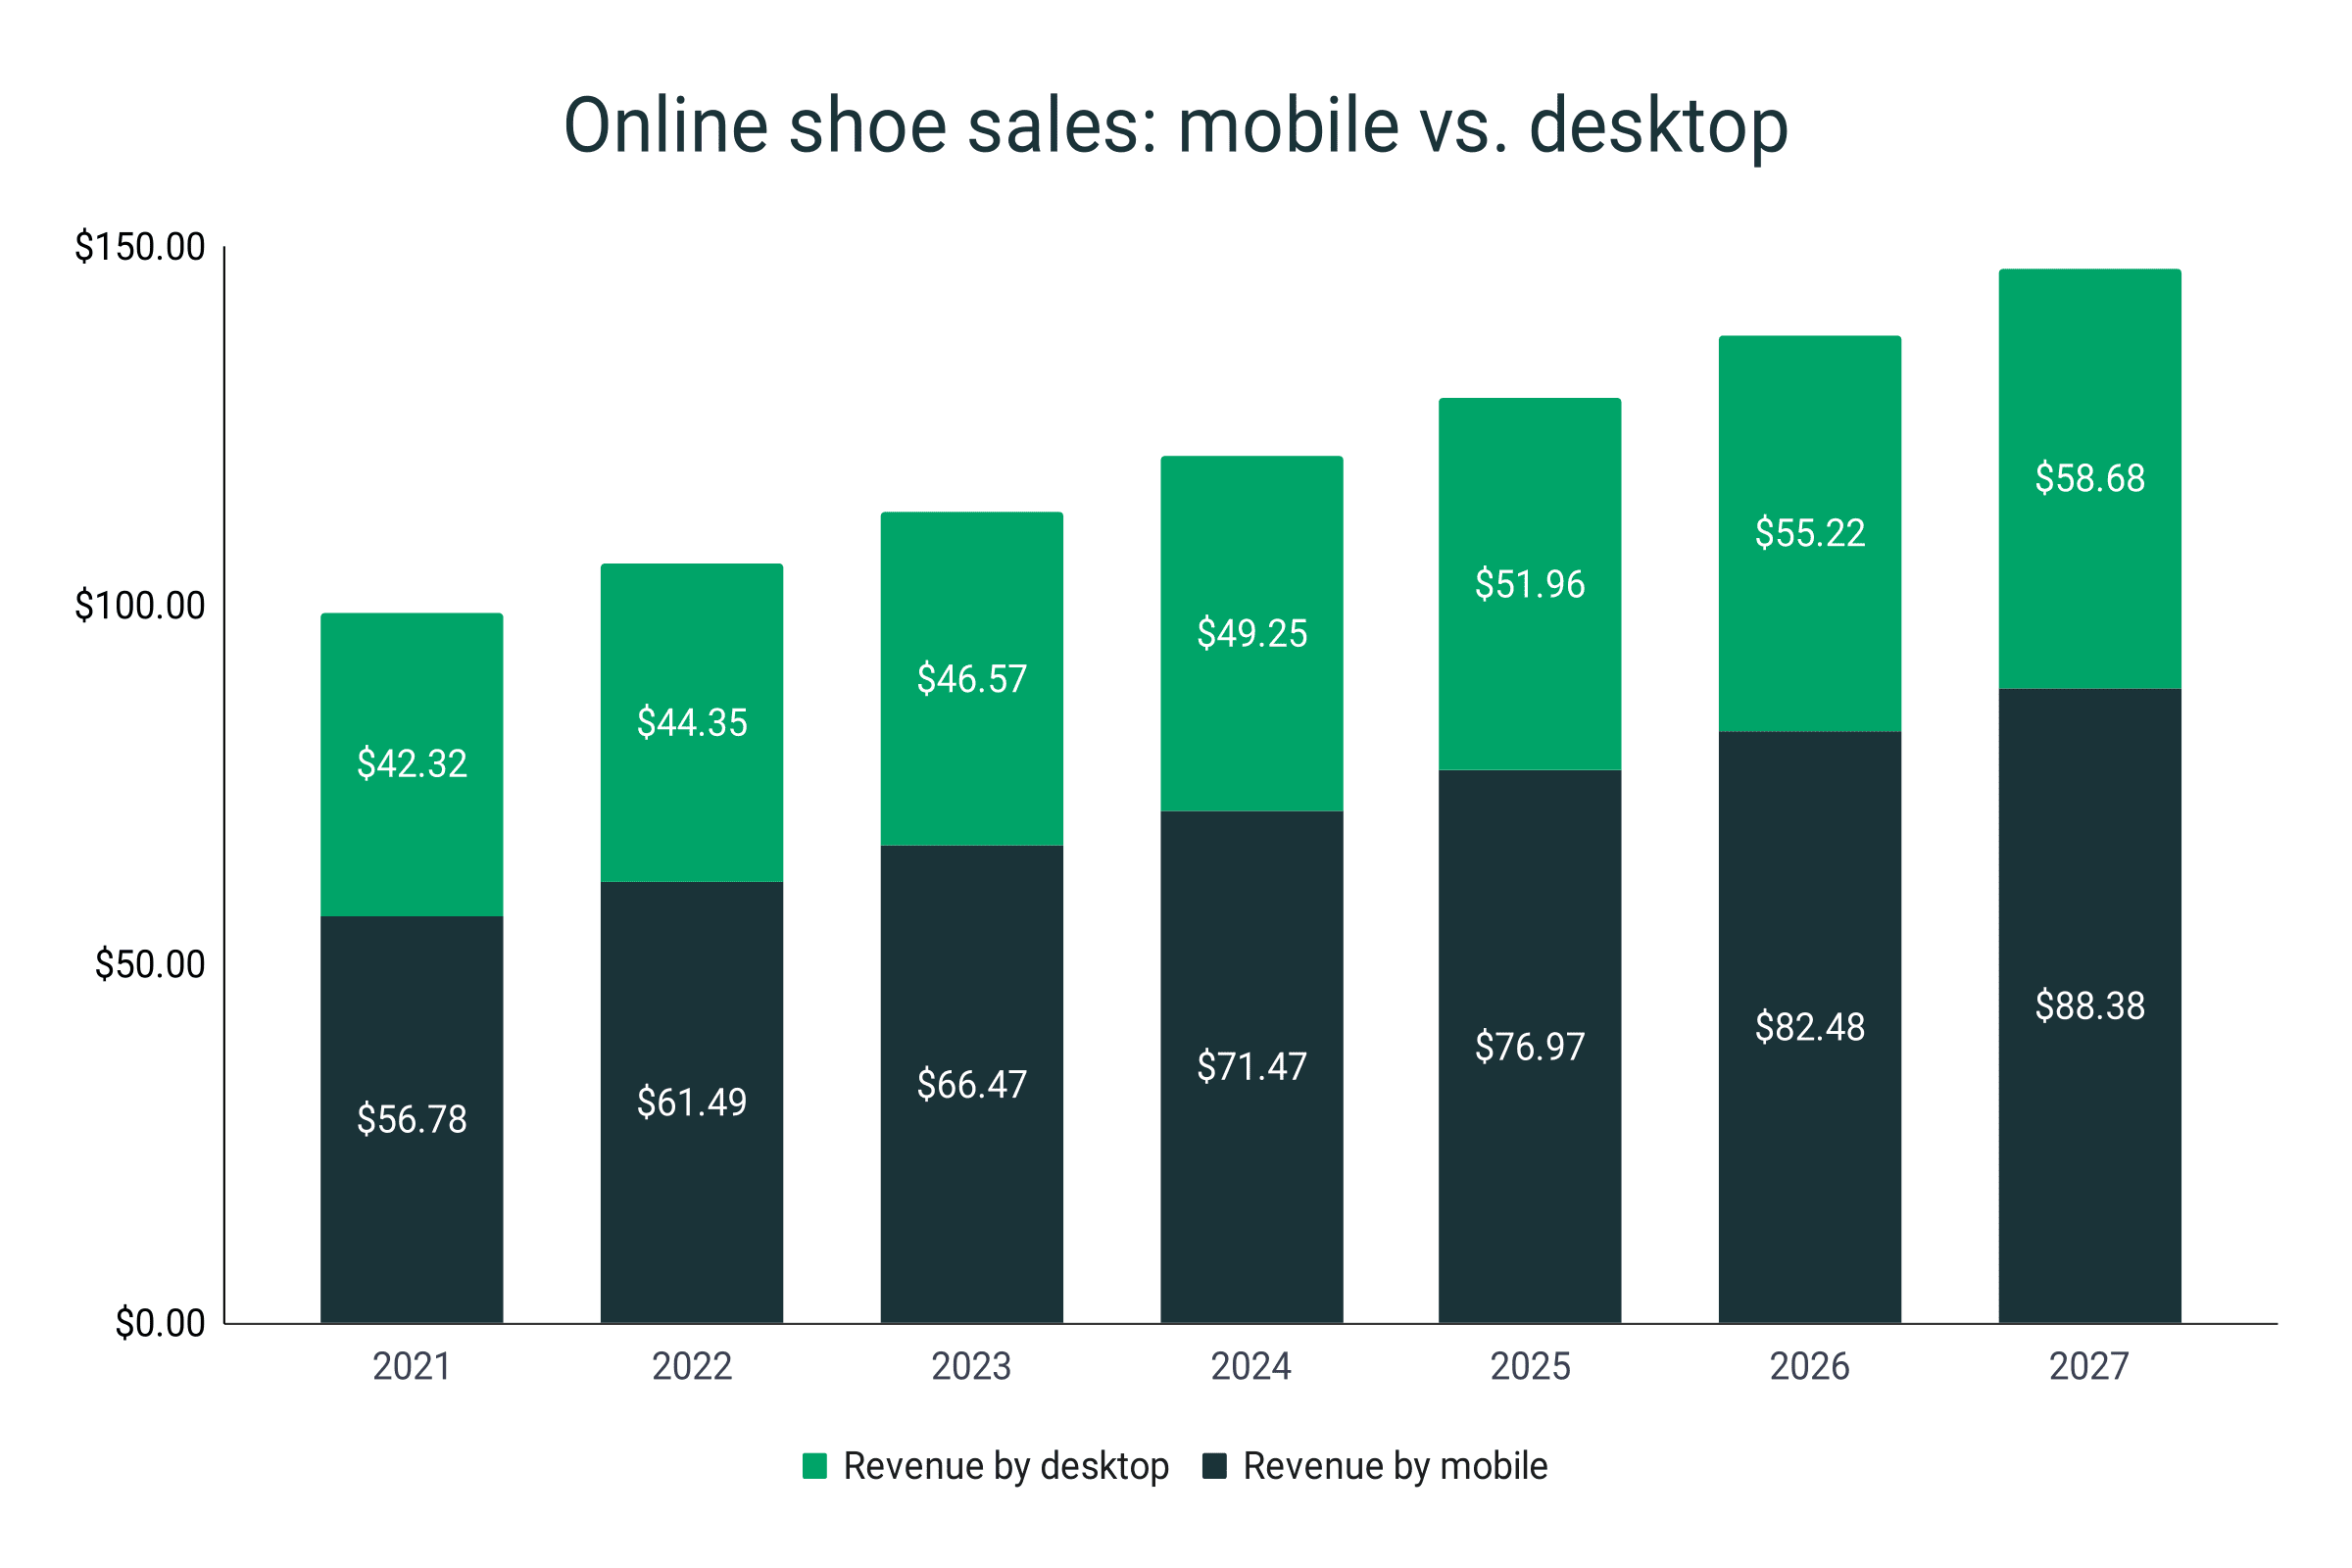
Global footwear e-commerce sales by device
- 58.8% of online shoe sales are expected to be generated via mobile devices as of 2023.
- This percentage is equivalent to $66.47 billion.
- On the other hand, 41.2% of online shoe revenue is expected to be earned through desktop computers, which amounts to $46.57 billion.
- By the end of the 2017-2027 prediction period, sales of shoes by mobile are anticipated to reach $88.38 billion or 60.1% of the market share.
- In the same forecasted year, footwear revenue via desktop is estimated to take 39.9% of the market share or $58.68 billion in sales.
- That’s a 1.3% desktop share drop from the 2023 percentage.
|
Year |
Sales by mobile (in US billions) |
Sales by desktop (in US billions) |
|
2021 |
$56.78 |
$42.32 |
|
2022 |
$61.49 |
$44.35 |
|
2023 |
$66.47 |
$46.57 |
|
2024 |
$71.47 |
$49.25 |
|
2025 |
$76.97 |
$51.96 |
|
2026 |
$82.48 |
$55.22 |
|
2027 |
$88.38 |
$58.68 |
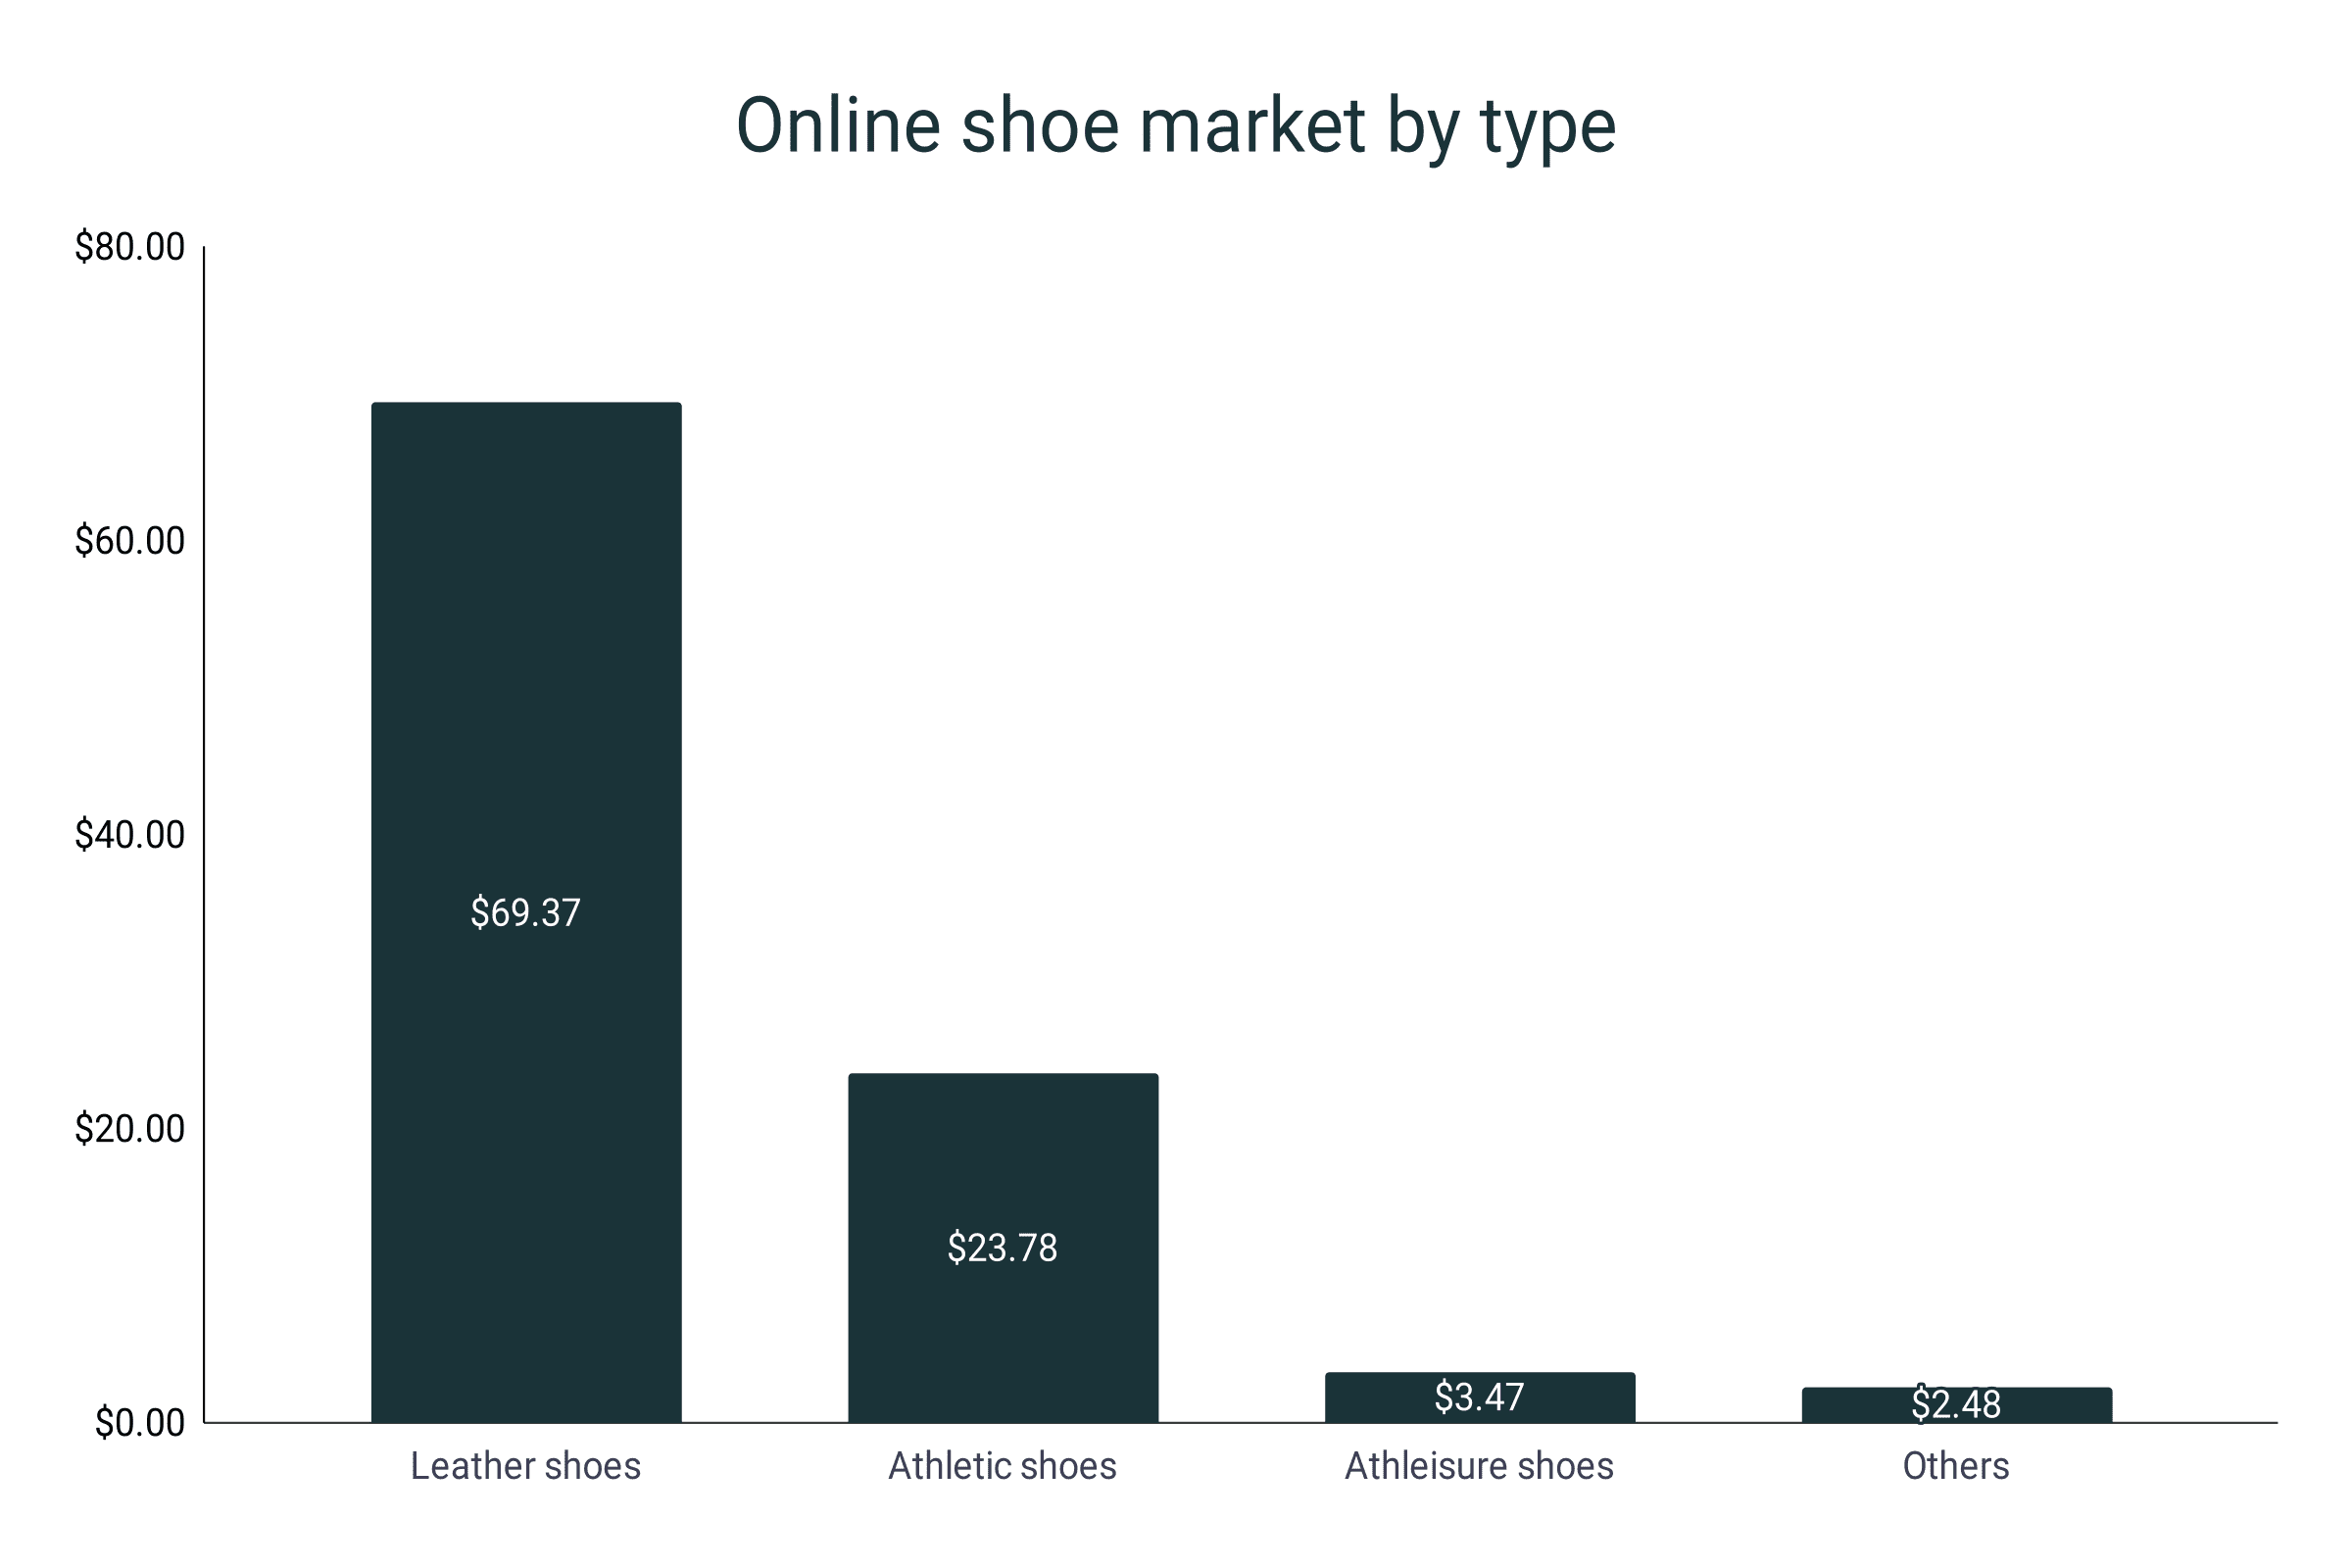
Online shoe market by type
- As of 2021, leather shoes bought online had a market share of 70%, bagging sales of $69.37 billion.
- Roughly 24% went to athletic footwear, with online revenue reaching $23.78 billion.
- In the same year, athleisure shoes generated $3.47 billion in revenue.
- This figure netted the type 3.5% market share.
- Other footwear types made up the remaining 2.5% market share, reaching e-commerce sales of $2.48 billion.
|
Footwear type |
Sales (in US billions) |
|
Leather shoes |
$69.37 |
|
Athletic shoes |
$23.78 |
|
Athleisure shoes |
$3.47 |
|
Others |
$2.48 |
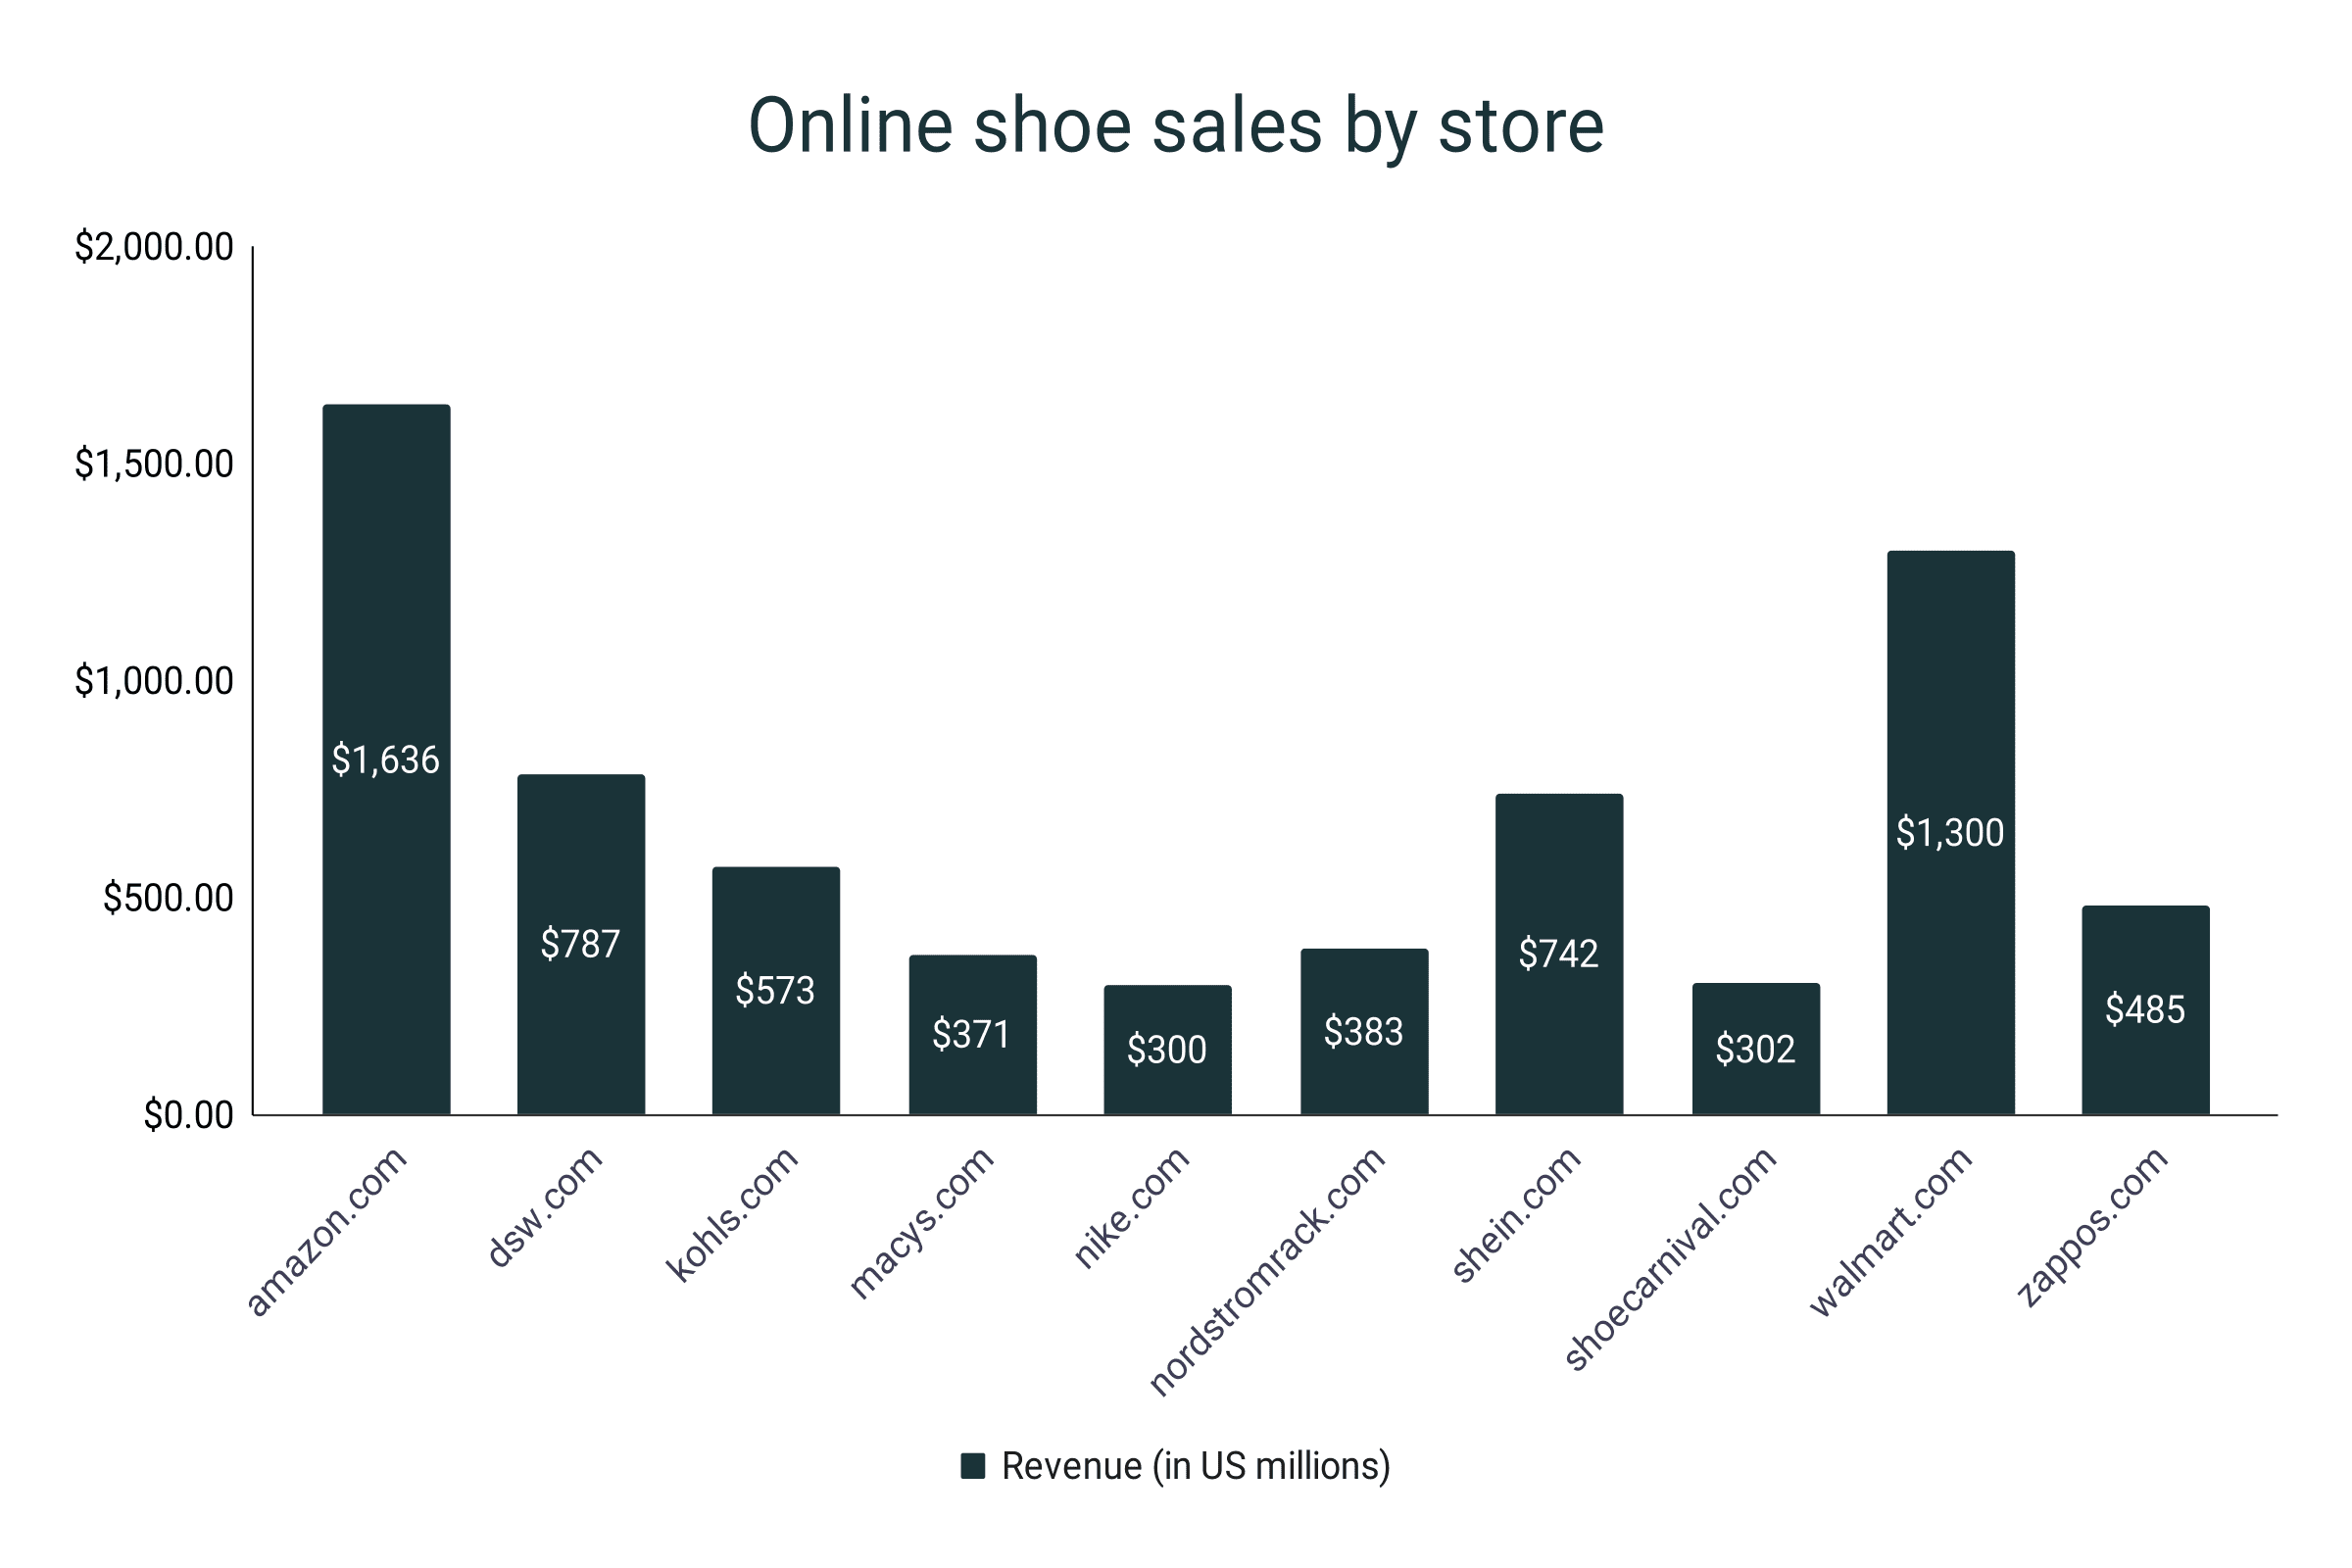
E-commerce footwear sales by online store
- Amazon.com led in this segment as of 2021 with net sales of $1,636 million.
- This figure was about 1.6% of the global online shoe sales in the same year.
- $1,300 million worth of revenue was secured by walmart.com in the same year.
- In third place was dsw.com with $787 million.
- Zappos.com couldn’t break the half-a-billion mark, ending up with online shoe sales of only $485 million.
- Nike.com came in last with $300 million in online footwear revenue.
|
Online store |
Revenue (in US millions) |
|
amazon.com |
$1,636 |
|
dsw.com |
$787 |
|
kohls.com |
$573 |
|
macys.com |
$371 |
|
nike.com |
$300 |
|
nordstromrack.com |
$383 |
|
shein.com |
$742 |
|
shoecarnival.com |
$302 |
|
walmart.com |
$1,300 |
|
zappos.com |
$485 |
Online shoe buying intent and confidence stats
- As of 2023, 63% of shoppers expect to buy footwear online in the coming holiday season.
- 30% of consumers are willing to purchase more than one pair of shoes through e-commerce, with all of them intending to return shoes that don’t give an exact fit.
- About 20% of purchasers aren’t very confident with the fit of the shoes they buy online.
- 57% of online shoppers experienced having to return ill-fitting shoes
- Roughly 10% of footwear buyers are quite confident with the fit of the shoes they purchase online.
- Over 80% of shoppers would be emboldened to buy footwear via e-commerce if they had access to a technology that can give them pin-point fit accuracy.
Sources
E-commerce Footwear Market Size | Global Report, 2028 (grandviewresearch.com)
Global footwear e-commerce sales distribution by device 2027 | Statista
Top Footwear online stores United States 2021 | Statista
Footwear - Worldwide | Statista Market Forecast
Research Shows More Shoppers Buying Footwear Online – WWD