NBA revenue statistics (2001-2022)
NBA has become the fastest-growing sport in North America over the last few years. The league's revenue has been steadily increasing until the Covid outbreak when the league closed the arenas and lost a huge portion of the revenue stream.
We analyzed NBA revenue data over the last 20 seasons and now presenting you 66 stats on how NBA generates money.
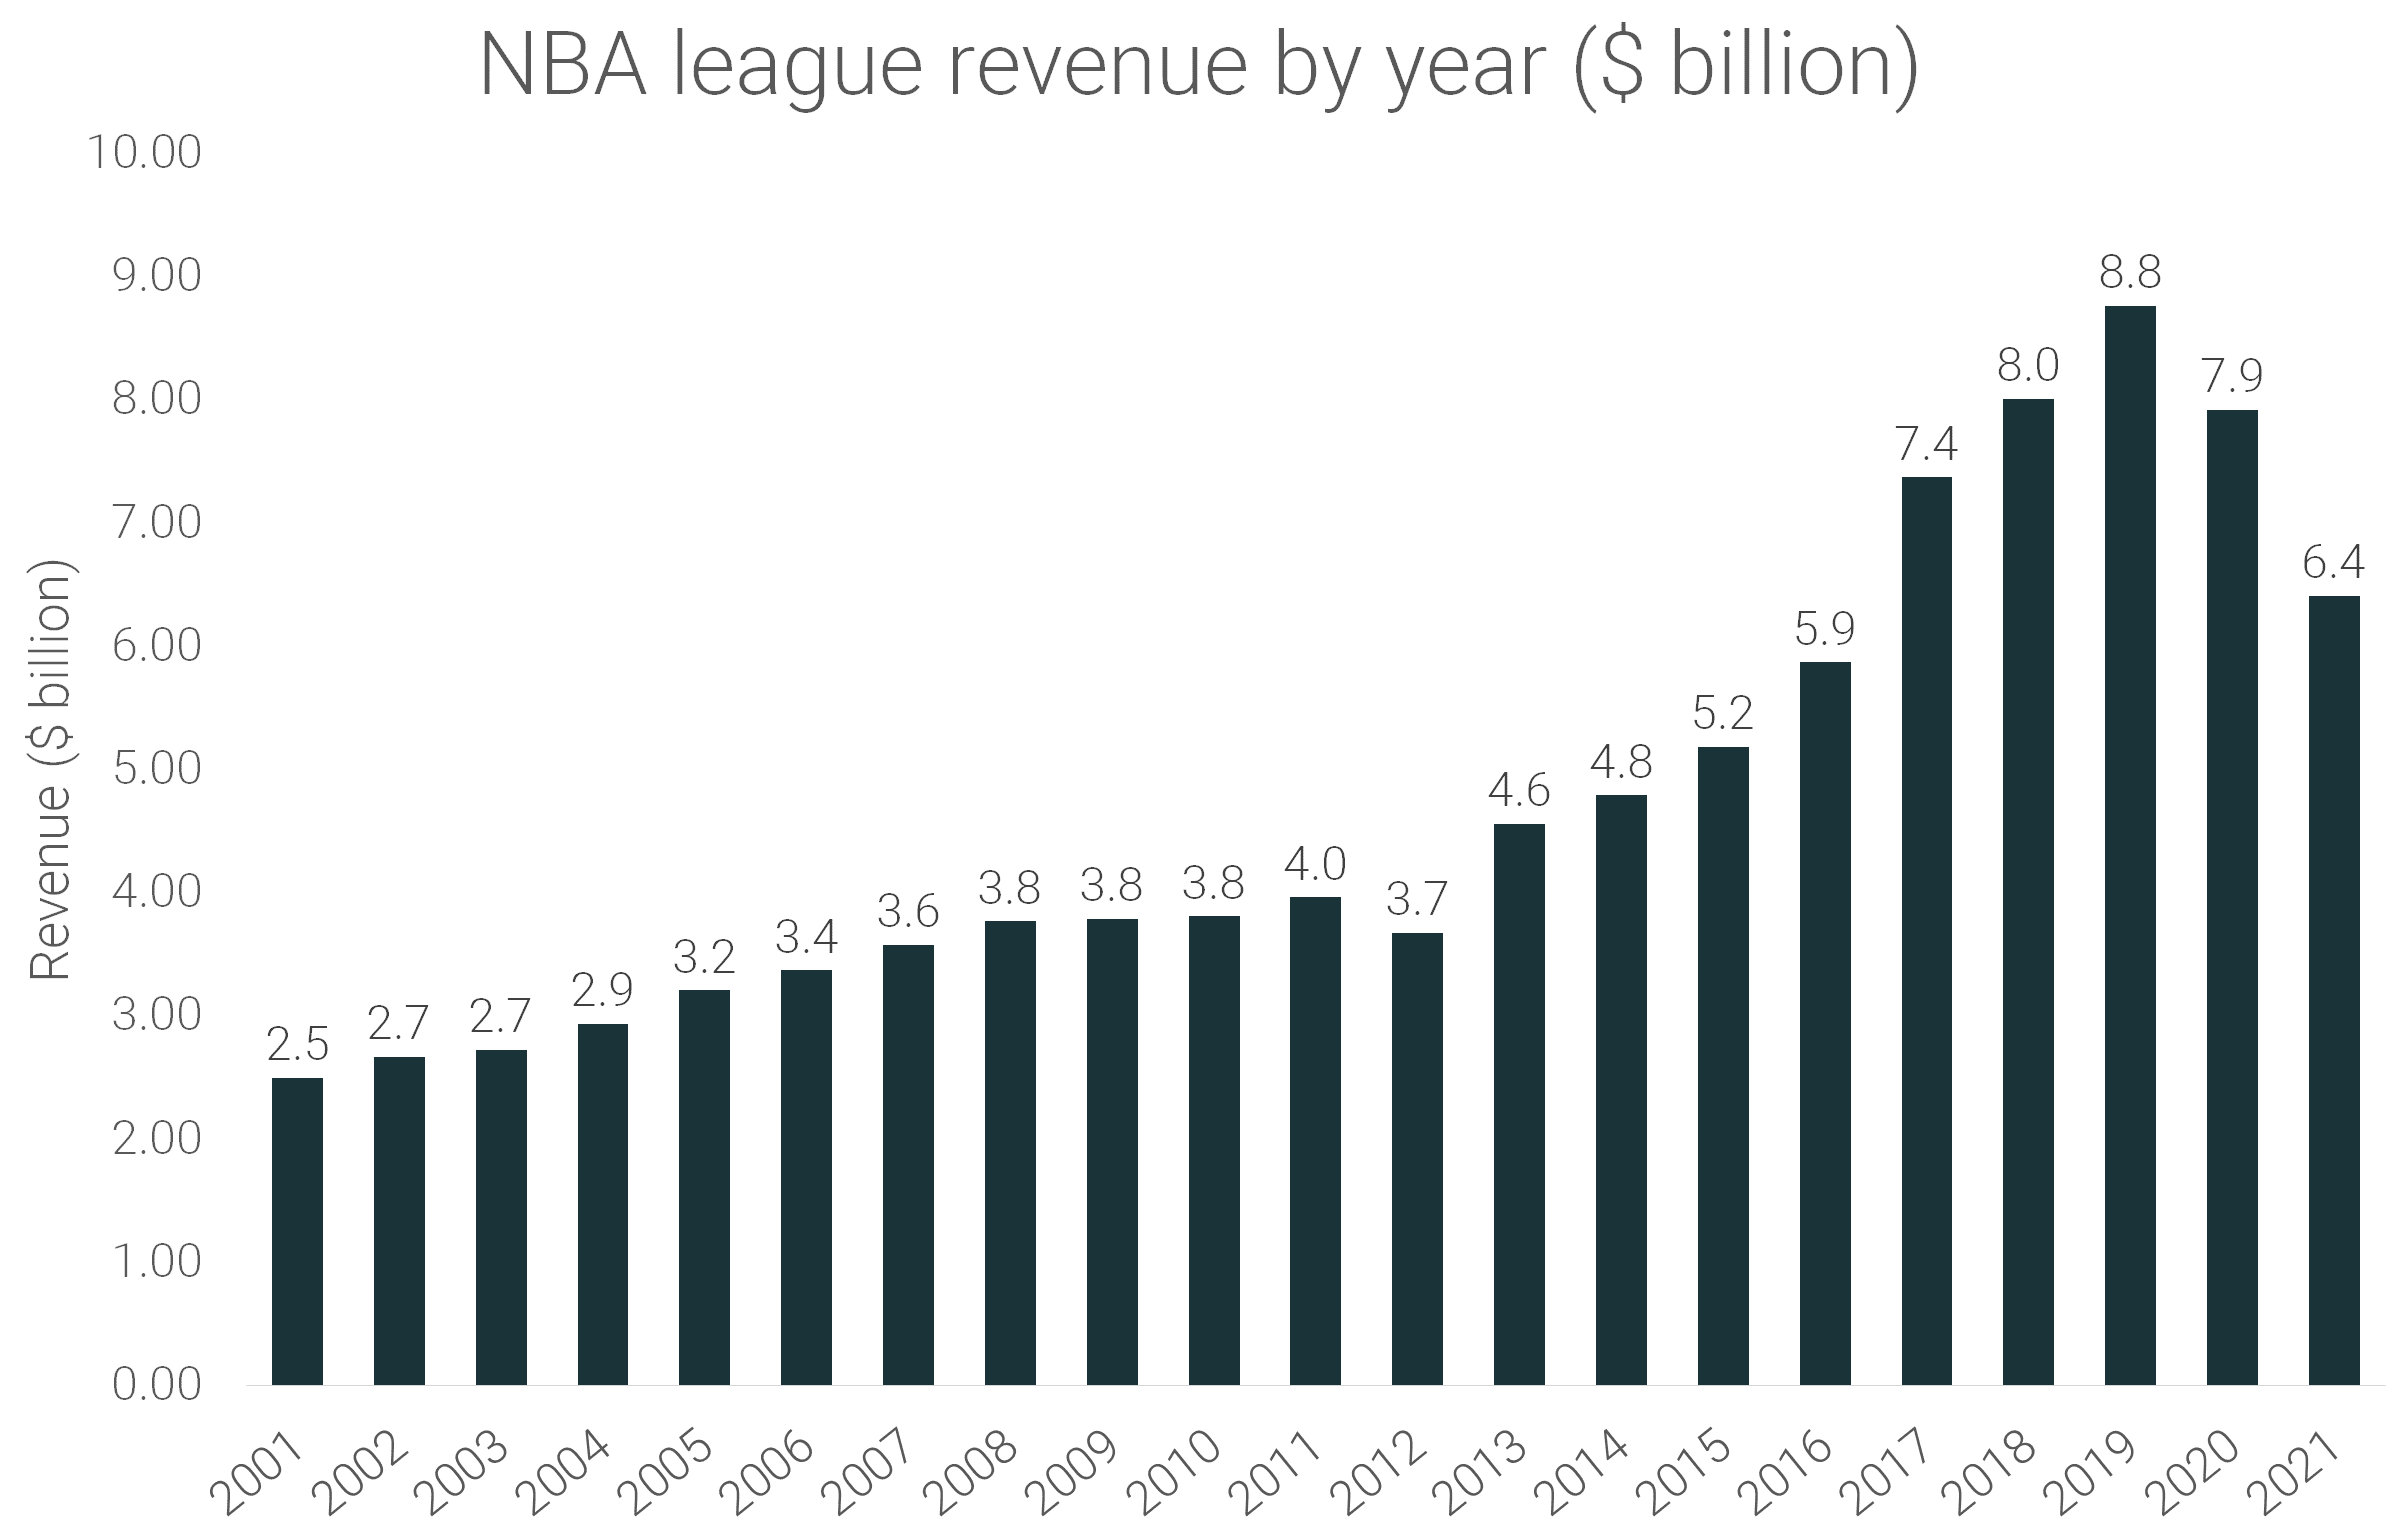
NBA revenue by year
- The revenue of 30 NBA teams in 2021 stands at $6.41 billion.
- This is a 19% decrease from 2020, and the second year in a row with a decrease in revenue, after dropping by 10% in 2020.
- During the first decade of the 21st century, the league revenue had an average year-by-year growth of 5%. Every season had positive growth.
- From the 2010/11 season, the league's revenue has been growing at an average rate of 8%. However, 3 seasons faced negative revenue growth, including the 2020/21 season.
- 2020/21 season projections indicate that the league could face a 40% drop in revenue due to empty arenas.
- The largest revenue increase was 26%, in the 2016/17 season.
- The largest drop in revenue occurred during the 2020/21 season, with a 19% yearly decrease.
NBA revenue by team
- The average revenue of an NBA franchise was $213.5 million in the 2020/21 season.
- This is a 19% drop from the season before ($264 million).
- Utah Jazz are the only team that had an increase in revenue in the 2019/20 season, with a 16% rise.
- Golden State Warriors faced the largest drop in revenue in 2021 with 46%.
- 22 out of 30 NBA franchises faced the largest revenue drop over the last 20 seasons.
- The Warriors are a franchise with the largest average revenue growth in the 21st century, with an 8.5% yearly increase over 20 seasons.
- The Chicago Bulls had the slowest average annual growth since 2000, with a 3.6% increase annually.
|
2011 |
2012 |
2013 |
2014 |
2015 |
2016 |
2017 |
2018 |
2019 |
2020 |
2021 |
|
|
Atlanta Hawks |
$109 |
$99 |
$119 |
$133 |
$142 |
$169 |
$209 |
$215 |
$251 |
$222 |
$199 |
|
Boston Celtics |
$146 |
$143 |
$169 |
$173 |
$181 |
$200 |
$257 |
$287 |
$304 |
$274 |
$211 |
|
Brooklyn Nets |
$89 |
$84 |
$190 |
$212 |
$220 |
$223 |
$273 |
$290 |
$304 |
$280 |
$212 |
|
Charlotte Hornets |
$101 |
$93 |
$115 |
$130 |
$142 |
$158 |
$202 |
$213 |
$240 |
$215 |
$183 |
|
Chicago Bulls |
$185 |
$162 |
$195 |
$201 |
$228 |
$232 |
$281 |
$287 |
$301 |
$300 |
$213 |
|
Cleveland Cavaliers |
$149 |
$128 |
$145 |
$149 |
$191 |
$233 |
$280 |
$302 |
$300 |
$269 |
$211 |
|
Dallas Mavericks |
$166 |
$137 |
$162 |
$168 |
$177 |
$194 |
$233 |
$287 |
$307 |
$295 |
$231 |
|
Denver Nuggets |
$113 |
$110 |
$124 |
$136 |
$140 |
$157 |
$202 |
$222 |
$252 |
$218 |
$185 |
|
Detroit Pistons |
$141 |
$125 |
$139 |
$144 |
$154 |
$172 |
$221 |
$235 |
$255 |
$227 |
$192 |
|
Golden State Warriors |
$139 |
$127 |
$160 |
$168 |
$201 |
$305 |
$359 |
$401 |
$440 |
$474 |
$258 |
|
Houston Rockets |
$150 |
$135 |
$191 |
$175 |
$237 |
$244 |
$296 |
$326 |
$348 |
$308 |
$223 |
|
Indiana Pacers |
$101 |
$98 |
$121 |
$139 |
$138 |
$157 |
$205 |
$222 |
$243 |
$217 |
$179 |
|
Los Angeles Clippers |
$108 |
$108 |
$128 |
$146 |
$176 |
$185 |
$257 |
$258 |
$282 |
$262 |
$219 |
|
Los Angeles Lakers |
$208 |
$197 |
$295 |
$293 |
$304 |
$333 |
$371 |
$395 |
$434 |
$400 |
$316 |
|
Memphis Grizzlies |
$99 |
$96 |
$126 |
$135 |
$147 |
$155 |
$206 |
$213 |
$224 |
$210 |
$186 |
|
Miami Heat |
$158 |
$150 |
$188 |
$188 |
$180 |
$210 |
$253 |
$259 |
$294 |
$266 |
$218 |
|
Milwaukee Bucks |
$92 |
$78 |
$109 |
$110 |
$126 |
$146 |
$179 |
$204 |
$283 |
$239 |
$212 |
|
Minnesota Timberwolves |
$97 |
$96 |
$116 |
$128 |
$146 |
$154 |
$204 |
$223 |
$234 |
$214 |
$199 |
|
New Orleans Pelicans |
$109 |
$100 |
$116 |
$131 |
$142 |
$156 |
$204 |
$214 |
$224 |
$209 |
$181 |
|
New York Knicks |
$244 |
$243 |
$287 |
$278 |
$307 |
$376 |
$426 |
$443 |
$472 |
$421 |
$298 |
|
Oklahoma City Thunder |
$126 |
$127 |
$144 |
$152 |
$157 |
$187 |
$222 |
$241 |
$258 |
$236 |
$183 |
|
Orlando Magic |
$140 |
$126 |
$139 |
$143 |
$143 |
$166 |
$211 |
$223 |
$244 |
$218 |
$188 |
|
Philadelphia 76ers |
$116 |
$107 |
$117 |
$125 |
$124 |
$140 |
$184 |
$268 |
$300 |
$259 |
$236 |
|
Phoenix Suns |
$136 |
$121 |
$137 |
$145 |
$154 |
$173 |
$218 |
$235 |
$246 |
$222 |
$206 |
|
Portland Trail Blazers |
$132 |
$117 |
$140 |
$153 |
$157 |
$178 |
$223 |
$246 |
$287 |
$240 |
$201 |
|
Sacramento Kings |
$104 |
$96 |
$115 |
$125 |
$141 |
$164 |
$240 |
$263 |
$286 |
$245 |
$192 |
|
San Antonio Spurs |
$139 |
$135 |
$167 |
$172 |
$170 |
$187 |
$259 |
$262 |
$285 |
$255 |
$205 |
|
Toronto Raptors |
$134 |
$121 |
$149 |
$151 |
$163 |
$193 |
$250 |
$275 |
$334 |
$264 |
$194 |
|
Utah Jazz |
$120 |
$111 |
$131 |
$142 |
$146 |
$164 |
$221 |
$243 |
$258 |
$226 |
$262 |
|
Washington Wizards |
$109 |
$102 |
$122 |
$143 |
$146 |
$155 |
$222 |
$255 |
$269 |
$231 |
$213 |
|
Average |
$132 |
$122 |
$152 |
$160 |
$173 |
$196 |
$246 |
$267 |
$292 |
$264 |
$214 |
|
Total |
$3,960 |
$3,672 |
$4,556 |
$4,788 |
$5,180 |
$5,866 |
$7,368 |
$8,007 |
$8,759 |
$7,916 |
$6,406 |
NBA tickets revenue stats
Average ticket price in the NBA
- The average ticket price in the NBA was $78.7 for the 2020/21 season. This was a 0.4% increase from the season before.
- The average price of NBA game tickets grew 50% over the last 10 seasons.
- The Lost Angeles Lakers and Golden State Warriors have the most expensive tickets in the NBA, with the average price going to $150.
- The Memphis Grizzlies have the lowest ticket price in the NBA at $35.
NBA ticket revenue by season
- The NBA generated $46.41 million in ticket sales during the 2020/21 campaign.
- This is a 97% decrease compared to the 2019/20 season, and the second season in a row with a drop in ticket revenue since the lockout-shortened 2011/12 season.
- The average NBA team generated $1.76 million in tickets sales in 2021.
- Golden State Warriors earned the most from the ticket sales, $7.78 million in 2021.
|
2011 |
2012 |
2013 |
2014 |
2015 |
2016 |
2017 |
2018 |
2019 |
2020 |
2021 | |
|
Atlanta Hawks |
$26.3 |
$20.1 |
$23.6 |
$22.9 |
$27.8 |
$28.3 |
$27.5 |
$29.5 |
$45.3 |
$32.7 |
$1.55 |
|
Boston Celtics |
$52.7 |
$42.4 |
$54.4 |
$54.2 |
$51.2 |
$49.4 |
$64.7 |
$63.3 |
$72.5 |
$64.1 |
$0.72 |
|
Brooklyn Nets |
$23.3 |
$17.1 |
$39.5 |
$42.4 |
$46.1 |
$40.9 |
$47.5 |
$48.5 |
$55.1 |
$52.5 |
$1.45 |
|
Charlotte Hornets |
$19.5 |
$14.1 |
$18.2 |
$18.5 |
$21.9 |
$22.2 |
$23.5 |
$24.8 |
$23.7 |
$17.2 |
$0.50 |
|
Chicago Bulls |
$59.0 |
$49.7 |
$64.6 |
$69.5 |
$71.8 |
$73.4 |
$72.9 |
$69.9 |
$70.0 |
$63.9 |
$0.00 |
|
Cleveland Cavaliers |
$42.9 |
$25.8 |
$31.2 |
$30.6 |
$37.9 |
$40.5 |
$48.1 |
$50.6 |
$67.4 |
$46.8 |
$3.81 |
|
Dallas Mavericks |
$42.9 |
$32.9 |
$42.7 |
$42.5 |
$43.0 |
$43.0 |
$42.2 |
$43.0 |
$57.4 |
$55.3 |
$2.82 |
|
Denver Nuggets |
$32.6 |
$26.4 |
$37.3 |
$34.6 |
$30.1 |
$28.3 |
$29.7 |
$36.6 |
$41.6 |
$36.7 |
$0.64 |
|
Detroit Pistons |
$28.0 |
$19.5 |
$24.2 |
$24.6 |
$24.4 |
$21.7 |
$45.2 |
$35.7 |
$35.8 |
$28.0 |
$0.29 |
|
Golden State Warriors |
$26.1 |
$21.2 |
$28.6 |
$35.4 |
$41.8 |
$64.3 |
$77.9 |
$92.4 |
$100.4 |
$92.1 |
$0.00 |
|
Houston Rockets |
$33.2 |
$24.8 |
$31.4 |
$42.4 |
$49.3 |
$49.4 |
$47.3 |
$51.6 |
$66.6 |
$56.7 |
$7.78 |
|
Indiana Pacers |
$17.2 |
$14.5 |
$20.0 |
$23.0 |
$22.8 |
$26.9 |
$27.4 |
$26.3 |
$34.5 |
$30.2 |
$0.00 |
|
Los Angeles Clippers |
$36.4 |
$32.4 |
$49.7 |
$55.1 |
$64.4 |
$65.3 |
$70.4 |
$62.8 |
$63.9 |
$55.5 |
$0.00 |
|
Los Angeles Lakers |
$89.6 |
$75.2 |
$97.4 |
$98.8 |
$98.3 |
$100.5 |
$101.0 |
$104.8 |
$116.8 |
$88.3 |
$0.00 |
|
Memphis Grizzlies |
$15.0 |
$13.0 |
$19.8 |
$20.6 |
$22.0 |
$21.2 |
$22.4 |
$22.9 |
$21.3 |
$17.8 |
$1.19 |
|
Miami Heat |
$48.7 |
$44.1 |
$59.0 |
$63.3 |
$63.0 |
$62.3 |
$62.0 |
$66.8 |
$75.7 |
$50.4 |
$0.00 |
|
Milwaukee Bucks |
$26.5 |
$20.4 |
$28.4 |
$24.9 |
$29.3 |
$30.5 |
$33.8 |
$37.7 |
$46.9 |
$41.2 |
$2.15 |
|
Minnesota Timberwolves |
$20.0 |
$18.5 |
$23.5 |
$21.5 |
$22.0 |
$21.5 |
$24.3 |
$31.5 |
$29.5 |
$22.2 |
$0.07 |
|
New Orleans Pelicans |
$20.5 |
$17.0 |
$18.7 |
$20.2 |
$22.6 |
$22.7 |
$23.9 |
$27.0 |
$27.6 |
$21.1 |
$2.39 |
|
New York Knicks |
$72.8 |
$77.6 |
$97.5 |
$105.6 |
$105.6 |
$105.6 |
$105.4 |
$103.0 |
$109.1 |
$86.9 |
$2.63 |
|
Oklahoma City Thunder |
$37.2 |
$30.6 |
$38.1 |
$41.1 |
$41.1 |
$41.1 |
$46.3 |
$52.2 |
$52.2 |
$43.3 |
$0.00 |
|
Orlando Magic |
$42.8 |
$34.9 |
$31.7 |
$28.0 |
$28.9 |
$30.2 |
$30.6 |
$30.1 |
$36.0 |
$29.1 |
$4.92 |
|
Philadelphia 76ers |
$24.8 |
$22.5 |
$26.7 |
$22.2 |
$22.3 |
$23.2 |
$27.0 |
$43.3 |
$58.7 |
$46.7 |
$1.42 |
|
Phoenix Suns |
$46.8 |
$31.9 |
$36.7 |
$37.1 |
$38.9 |
$39.3 |
$39.7 |
$39.1 |
$37.0 |
$32.5 |
$2.75 |
|
Portland Trail Blazers |
$45.4 |
$32.5 |
$39.0 |
$41.3 |
$42.5 |
$42.1 |
$42.0 |
$46.1 |
$52.8 |
$42.6 |
$0.00 |
|
Sacramento Kings |
$29.6 |
$23.0 |
$24.2 |
$28.7 |
$31.3 |
$34.0 |
$54.1 |
$48.7 |
$56.1 |
$46.3 |
$0.00 |
|
San Antonio Spurs |
$39.8 |
$33.4 |
$42.3 |
$41.5 |
$45.0 |
$41.6 |
$49.1 |
$56.6 |
$56.3 |
$41.3 |
$2.37 |
|
Toronto Raptors |
$42.1 |
$31.7 |
$40.9 |
$43.4 |
$43.7 |
$43.9 |
$52.9 |
$52.9 |
$63.4 |
$53.2 |
$1.62 |
|
Utah Jazz |
$32.8 |
$26.8 |
$33.7 |
$33.5 |
$33.2 |
$34.0 |
$35.5 |
$32.3 |
$42.0 |
$35.8 |
$5.33 |
|
Washington Wizards |
$23.4 |
$18.8 |
$23.5 |
$23.0 |
$26.2 |
$34.8 |
$55.1 |
$56.8 |
$60.9 |
$42.6 |
$0.00 |
|
Average |
$36.6 |
$29.8 |
$38.2 |
$39.7 |
$41.6 |
$42.7 |
$47.6 |
$49.6 |
$55.9 |
$45.8 |
|
|
Total |
$1,098 |
$892 |
$1,146 |
$1,190 |
$1,249 |
$1,282 |
$1,429 |
$1,487 |
$1,677 |
$1,373 |
Operating income of NBA teams
- 30 NBA teams generated $738 million in operating income for the 2020/21 season
- This is a 60% drop compared to the previous season, and the largest income drop over the last 10 years.
- The average NBA franchise netted $25 million in operating income in 2021.
- Utah Jazz had the largest operating income in 2021, with $96 million.
- The Jazz are followed by the Knicks ($71 million) and the Lakers ($63 million).
- Brooklyn Nets have the lowest operating income in the NBA with a negative $80 million.
- They are followed by the Warriors with -$44 million.
- Over the last 11 years, 12 NBA teams didn't have one year with negative operating income.
- 18 out of 30 NBA franchises had at least one negative income season since 2011.
- Brooklyn Nets had 5 seasons with negative income, most in the league during this period.
- They are followed by the Atlanta Hawks, Cleveland Cavaliers, Minnesota Timberwolves, and Philadelphia 76ers with 4 negative years.
| Year | 2011 | 2012 | 2013 | 2014 | 2015 | 2016 | 2017 | 2018 | 2019 | 2020 | 2021 |
| Atlanta Hawks | -$15 | -$19 | -$4 | $15 | $7 | $20 | $22 | $42 | $78 | $36 | $37 |
| Boston Celtics | $8 | $19 | $47 | $55 | $57 | $65 | $85 | $100 | $88 | $86 | $46 |
| Brooklyn Nets | -$24 | -$17 | -$19 | -$99 | -$6 | $16 | $52 | $53 | $42 | $44 | -$80 |
| Charlotte Hornets | -$26 | -$13 | $7 | $1 | $4 | $9 | $21 | $22 | $39 | $36 | $34 |
| Chicago Bulls | $59 | $34 | $52 | $65 | $68 | $46 | $95 | $114 | $103 | $115 | $39 |
| Cleveland Cavaliers | $33 | $19 | $11 | $21 | $25 | -$40 | -$6 | -$13 | $39 | $46 | $11 |
| Dallas Mavericks | -$4 | $13 | $38 | $30 | $24 | $43 | $21 | $99 | $105 | $84 | $55 |
| Denver Nuggets | -$1 | $12 | $8 | $14 | $26 | $21 | $49 | $47 | $52 | $27 | $15 |
| Detroit Pistons | $10 | $8 | $10 | $18 | $16 | $22 | $22 | $52 | $52 | $45 | $43 |
| Golden State Warriors | $22 | $29 | $43 | $45 | $58 | $74 | $120 | $103 | $109 | $200 | -$44 |
| Houston Rockets | $18 | $27 | $64 | $38 | $75 | $63 | $95 | $103 | $110 | $94 | $33 |
| Indiana Pacers | -$11 | $11 | $12 | $25 | $19 | $24 | $29 | $50 | $55 | $39 | $4 |
| Los Angeles Clippers | $9 | $9 | $15 | $20 | $21 | -$12 | $35 | $43 | $70 | $57 | $18 |
| Los Angeles Lakers | $24 | $48 | $66 | $104 | $133 | $119 | $136 | $147 | $178 | $155 | $63 |
| Memphis Grizzlies | -$25 | -$13 | $11 | $11 | $10 | $0 | $15 | $27 | $24 | $22 | $12 |
| Miami Heat | $26 | $15 | $29 | $13 | $21 | $21 | $63 | $40 | $58 | $38 | $16 |
| Milwaukee Bucks | -$8 | -$1 | $12 | $12 | $12 | $24 | $20 | $25 | $69 | $27 | $11 |
| Minnesota Timberwolves | -$7 | -$5 | -$3 | $7 | $15 | $26 | $53 | $47 | $46 | $32 | $29 |
| New Orleans Pelicans | -$3 | $3 | $11 | $19 | $20 | $17 | $37 | $29 | $49 | $44 | $24 |
| New York Knicks | $75 | $83 | $96 | $53 | $109 | $141 | $140 | $155 | $157 | $178 | $71 |
| Oklahoma City Thunder | $25 | $30 | $33 | $31 | $21 | -$8 | $64 | $10 | -$23 | $51 | $48 |
| Orlando Magic | -$16 | $12 | $12 | $21 | $35 | $45 | $39 | $64 | $70 | $37 | $29 |
| Philadelphia 76ers | -$10 | -$1 | -$4 | $24 | $14 | $18 | $40 | $68 | $90 | $51 | $13 |
| Phoenix Suns | $13 | $13 | $28 | $28 | $22 | $26 | $31 | $47 | $42 | $20 | $15 |
| Portland Trail Blazers | -$8 | -$10 | $30 | $12 | $4 | $41 | $25 | $40 | $51 | $27 | $19 |
| Sacramento Kings | $6 | $3 | $13 | $9 | $4 | $18 | $50 | $72 | $81 | $45 | $25 |
| San Antonio Spurs | $14 | $15 | $39 | $41 | $32 | $18 | $59 | $53 | $66 | $63 | $39 |
| Toronto Raptors | $7 | $19 | $29 | $18 | $23 | $46 | $51 | $76 | $79 | $79 | $2 |
| Utah Jazz | -$16 | $12 | $18 | $33 | $28 | $36 | $61 | $59 | $63 | $42 | $96 |
| Washington Wizards | -$3 | $2 | $7 | $10 | $3 | $7 | $21 | $34 | $55 | $39 | $15 |
| Total | $175 | $357 | $712 | $692 | $900 | $946 | $1,545 | $1,808 | $2,097 | $1,859 | $738 |
| League average | $6 | $12 | $24 | $23 | $30 | $32 | $51 | $60 | $70 | $62 | $25 |
NBA broadcasting revenue
Broadcasting deals present the largest source of revenue for the NBA. The league is currently under the largest media contract in the league's history.
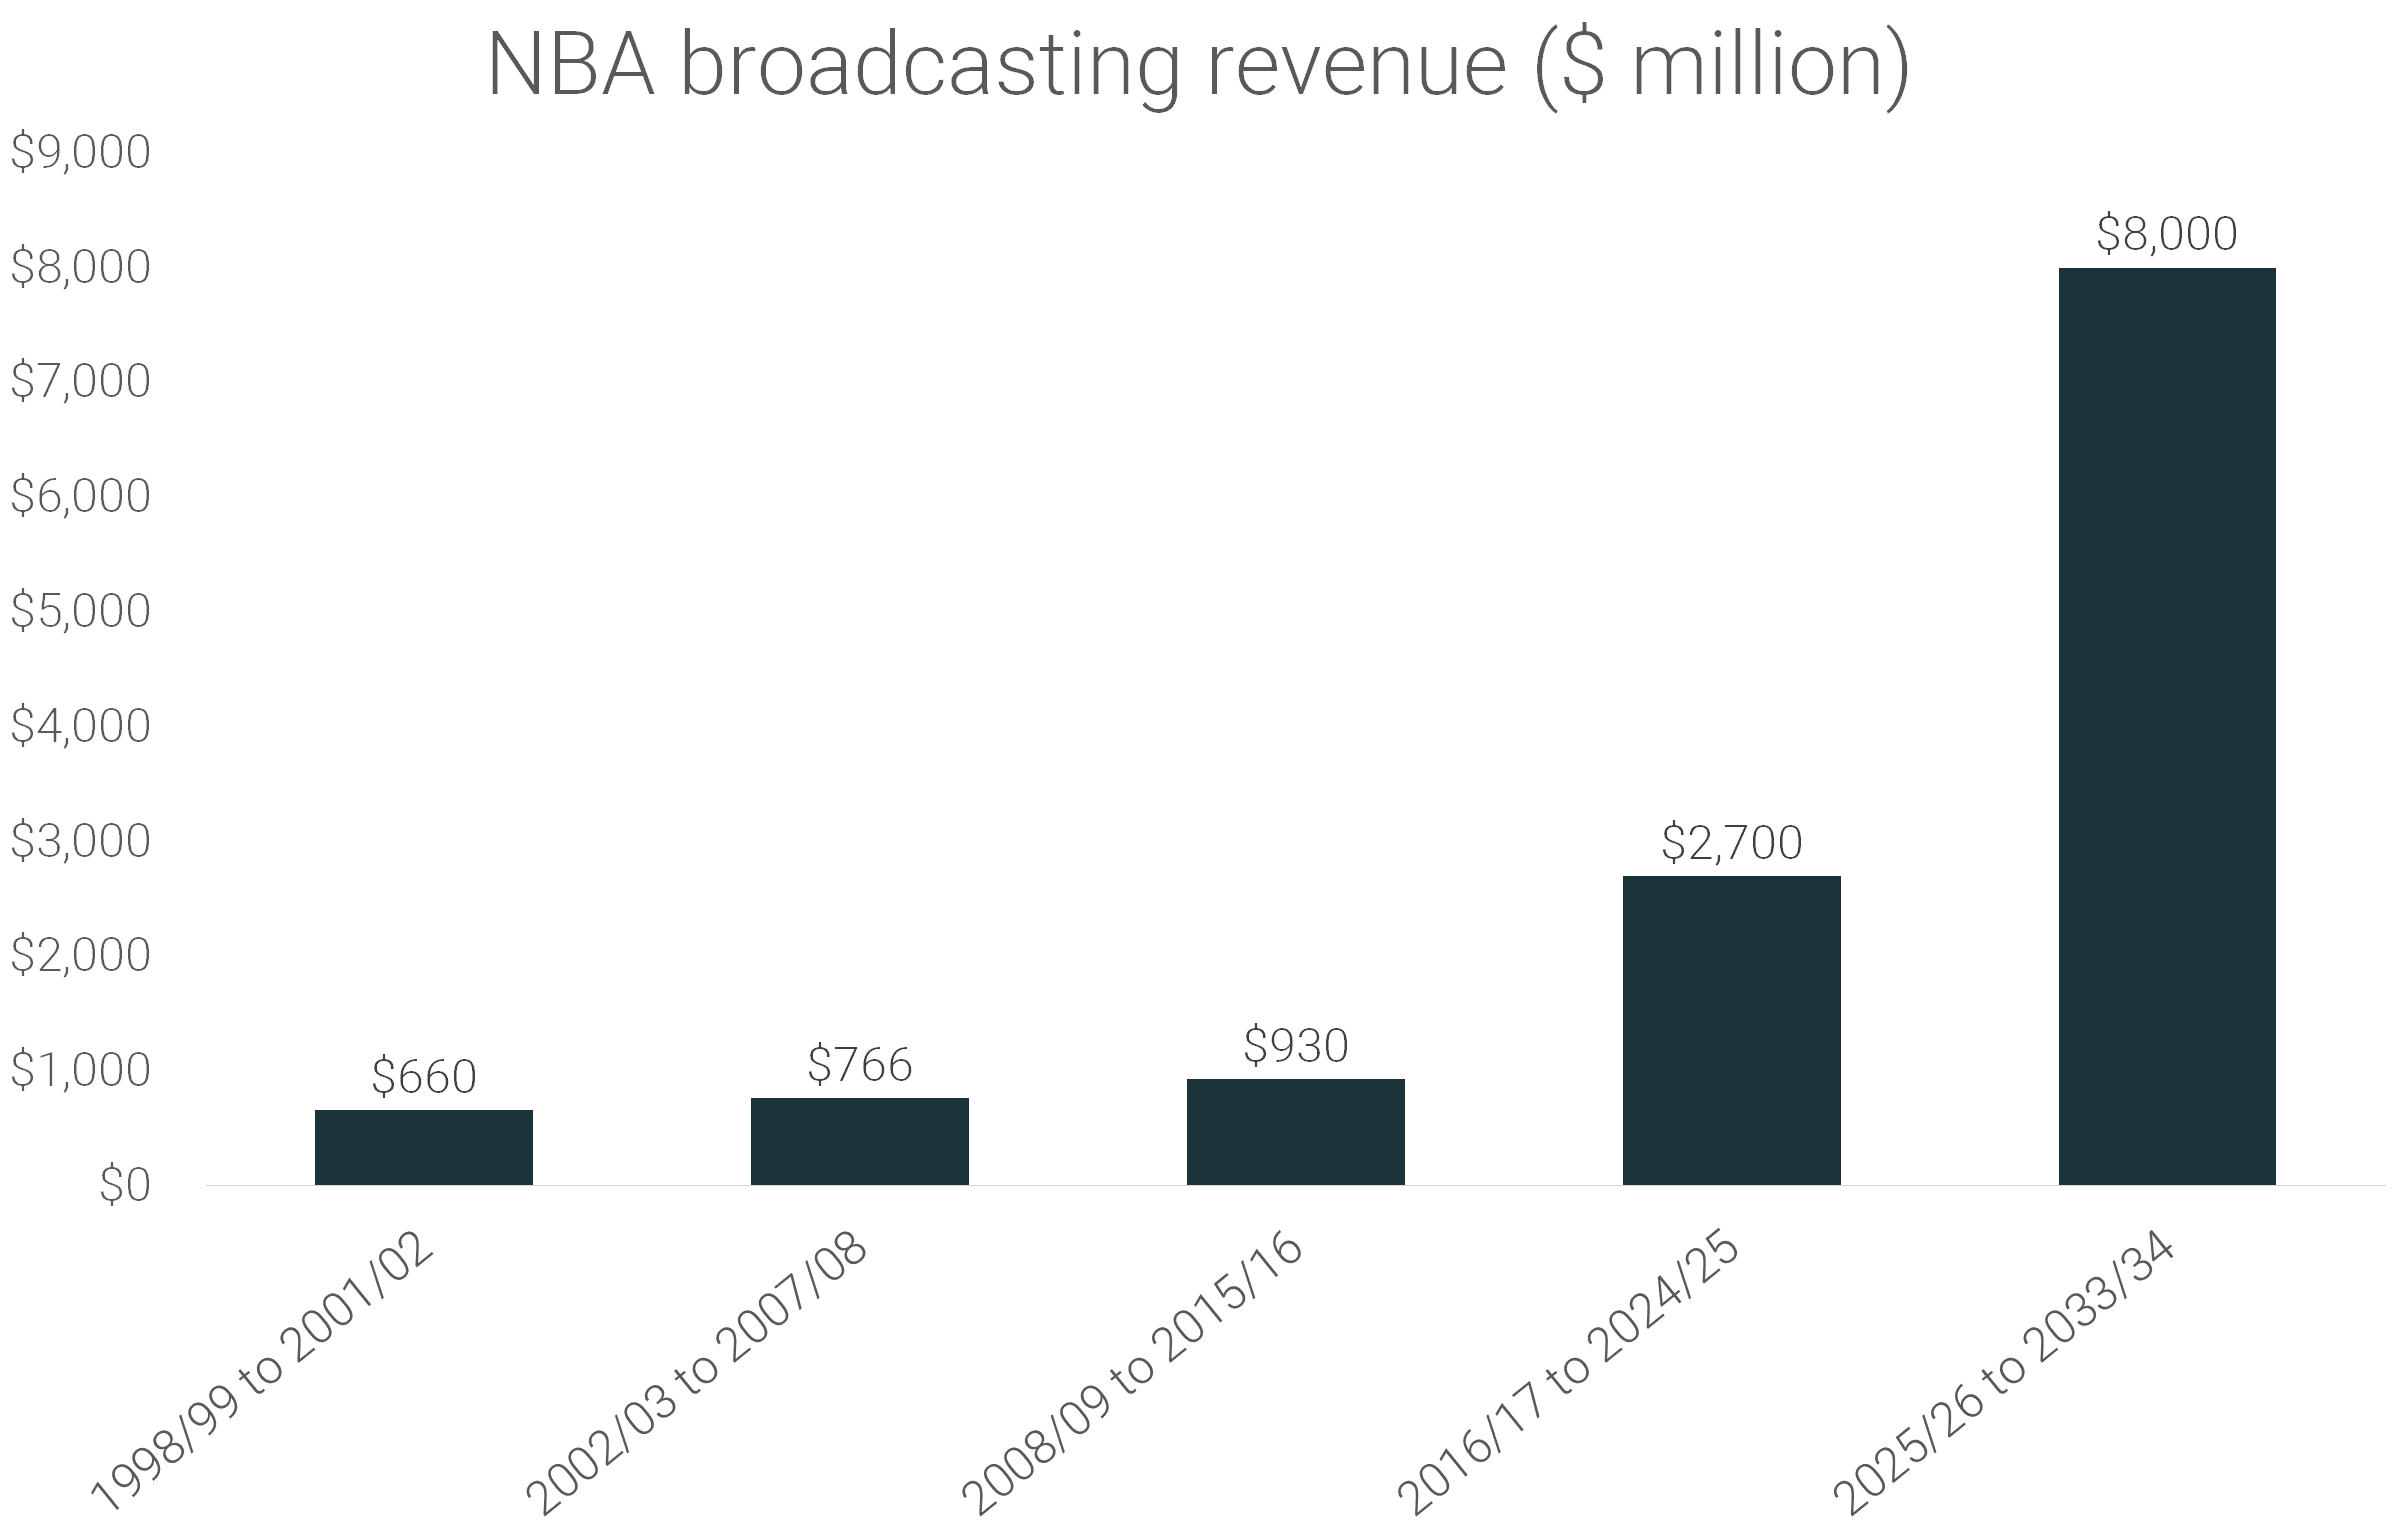
NBA national broadcasting revenue
- In 1998, the NBA signed a 4-year, $2.64 billion deal with NBC and Turner for broadcasting rights from 1998/99 to 2001/02 season.
- This deal generated $660 million in annual revenue for the NBA.
- In 2002, the NBA decided to partner with ESPN and ABC, signing a 6-year, $2.4 billion deal ($400 million/year)
- This presents a $400 million per year revenue.
- In addition, the NBA extended the deal with Turner Sports for 6-year, worth $2.2 billion.
- The deal added another $366 million of revenue for the league.
- From the 2002/03 to 2007/08 season, the NBA was generating $766 million annually from national broadcasting rights.
- In 2007, the NBA extended its deal with ESPN, ABC, and Turner Sports, worth $7.4 billion over 8 years.
- With this deal, the NBA increased its annual broadcasting revenue to $930 million per year.
- In 2014, the league made another contract extension with ESPN, ABC, and Turner. The deal is worth $24 billion over 9 years, concluding in the 2024/25 season.
- Since 2017, the NBA started generating $2.7 billion annually from this deal.
- The league is eligible for another extension, with a projected worth of $75 billion over 9 years.
- This deal would increase the NBA's broadcasting revenue to over $8 billion per year.
NBA local TV deals
- NBA teams local TV deals vary significantly
- Memphis Grizzlies have the smallest revenue from local TV deals, with $9.4 annual revenue.
- Los Angeles Lakers hold the largest local TV contract, earning $149 million annually.
- Only 4 NBA teams earn close to $100 annually from local broadcasters.
- Houston Rockets have a 20-year, $1.37 billion deal that nets them $66.7 million per year.
- Dallas Mavericks local deal generates them $20 million in revenue.
NBA merchandise revenue stats
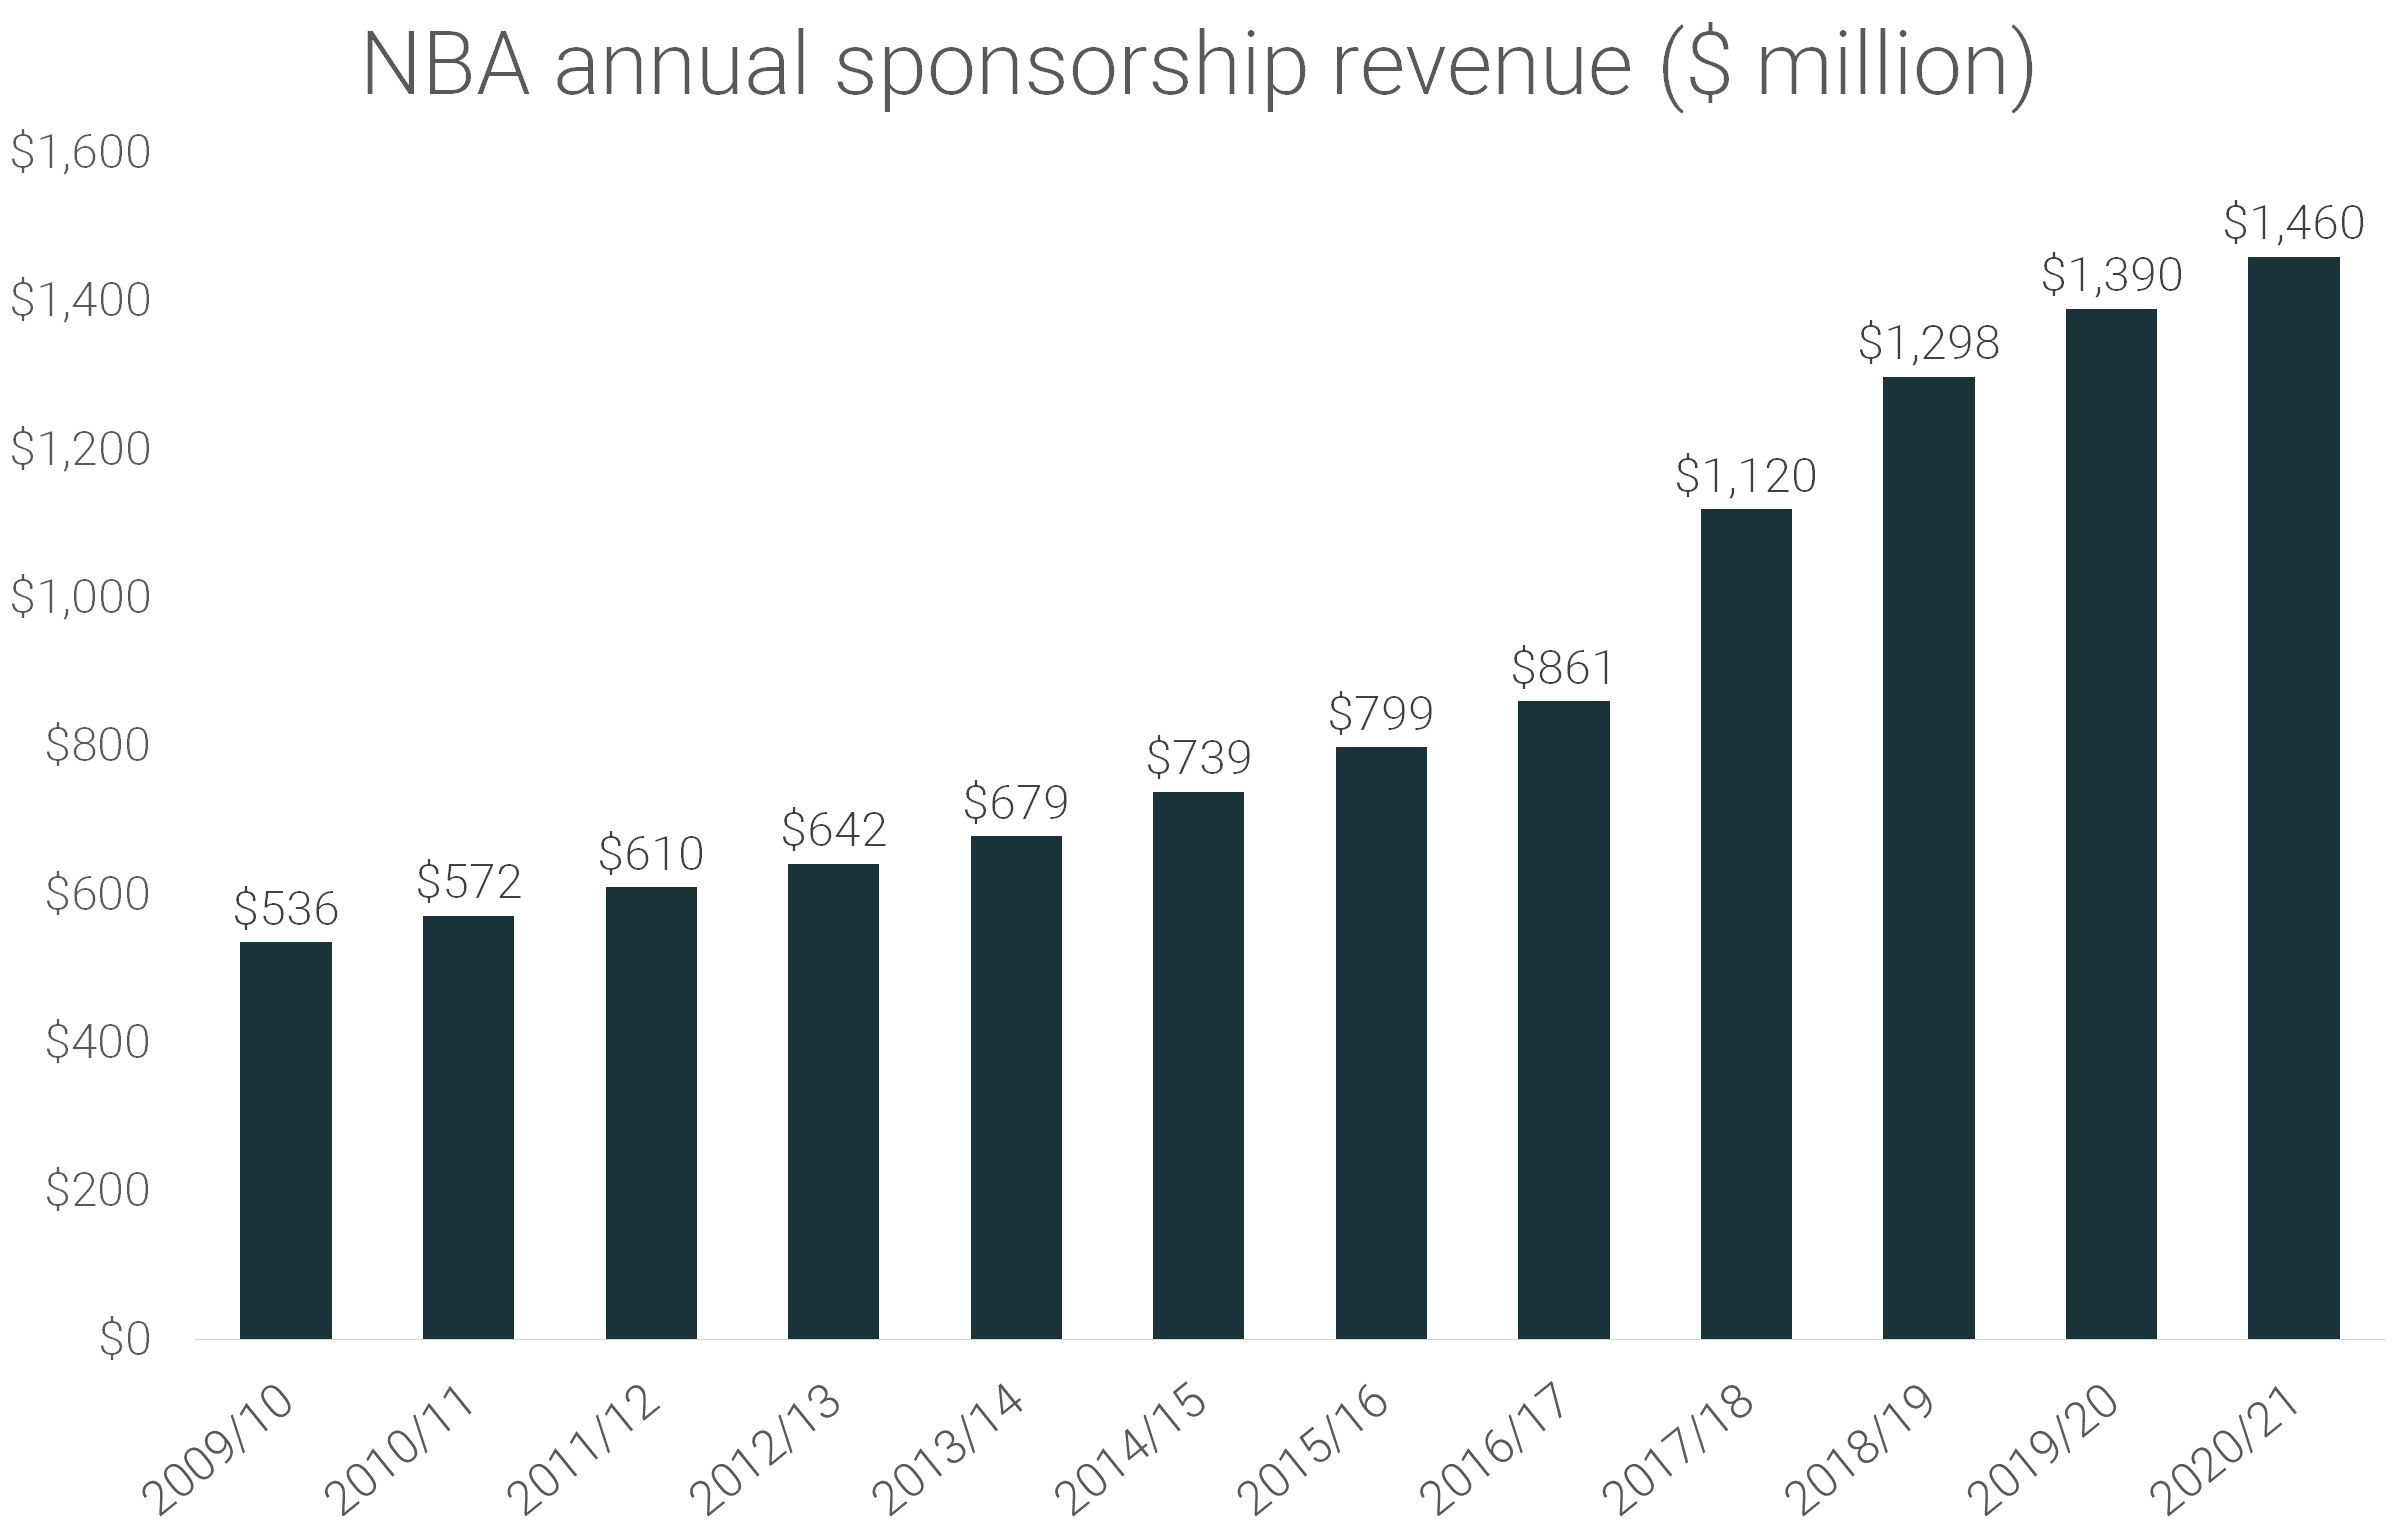
Sponsorship revenue statistics
- During the 2020/21 season, the NBA generated $1.46 billion in revenue from sponsorships. This is a 5% increase from a year before.
- Over the last 11 years, the NBA's annual sponsorship revenue grew 9.7% yearly on average.
- 2020/21 season was fourth in a row with sponsorship revenue exceeding $1 billion in a year.
- During the 2020/21 season, the NBA signed 13 new sponsorship deals that brought around $115 million per year in revenue.
- Since the 2017/18 season, the NBA generates around $125 per year from a sponsorship deal with Nike.
- This deal is a 245% increase in annual revenue compared to the previous deal with adidas, worth $51 million annually.
NBA jersey patch sponsorship stats
- Since 2017, the NBA allowed teams to have brand logos on their jerseys.
- The deal is worth $9.3 annually on average, though varies significantly from team to team.
- Golden State Warriors have the most lucrative jersey patch deal, worth $20 million annually.
- Since 2019, the Los Angeles Lakers also started to generate $20 million per year from the jersey patch deals.
|
Team |
Jersey patch annual revenue ($ million) |
|
Atlanta Hawks |
$2.5 to $10 million |
|
Boston Celtics |
$7 million |
|
Brooklyn Nets |
$8 million |
|
Charlotte Hornets |
$4 to $4.5 million |
|
Cleveland Cavaliers |
$10 million |
|
Detroit Pistons |
$5 to $10 million |
|
Golden State Warriors |
$20 million |
|
Indiana Pacers |
$8 to $10 million |
|
LA Clippers |
$10 million |
|
LA Lakers |
$20 million |
|
New York Knicks |
$12 to $14 million |
|
Oklahoma City Thunder |
$10 million |
|
Philadelphia 76ers |
$5 million |
|
Sacramento Kings |
$5 million |
|
Toronto Raptors |
$4 million |
|
Utah Jazz |
$4 million |
Impact of Covid-19 pandemic on NBA revenue
- The NBA revenue dropped 10% in 2020 as a consequence of the Coronavirus outbreak.
- The operating income of the league dropped by 11% in 2020.
- The league lost $800 million from ticket sales and $400 million from sponsorships and merchandise.
- The expenses of the Orlando Bubble were $190 million, $10 more than planned.
- The Bubble helped the NBA recuperate 1.5 billion dollars in revenue that would've been lost.
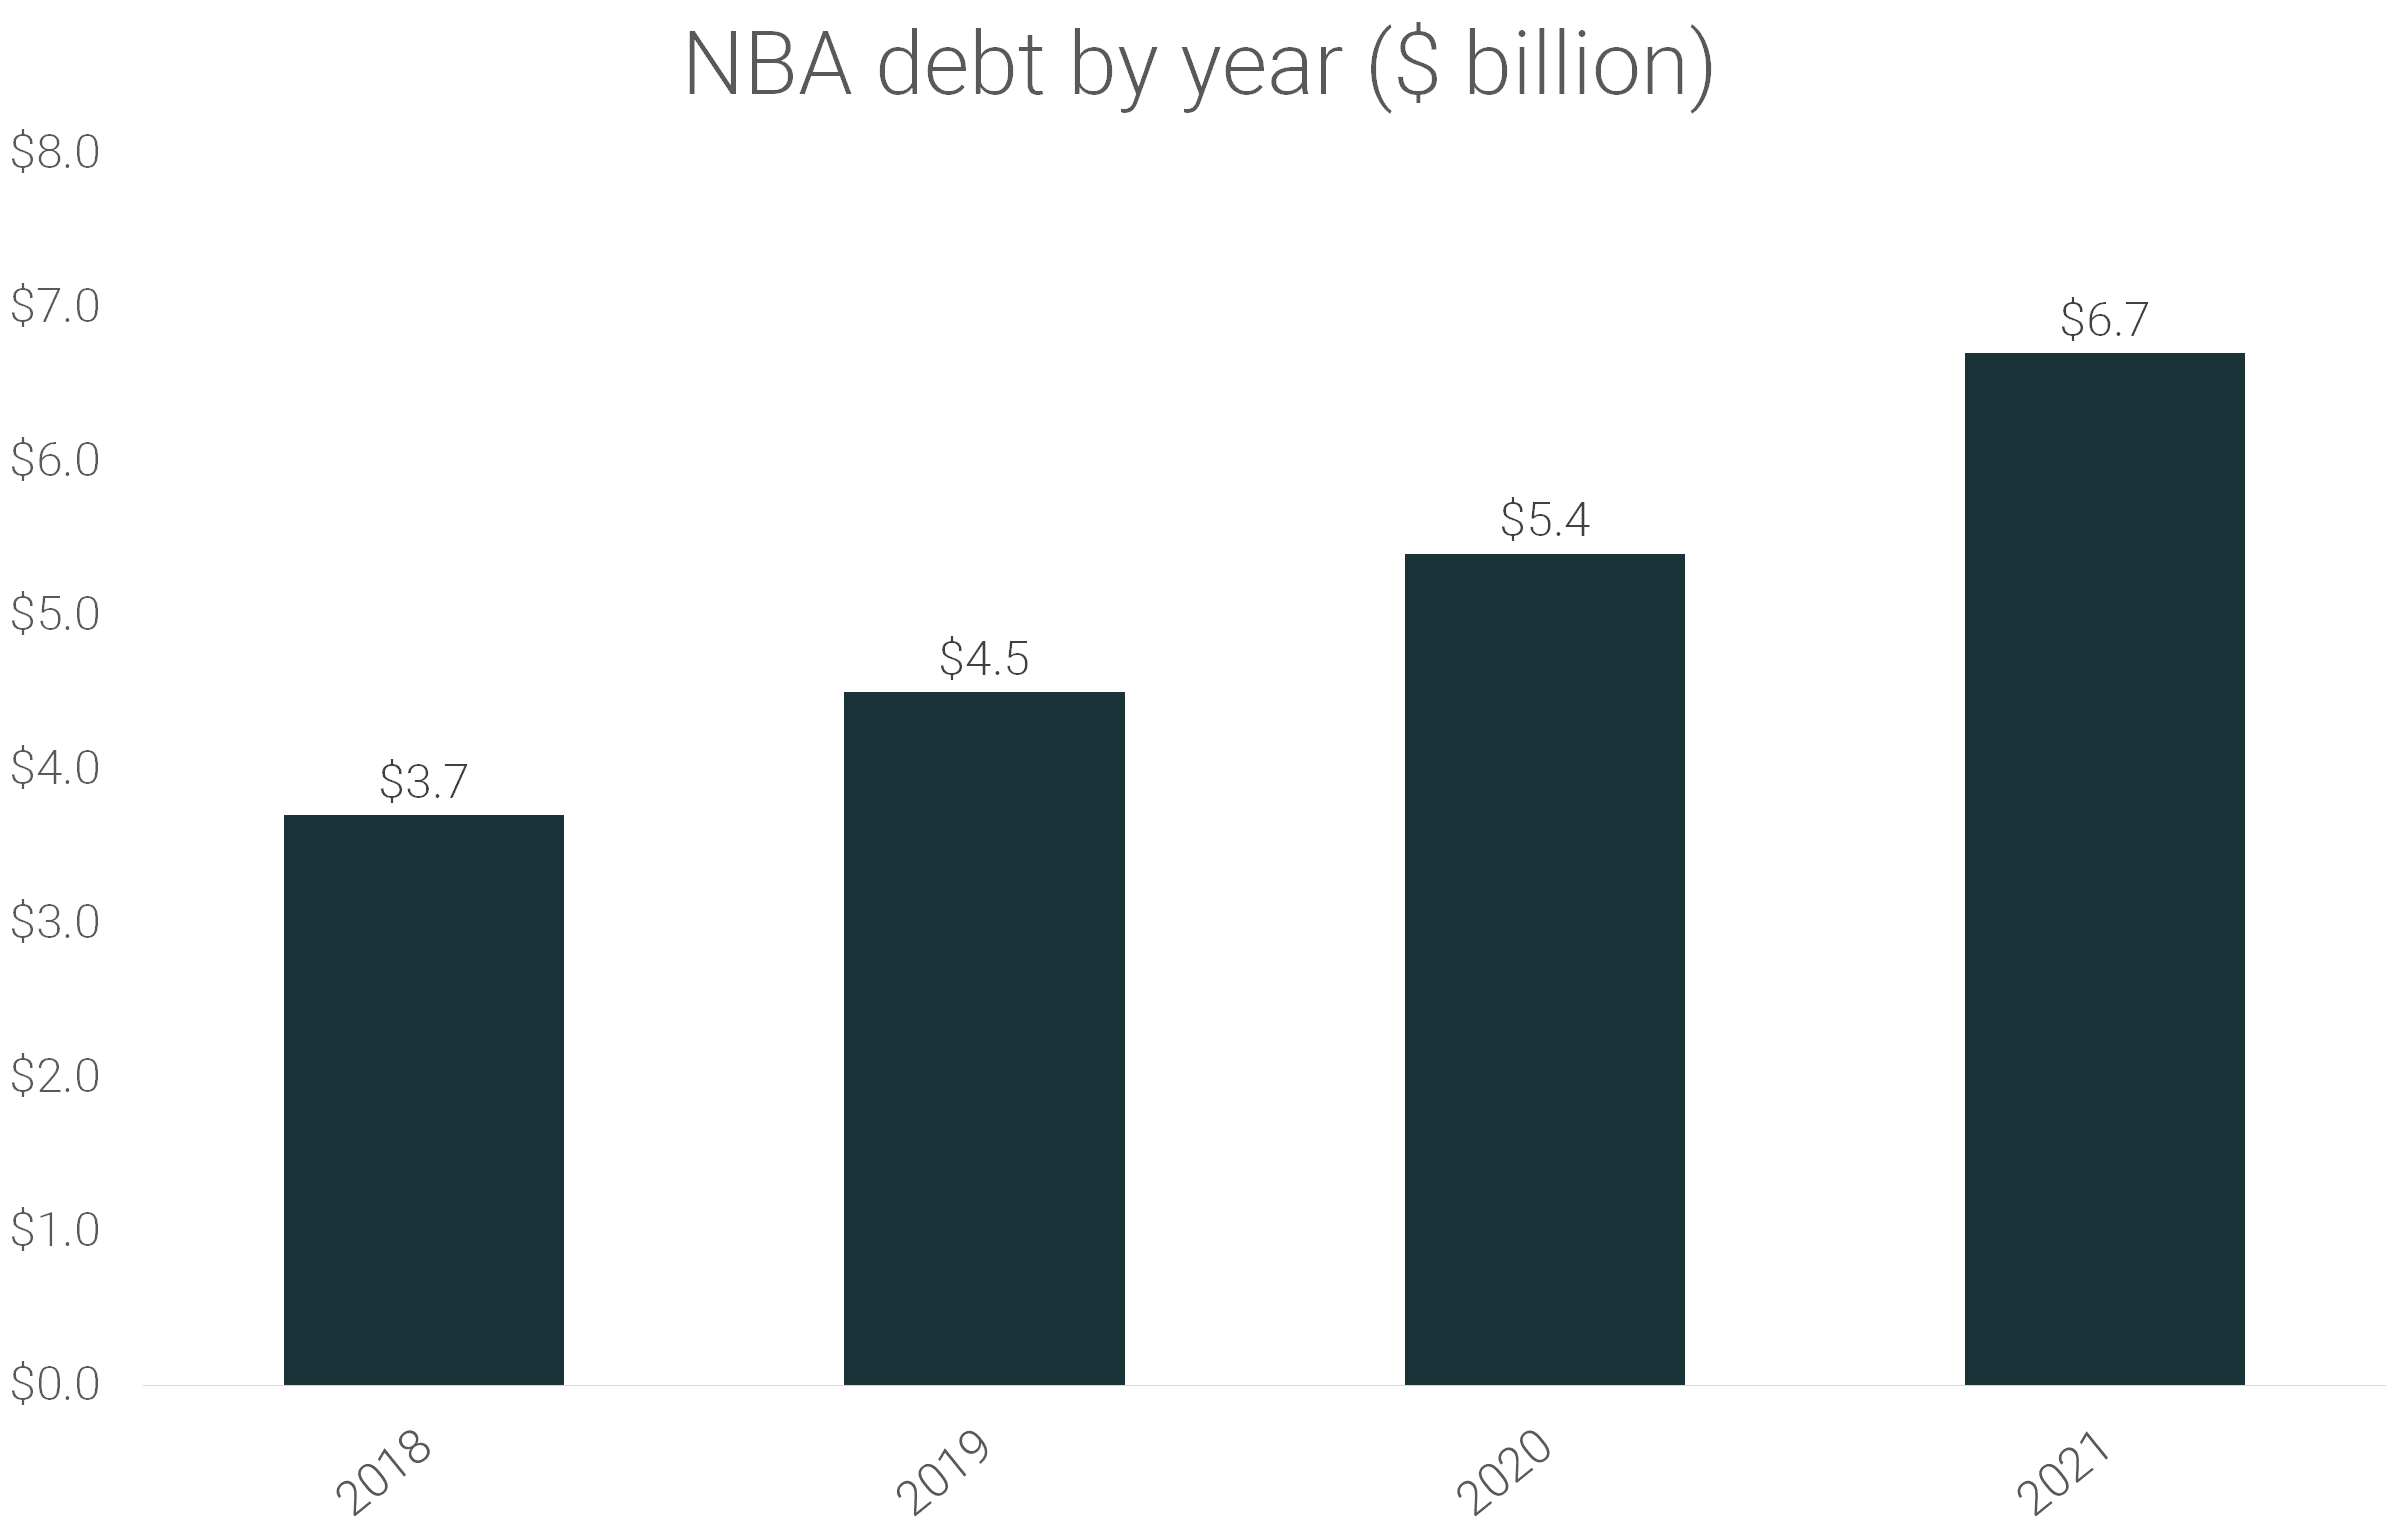
- The NBA debt is currently $6.7 billion, increasing by 24% compared to the previous year.
- This is the largest increase in NBA debt over the last 4 years.
About RunRepeat
RunRepeat helps you choose the best model of shoes according to your needs and playing style. We do that by offering the highest level of objectivity possible thanks to our shoe tests, all the nit-picky tests in the lab where we cut shoes in half, and our finances: we buy all the shoes with our own money.
Our guide page will help you get specific information about each type and its effect on your feet and performance.