Adidas Shoes Statistics
Adidas is the biggest footwear brand in Europe and the second-biggest shoe brand worldwide. On this page, we compiled the latest and historical qualitative data that paints the brand’s ups and downs and its journey to the future.
Top Adidas shoe statistics
- Adidas experienced a 3.1% growth in 2022, capping the year with $13.2 billion in revenue from its footwear segment.
- The net sales amounted to $11.4 billion, a 9.6% improvement from its $10.4 billion figure in 2021.
- Adidas is the second biggest shoe company with a 15.6% market share in 2022.
- Meanwhile, in the athletic shoes department, it has about 15.4% market share. For the sneaker segment, Adidas grips 14.7% of the market.
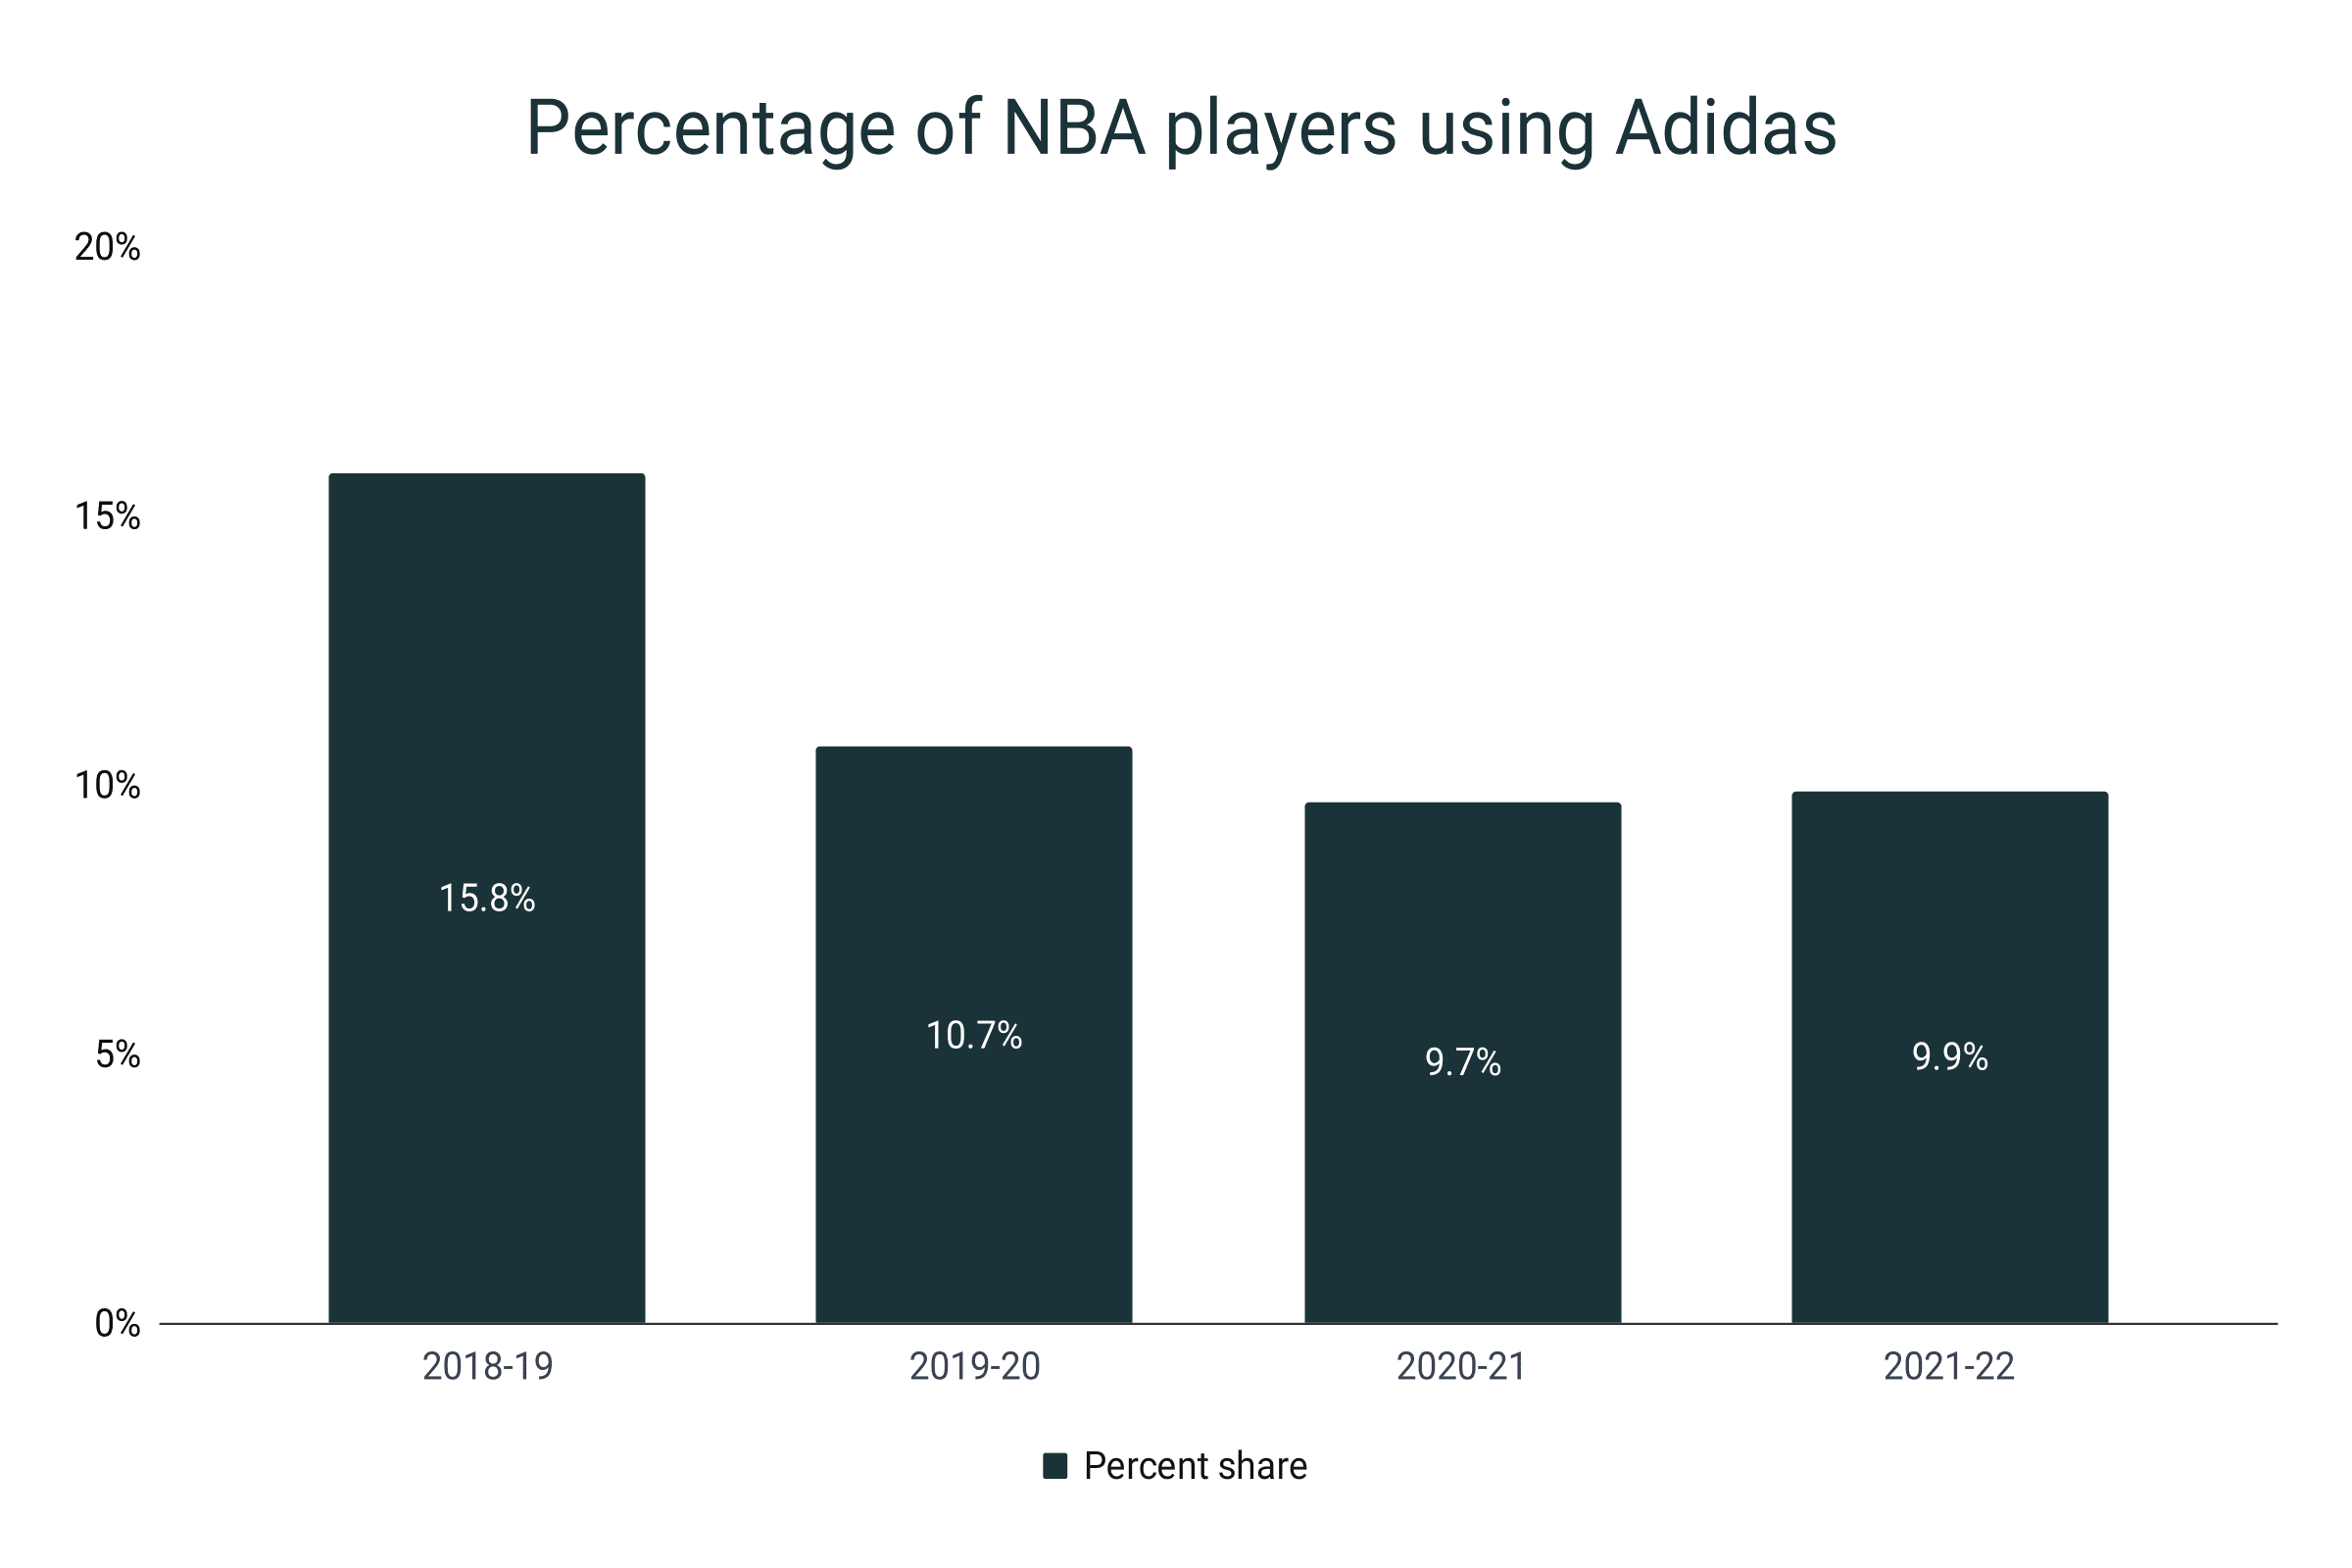
- For the past four seasons of the NBA, about 11.5% of the players have worn Adidas. In the 2021-22 season, 9.9% sported the brand.
- Adidas is the most male-leaning shoe company with 73% of its market dedicated to men. Only 27% is for women.
- In 2019, Adidas shoes occupy 29% of the resale market.
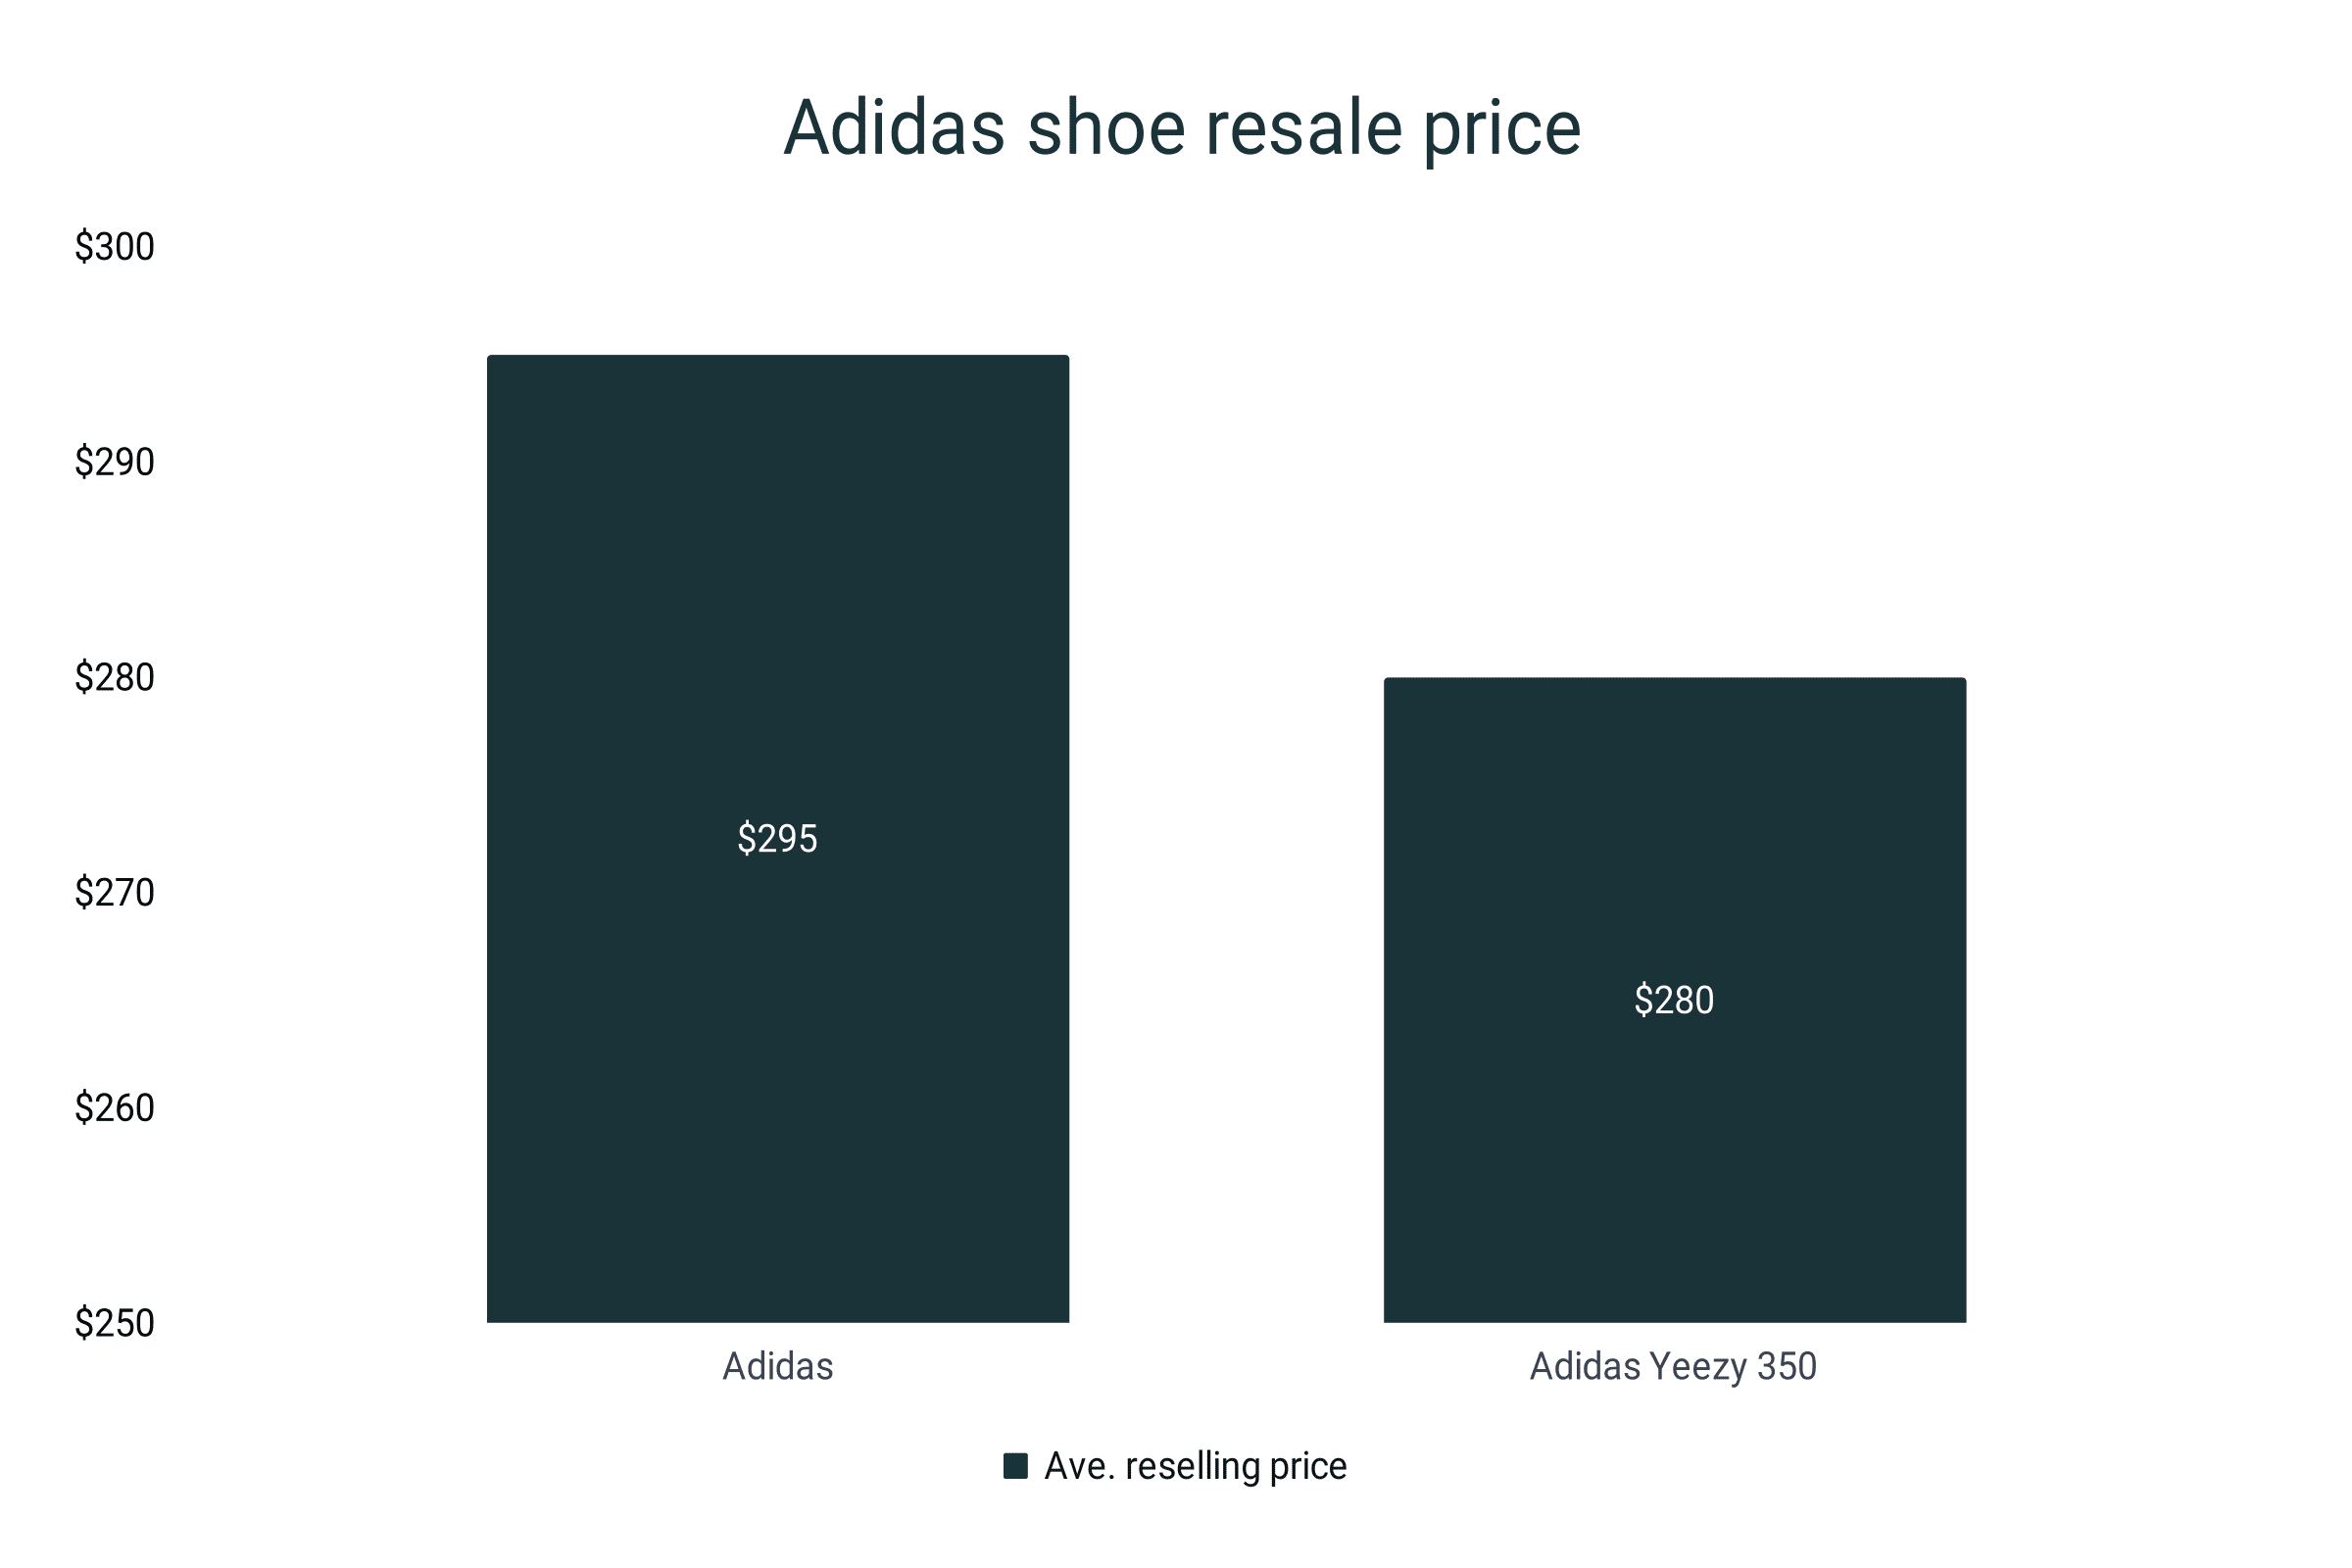
- On average, a pair of second-hand Adidas shoes costs $295 which is 36% more than the average retail price.
- Four hundred nineteen million pairs of shoes were manufactured by Adidas in 2022. This is a 23% growth compared to the 340 million output in 2021.
- In 2022, Adidas was able to produce 27 million pairs of shoes that contain recycled waste.
- After switching fully to sustainable cotton in 2018, Adidas targets to achieve 100% use of recycled polyester by 2024.
Adidas shoe revenue
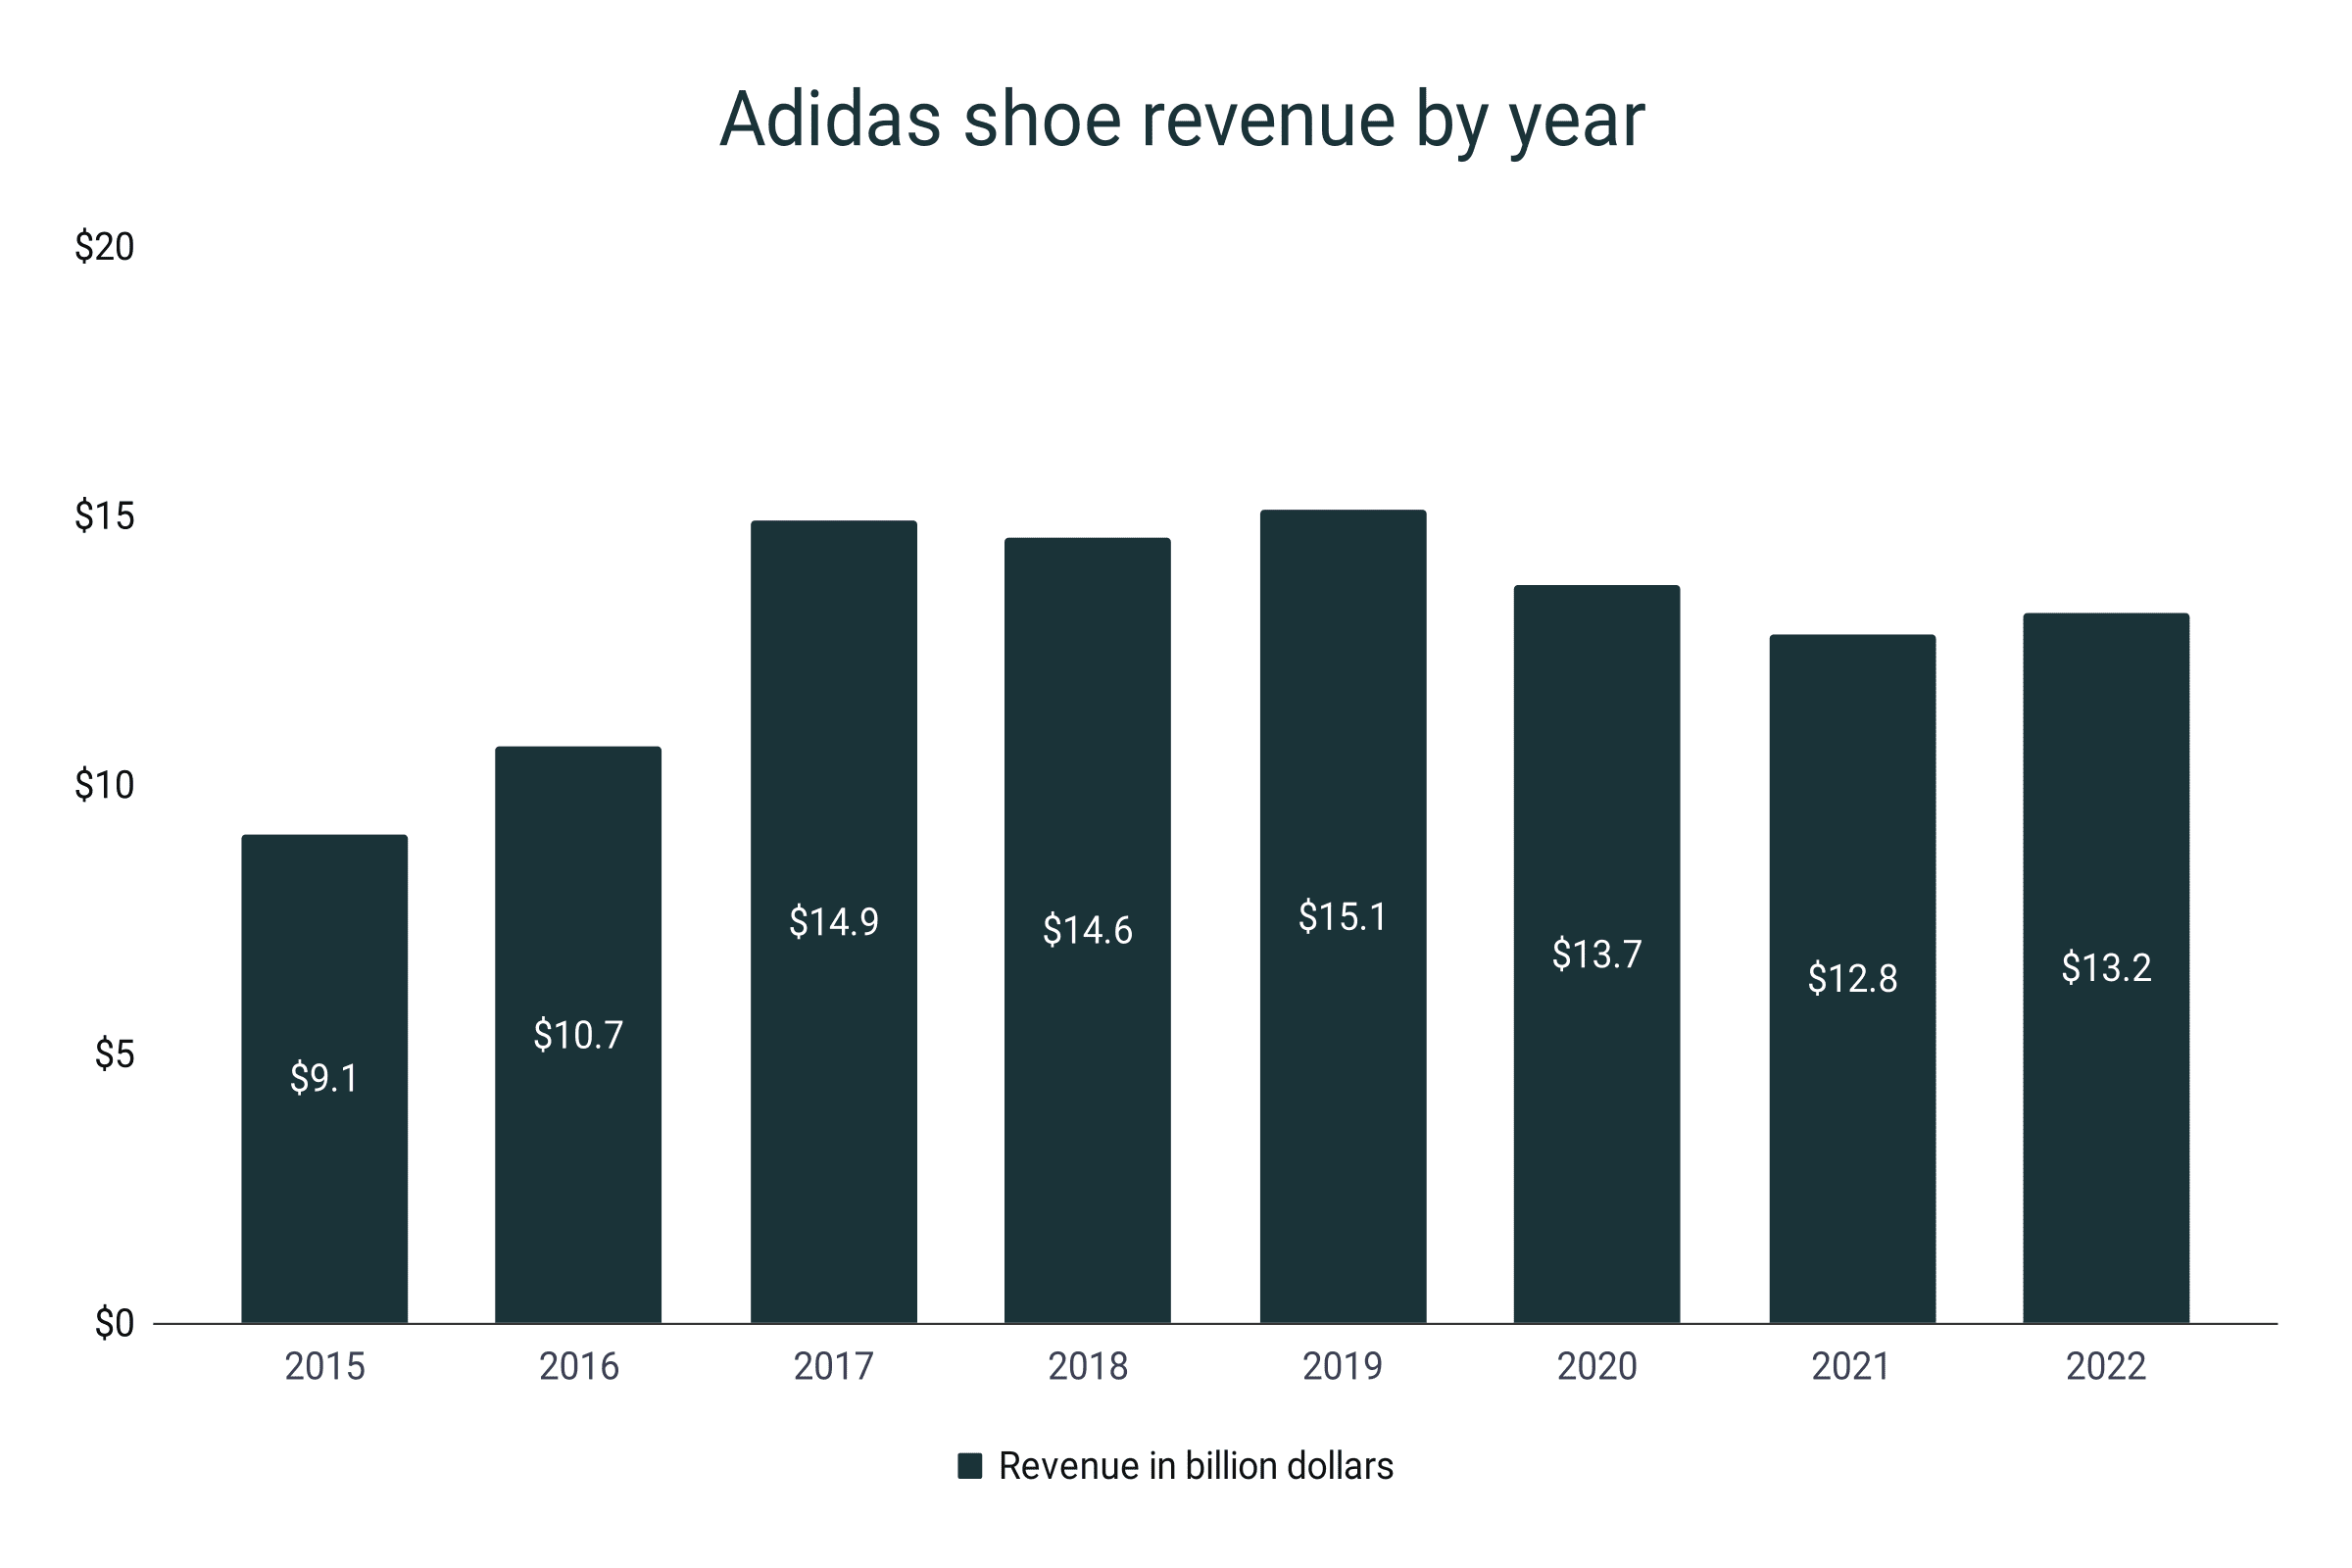
- Adidas ended 2022 with a $13.2 billion revenue in its footwear segment, signifying a 3.1% increase.
- A year prior, the brand’s revenue from shoes amounted to $12.8 billion.
- Adidas recorded its highest total footwear revenue for the past eight years in 2019 where it managed to generate $15.1 billion.
- However, during the onslaught of the pandemic, the company lost 9.3% of its footing, dropping to $13.7 billion by 2020.
- It continued its losing streak in 2021 when shoe sales plummeted by another 6.6%.
- Notably, the last major increase in the shoe sales of Adidas happened in 2017 when it jumped from $10.7 billion to $14.9 billion, showcasing a 39.2% hop.
- With a $9.1 billion global footwear revenue in 2015, Adidas was able to amplify its shoe sales by 45.1% by 2023.
Adidas shoe revenue by year
|
Year |
Revenue in billion dollars |
Growth |
|
2015 |
$9.1 |
|
|
2016 |
$10.7 |
17.6% |
|
2017 |
$14.9 |
39.3% |
|
2018 |
$14.6 |
-2.0% |
|
2019 |
$15.1 |
3.4% |
|
2020 |
$13.7 |
-9.3% |
|
2021 |
$12.8 |
-6.6% |
|
2022 |
$13.2 |
3.1% |
Adidas shoe net sales
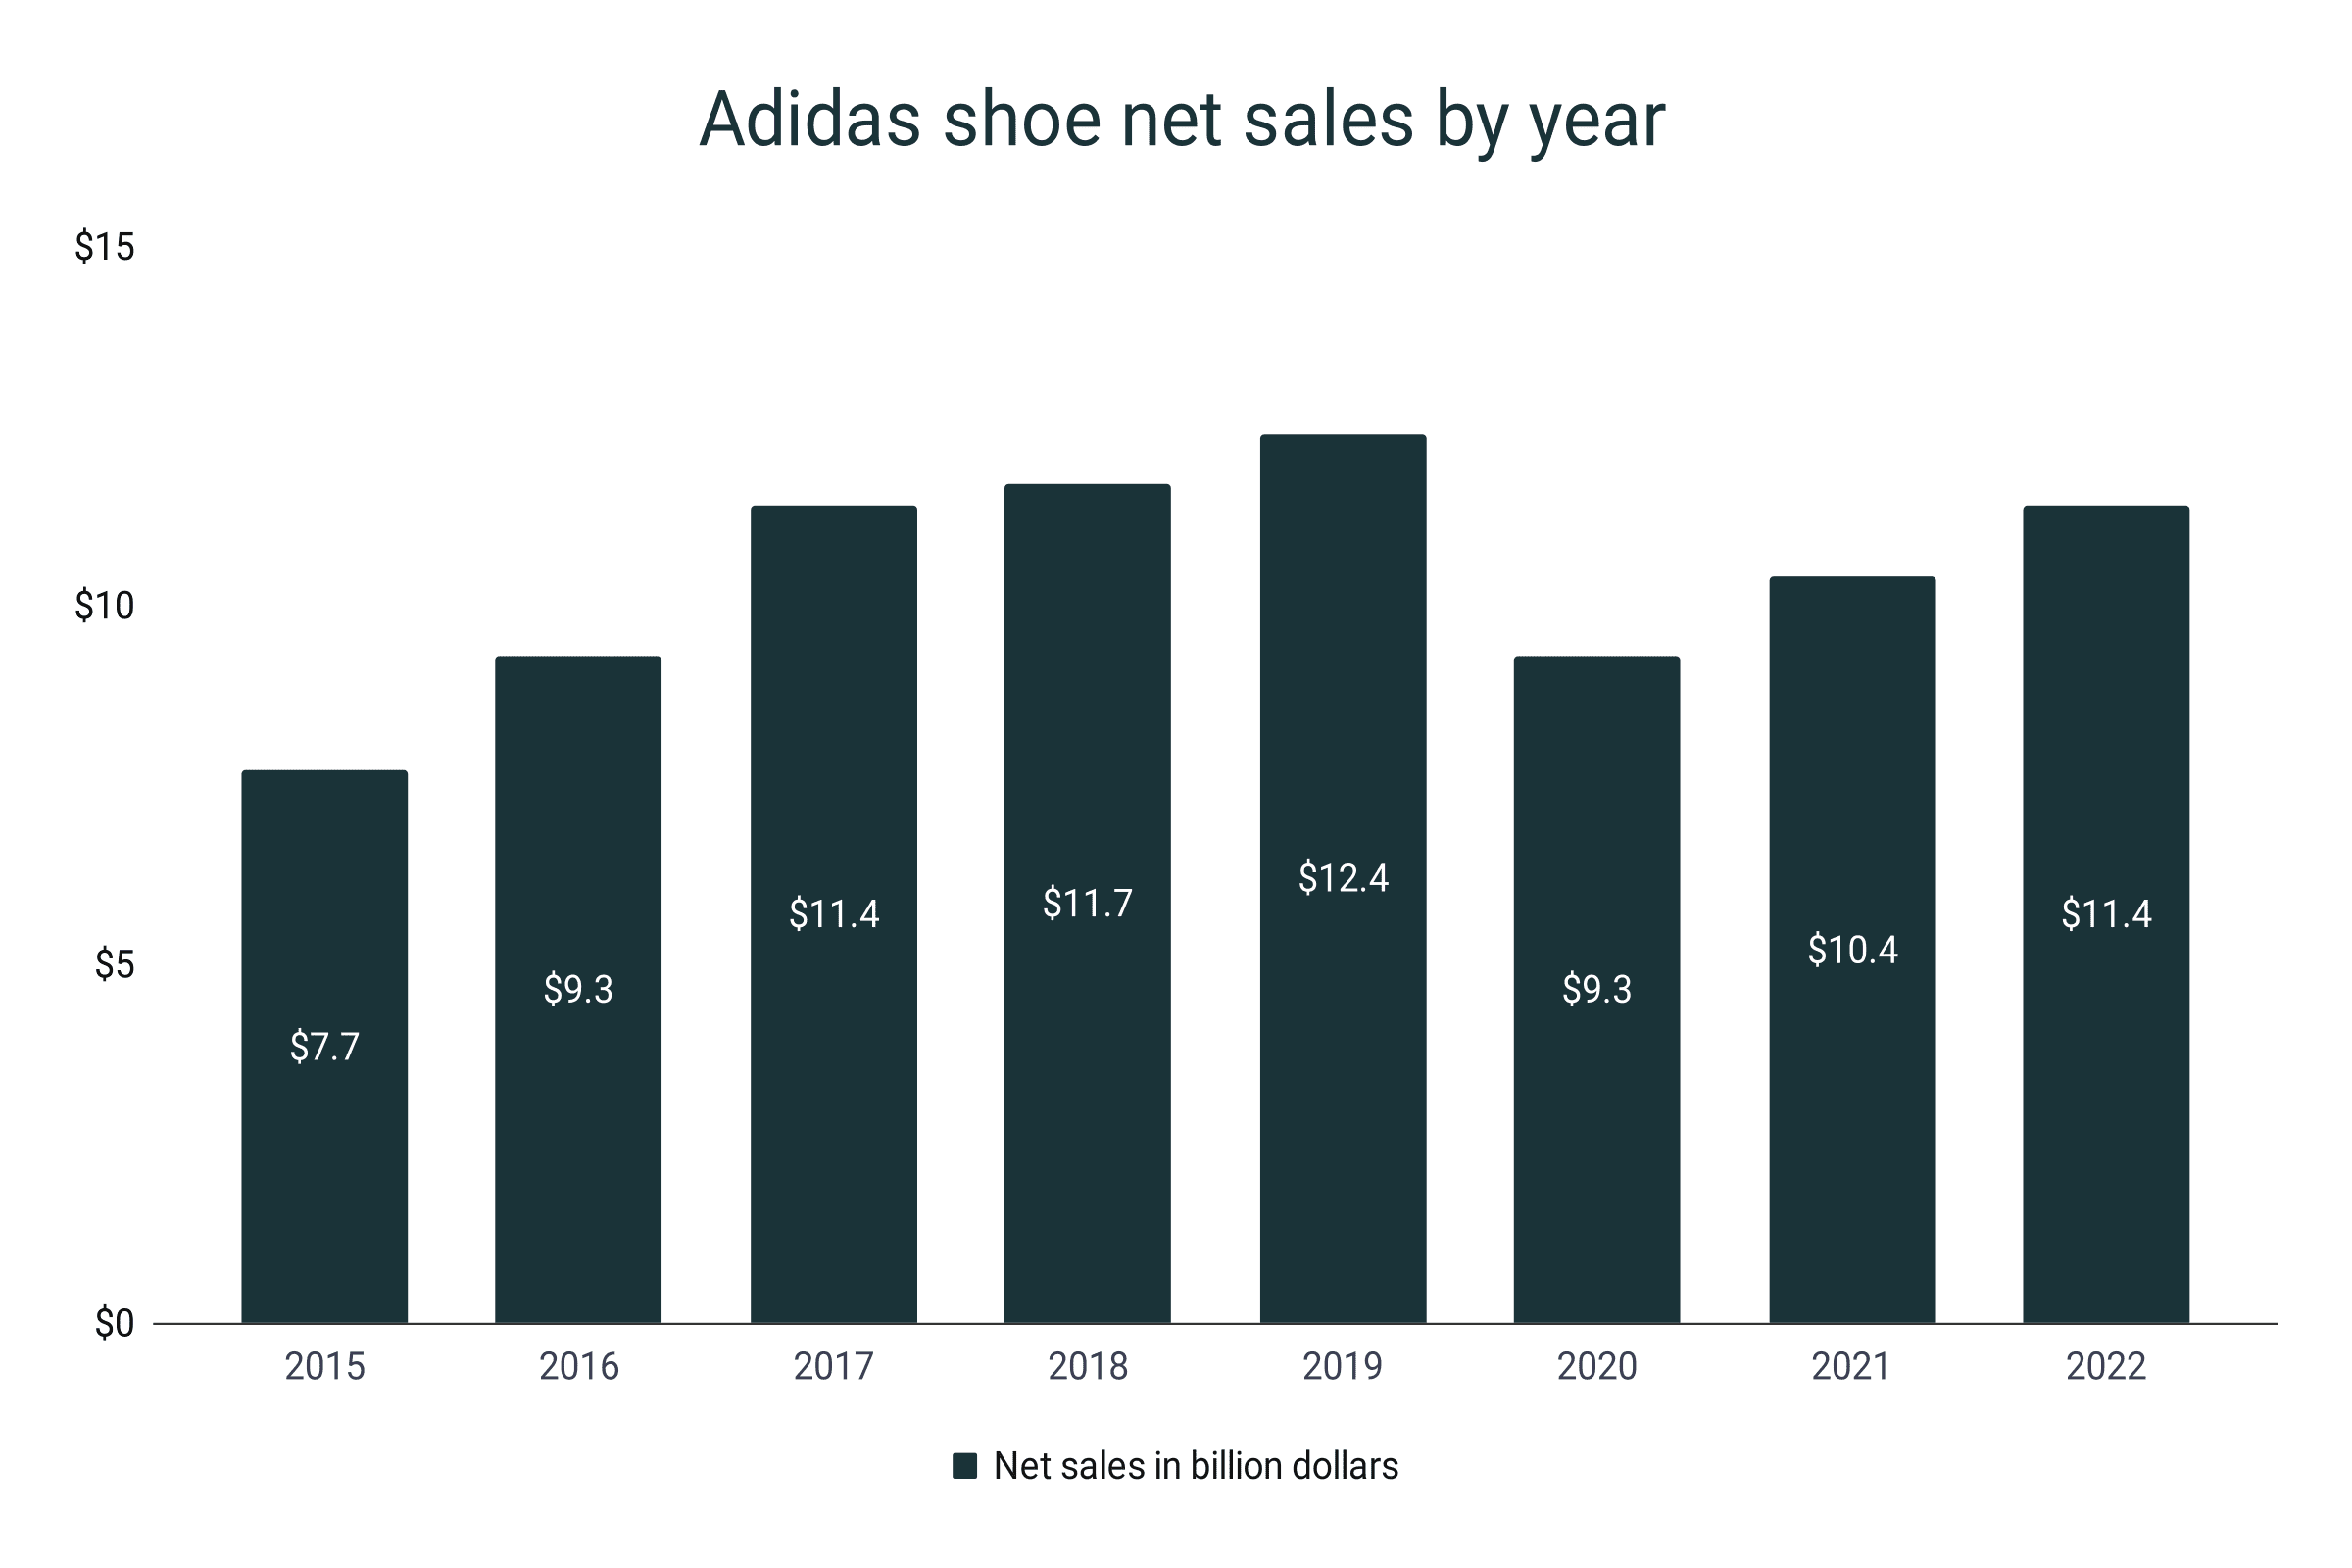
- In 2022 the net sales of the Adidas footwear segment amounted to $11.4 billion.
- This is equivalent to a 9.6% growth from the $10.4 billion of the previous year.
- During the 2015-2022 period, the highest Adidas shoe net sales amounted to $12.4 billion in 2019.
- However, Adidas suffered a 25% decline during the pandemic. It plummeted to $9.3 billion in 2020.
- The biggest rise in the Adidas shoe net sales happened in 2017 when the company registered a 22.6% rise.
- From 2015 to 2022, the footwear net sales of Adidas has grown by 48%.
Adidas shoe net sales by year
|
Year |
Net sales in billion dollars |
Growth |
|
2015 |
$7.7 |
|
|
2016 |
$9.3 |
20.8% |
|
2017 |
$11.4 |
22.6% |
|
2018 |
$11.7 |
2.6% |
|
2019 |
$12.4 |
6.0% |
|
2020 |
$9.3 |
-25.0% |
|
2021 |
$10.4 |
11.8% |
|
2022 |
$11.4 |
9.6% |
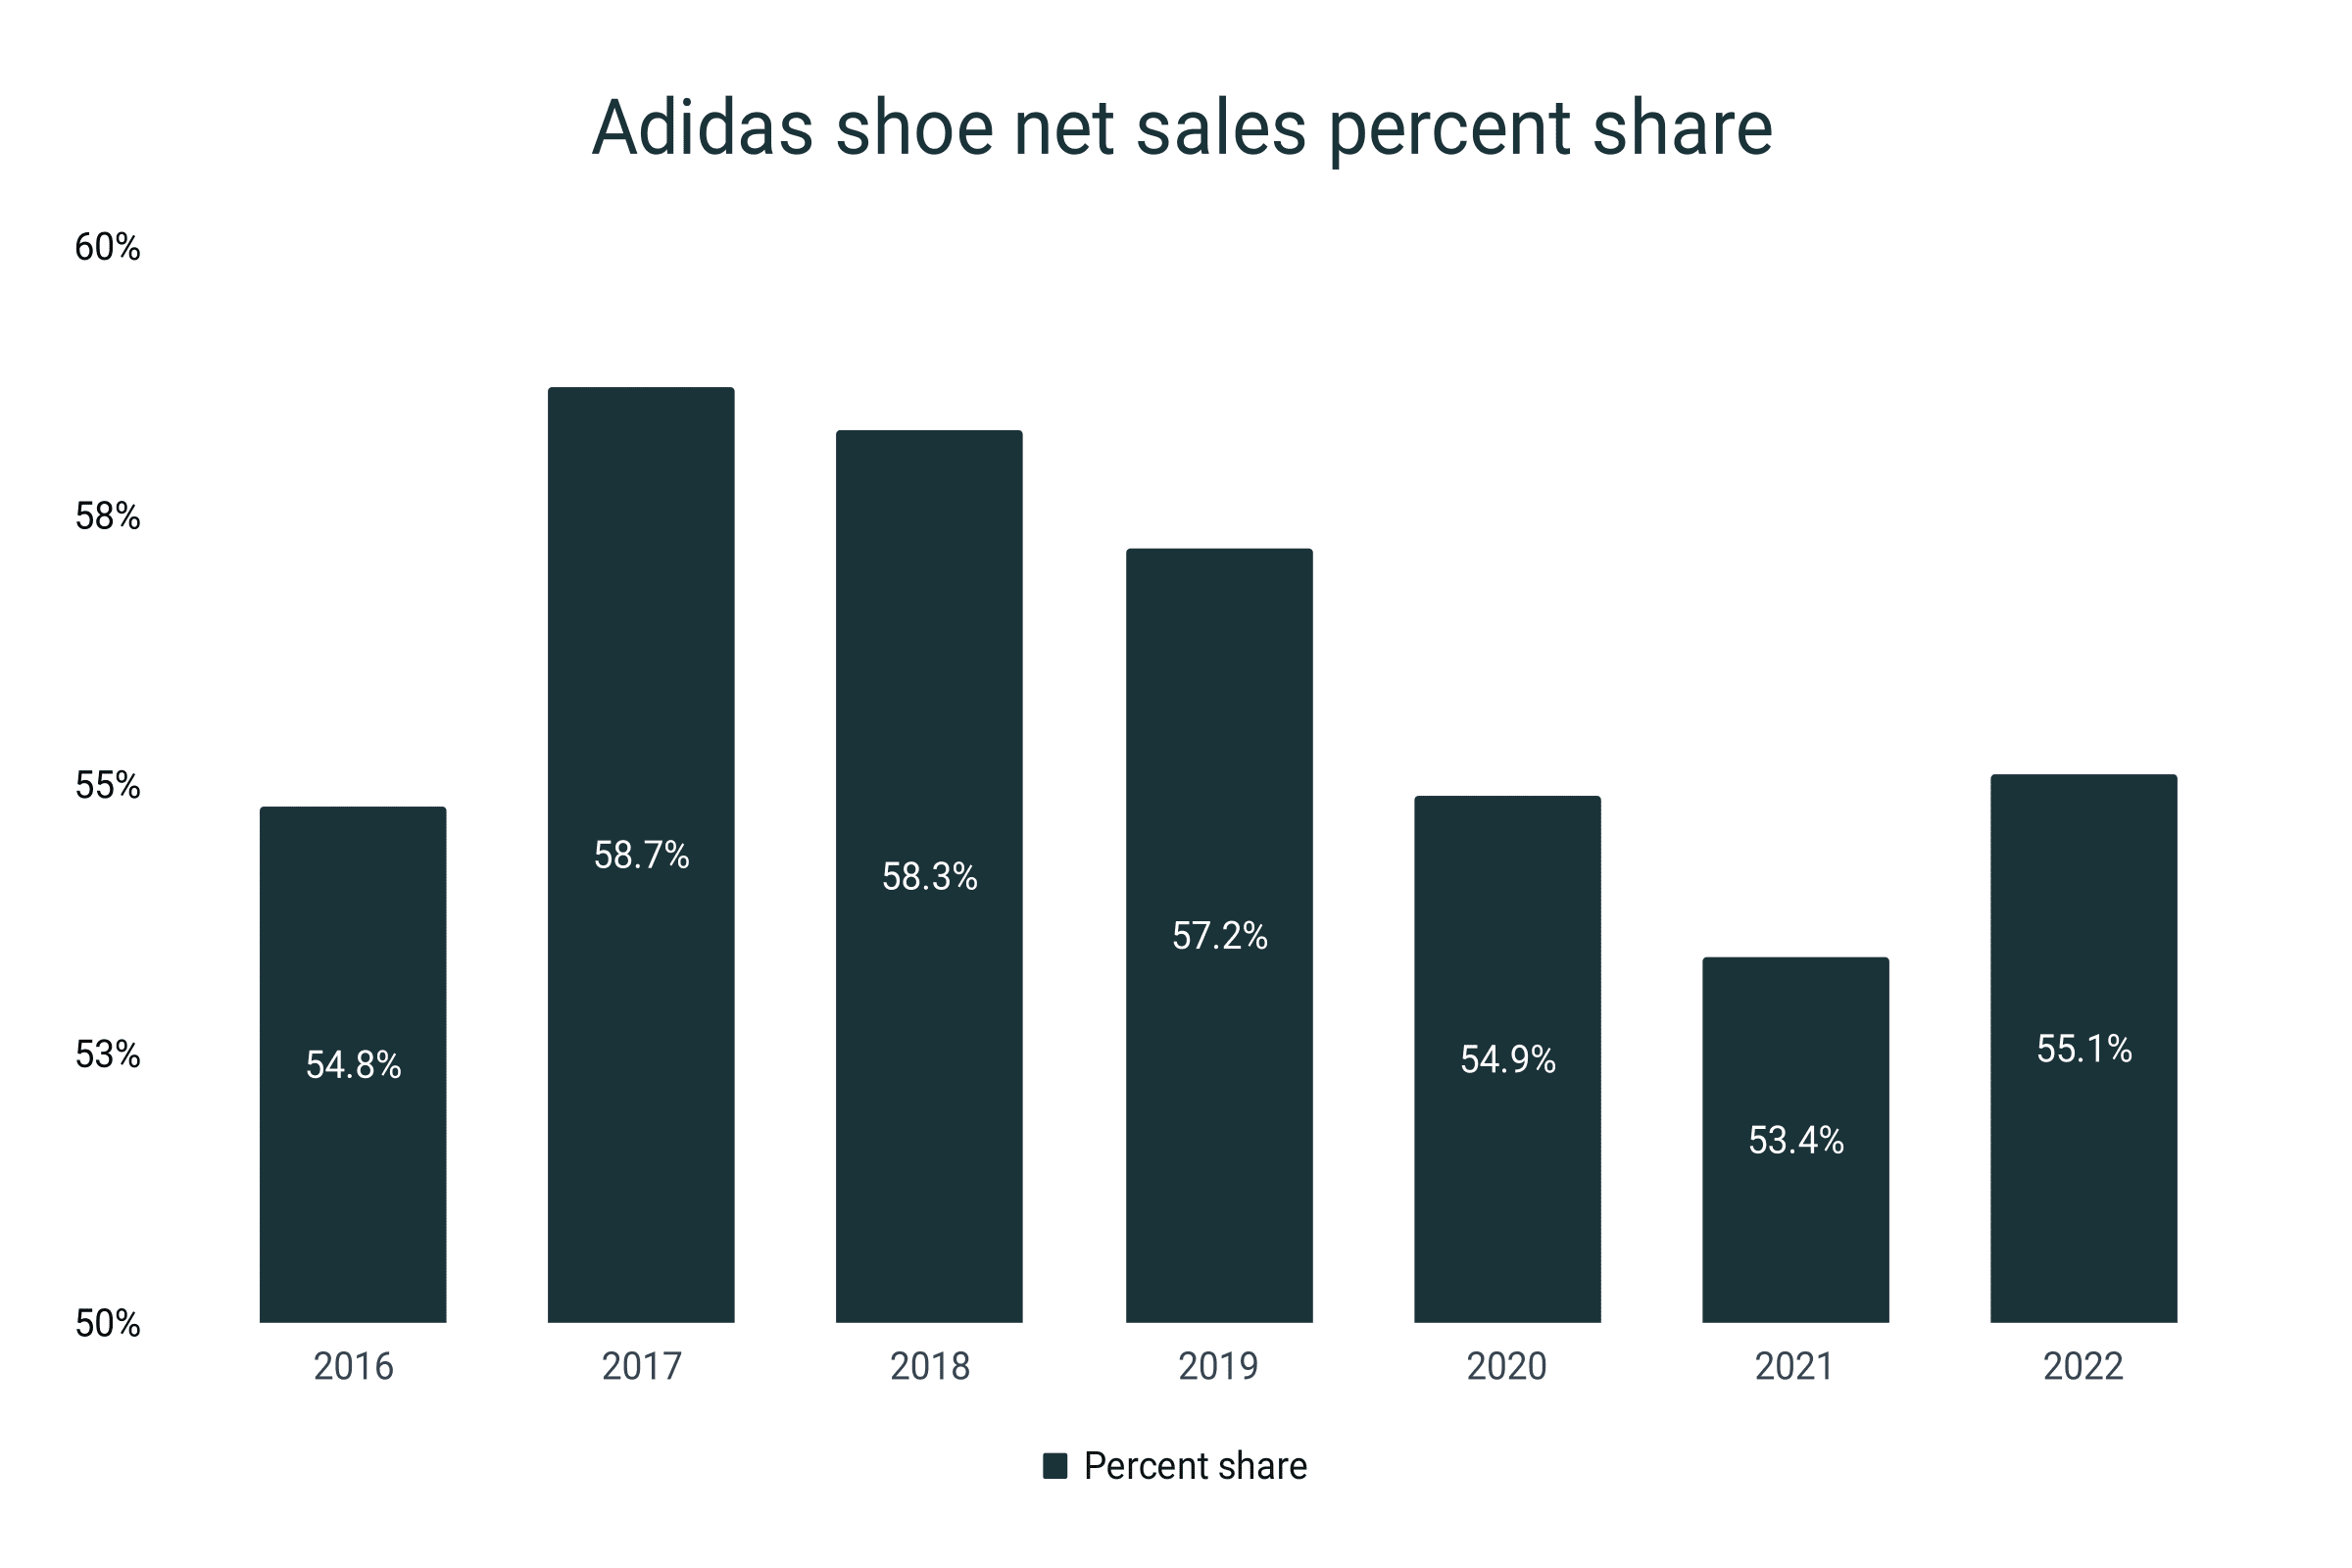
- Relative to the global brand net sales, the Adidas footwear segment closed with a 55.1% share in 2022.
- It has risen by 1.7 points compared to the 53.4% in 2021.
- The strongest year for the shoes segment occurred in 2017 when it took a 58.7% share of the company’s net sales.
- On average, from 2016 to 2022, footwear sales were 56.1% of the company’s total net sales.
Adidas shoe net sales percent share
|
Year |
Percent share |
|
2016 |
54.8% |
|
2017 |
58.7% |
|
2018 |
58.3% |
|
2019 |
57.2% |
|
2020 |
54.9% |
|
2021 |
53.4% |
|
2022 |
55.1% |
|
Ave. (2016-2022) |
56.1% |
Adidas shoe net sales by region
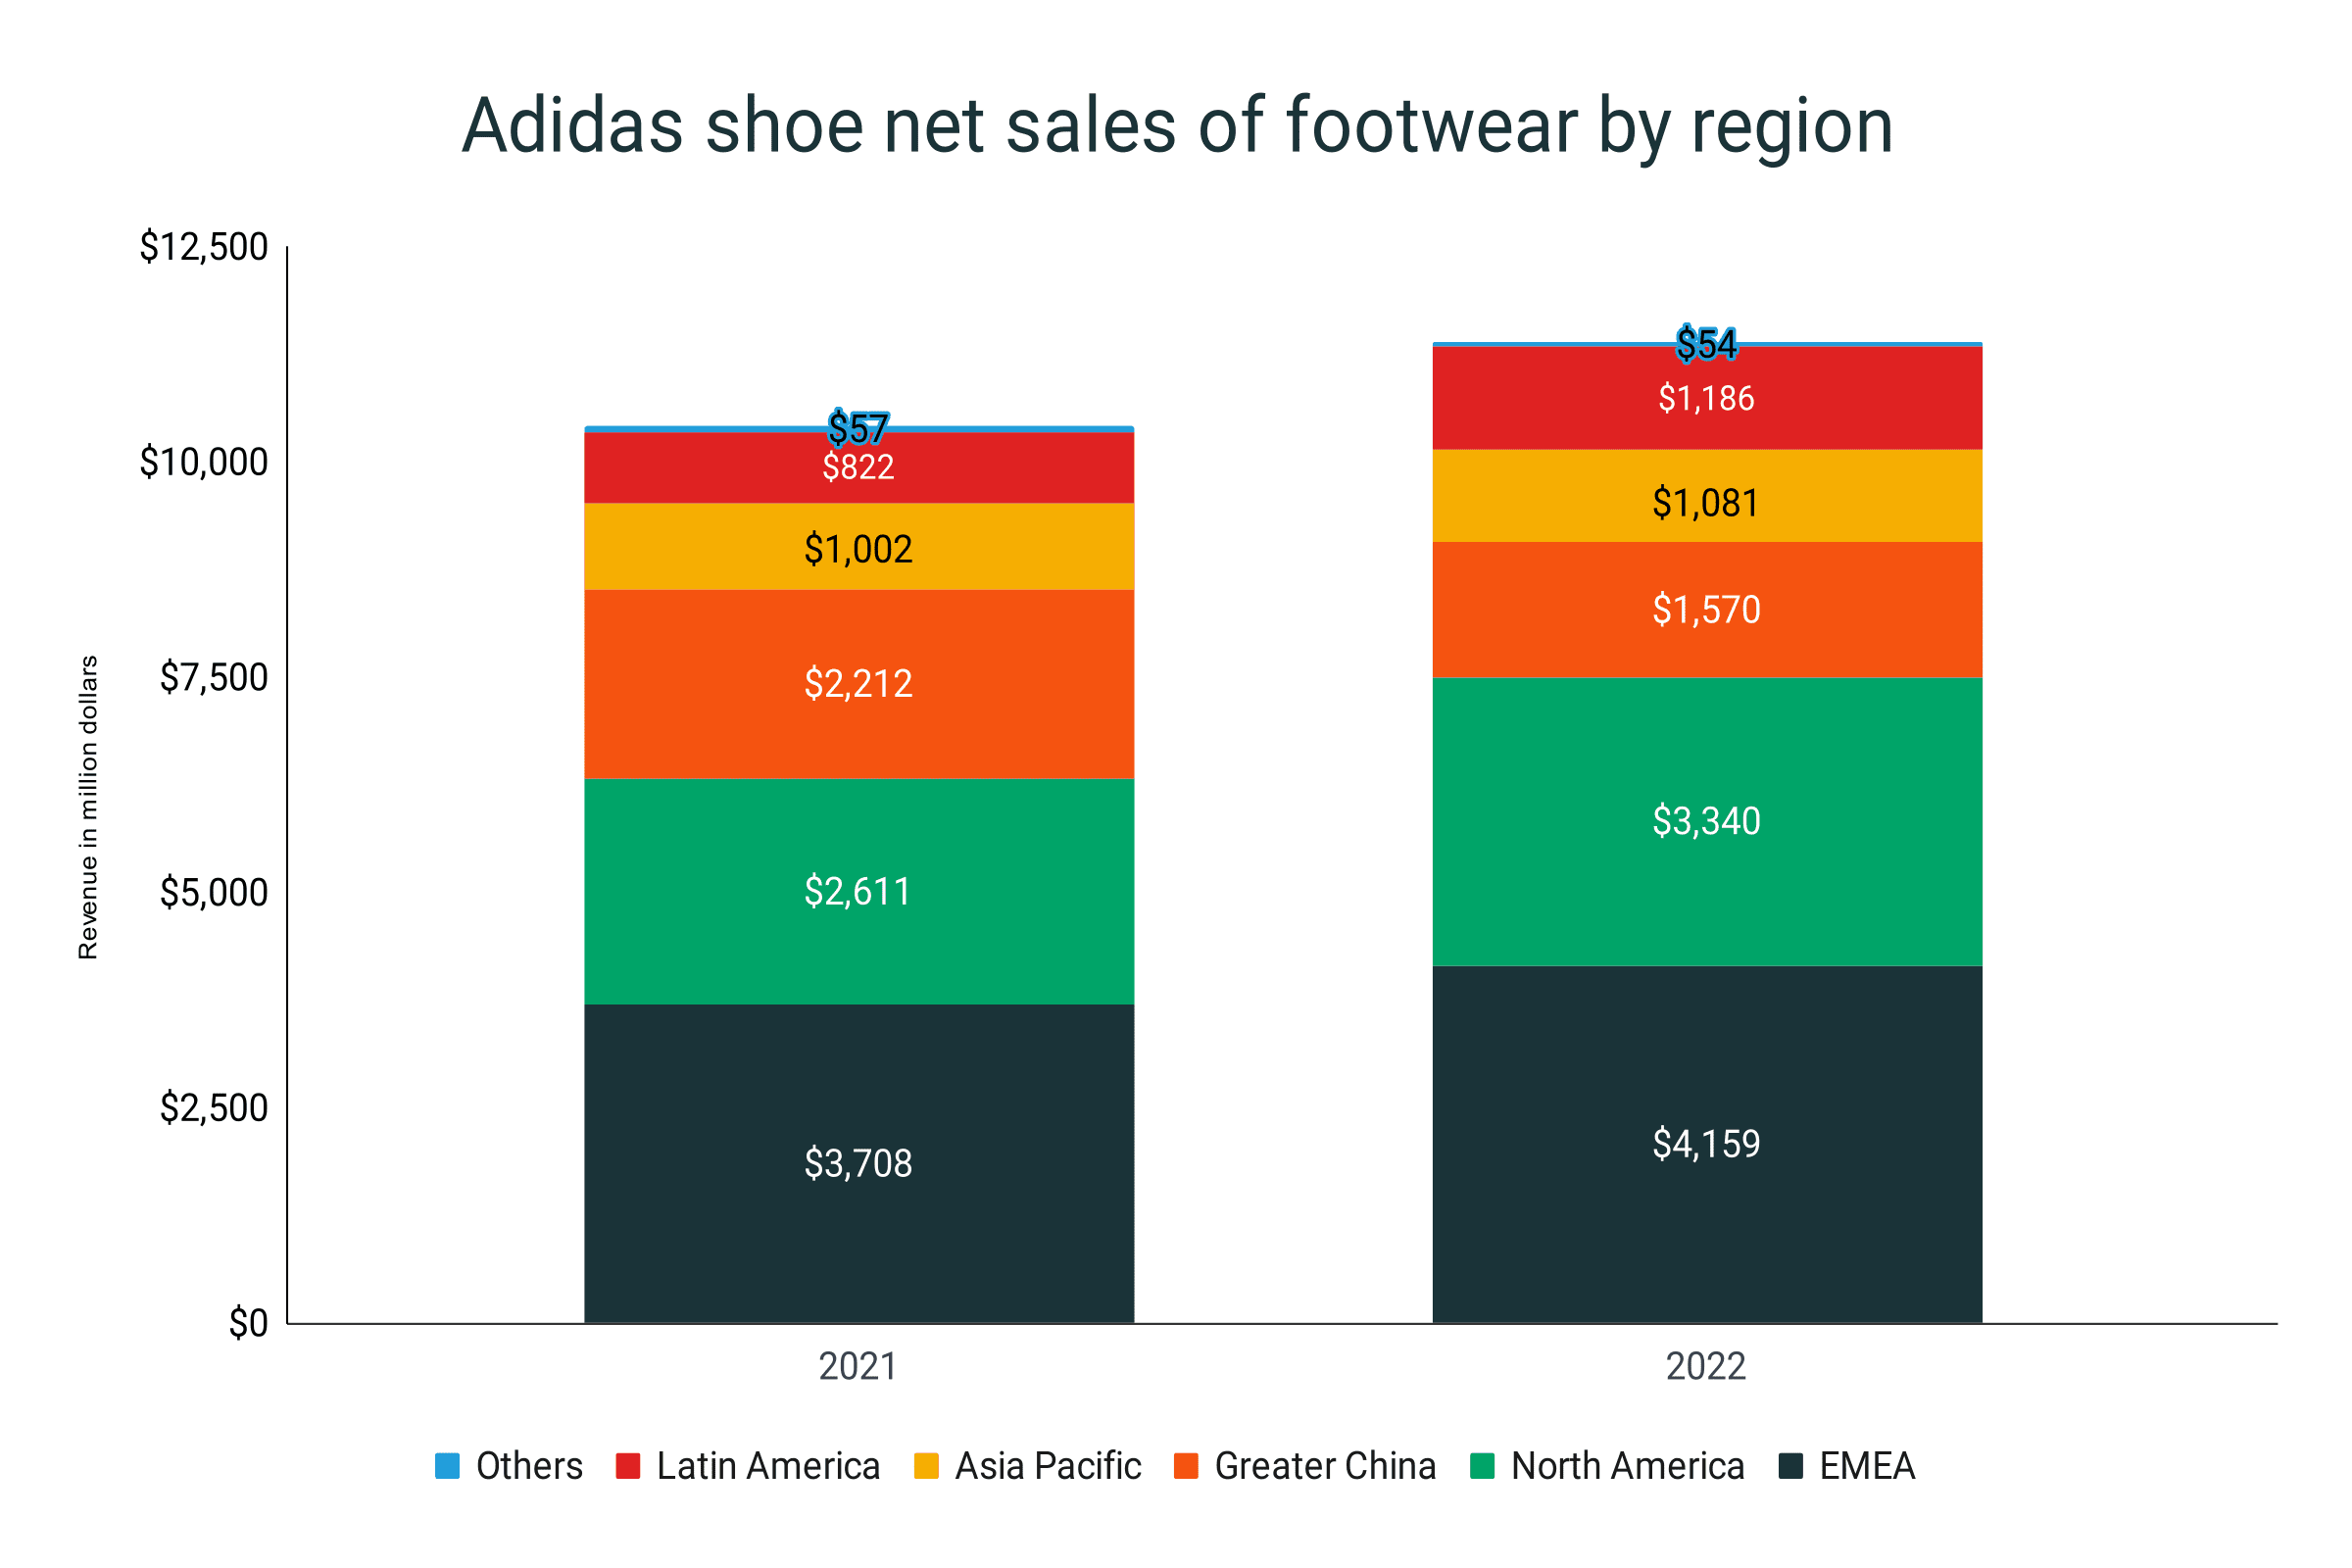
- When divided by region, Europe, Middle East, and Africa (EMEA) is the main revenue source of Adidas. The region tallied about $4.2 billion in 2022.
- In 2021, EMEA scored $3.7 billion in net sales. Meaning, Adidas shoe sales in the region grew by 12.2%.
- North America is the second biggest market of Adidas shoes with $3.3 billion and $2.6 billion in 2022 and 2021, respectively.
- The Greater China market of the Adidas shoe segment has experienced a drastic 29% decline from 2021 to 2022. It dropped from $2.2 billion to $1.6 billion in a span of one year.
- Asia Pacific registered $1 billion while $1.2 billion for Latin America in 2022.
- Latin America experienced the biggest growth in its net sales. It has increased by 44.3% between 2021 and 2022.
- Other market segments of Adidas shoes accounted for $57 million in 2021 and $54 million in 2022.
Adidas shoe net sales by region
|
Year |
Europe, Middle East, and Africa |
North America |
Greater China |
Asia Pacific |
Latin America |
Others |
|
2021 |
$3,708 |
$2,611 |
$2,212 |
$1,002 |
$822 |
$57 |
|
2022 |
$4,159 |
$3,340 |
$1,570 |
$1,081 |
$1,186 |
$54 |
|
% change |
12.2% |
27.9% |
-29.0% |
7.9% |
44.3% |
-5.3% |
Adidas athletic shoe statistics
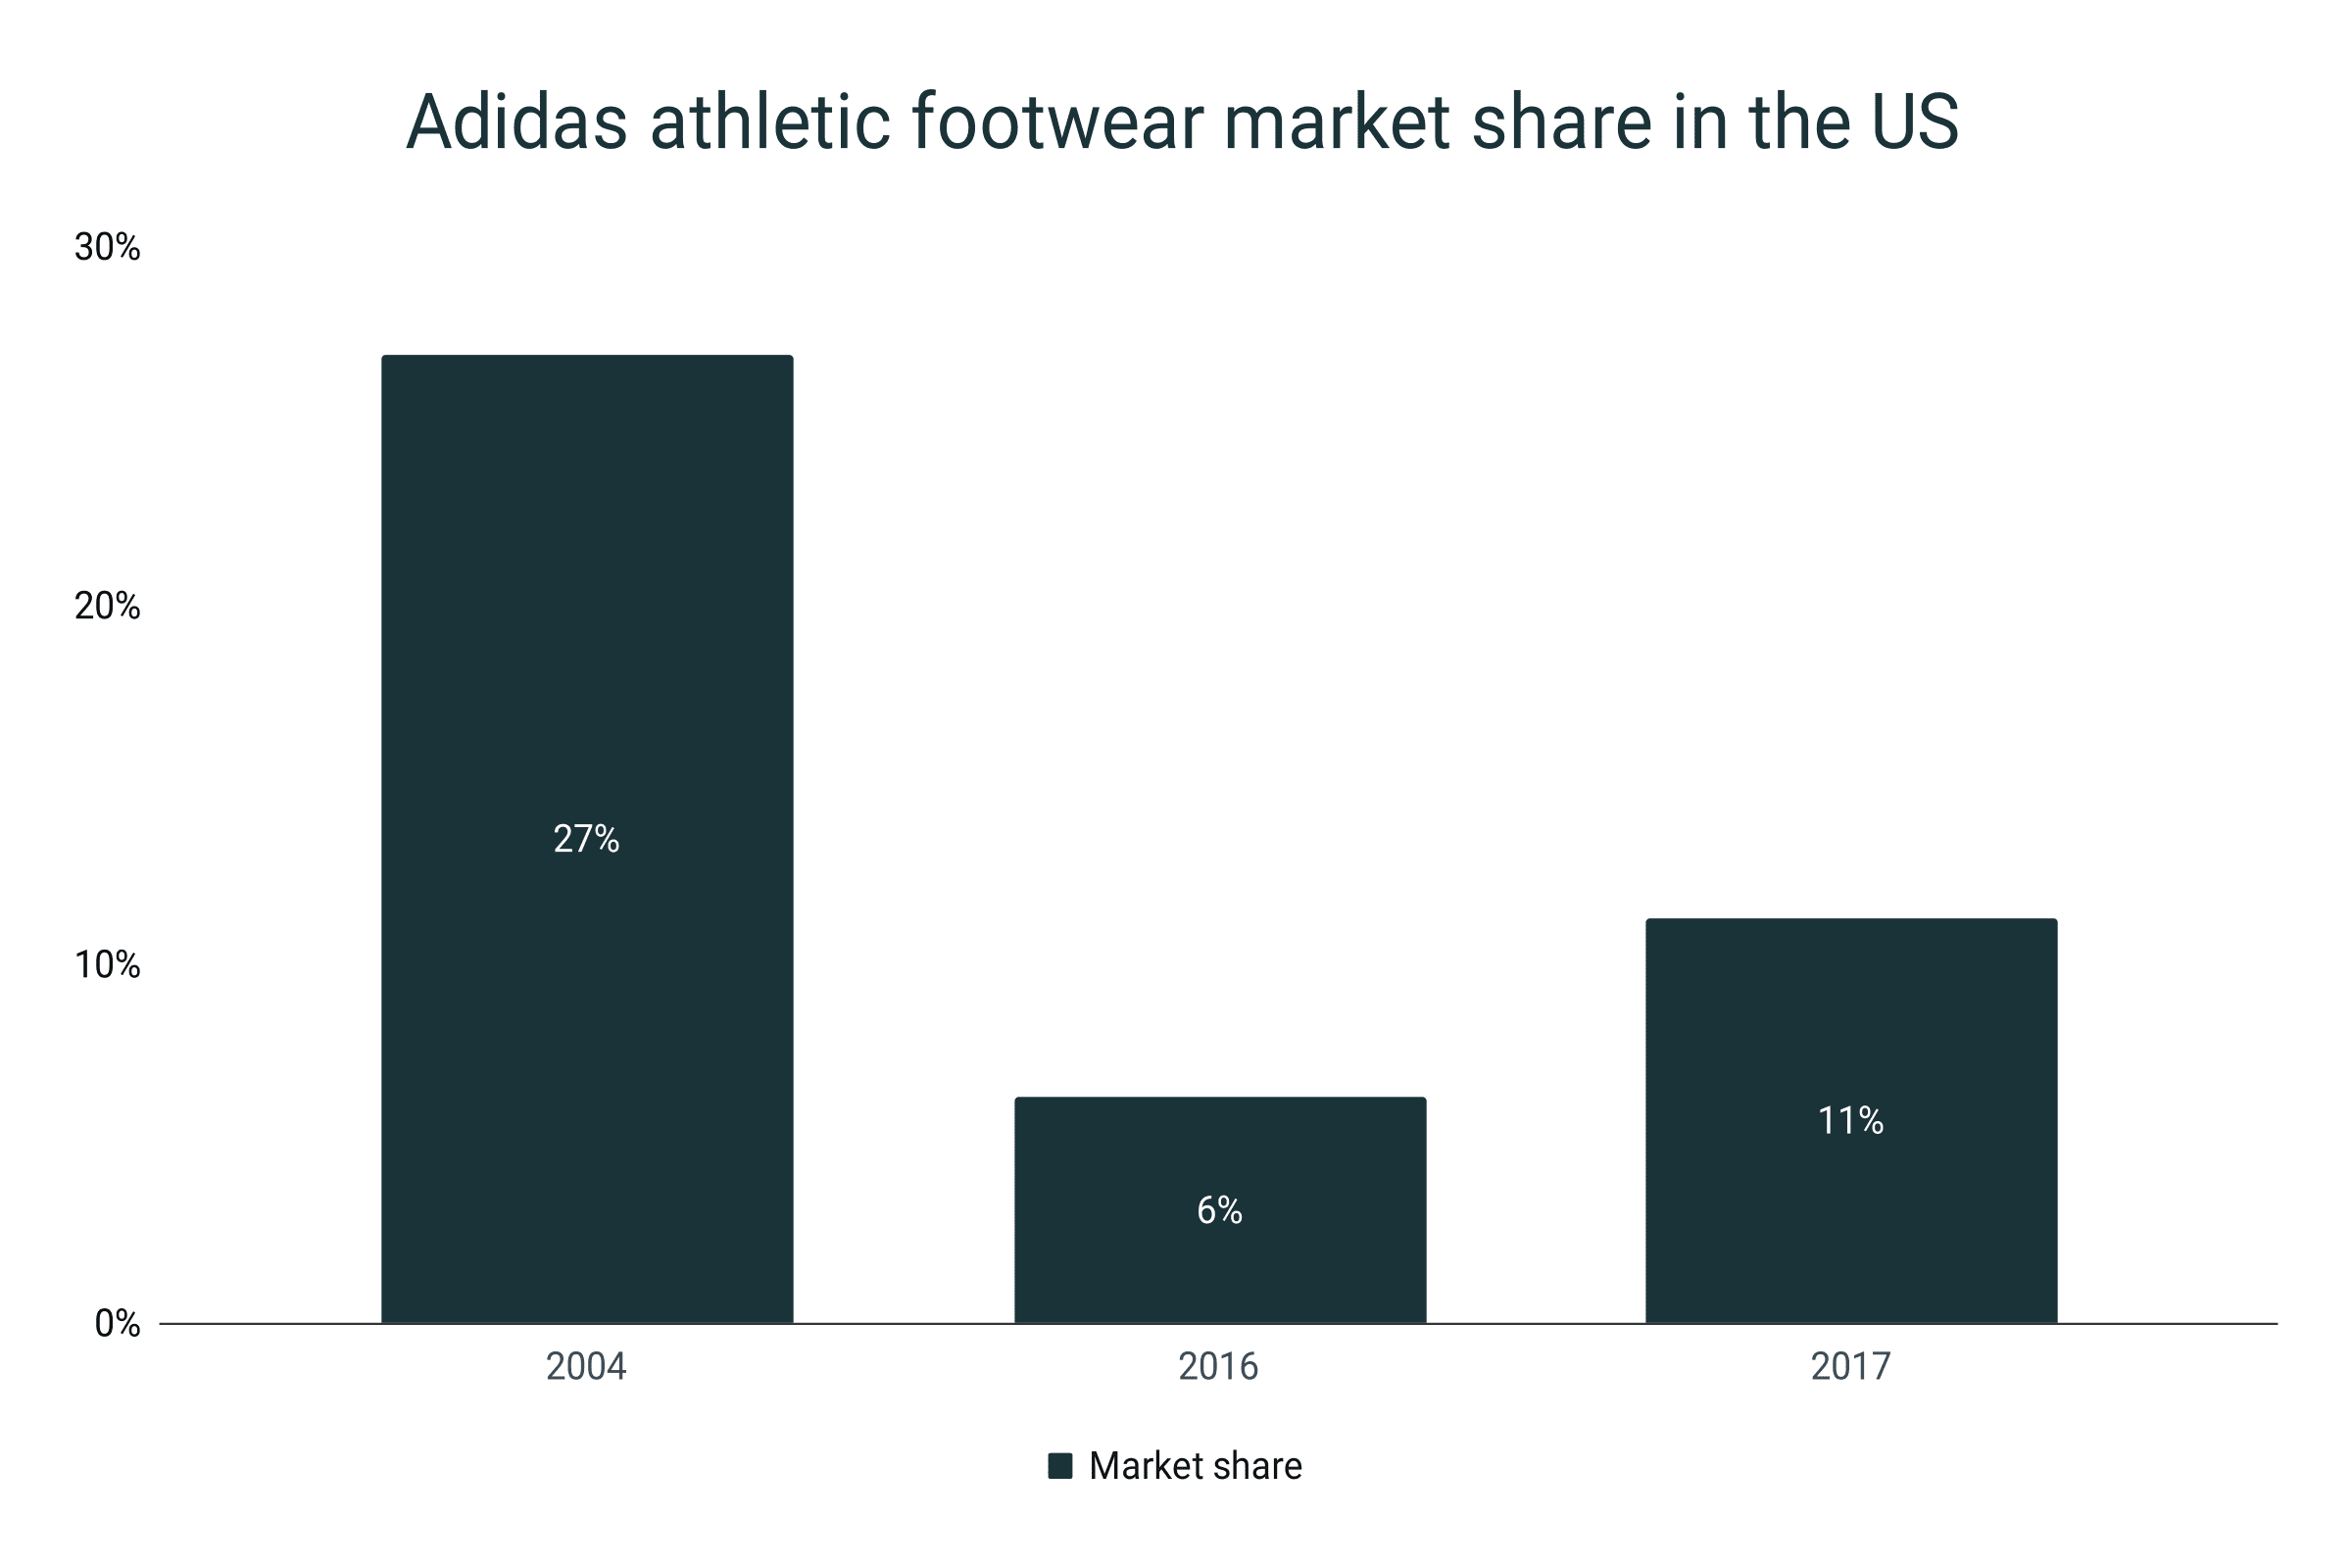
- In 2017, Adidas was able to crunch an 11.3% market share in the athletic footwear market in the United States.
- Previously, it took 6.3% of the market.
- Back in 2004, the Adidas athletic footwear market share amounted to 27%.
- Thus, since 2004, Adidas has lost 15.7 points in its athletic footwear market.
Adidas athletic footwear market share in the US
|
Year |
Market share |
|
2004 |
27% |
|
2016 |
6.3% |
|
2017 |
11.3% |
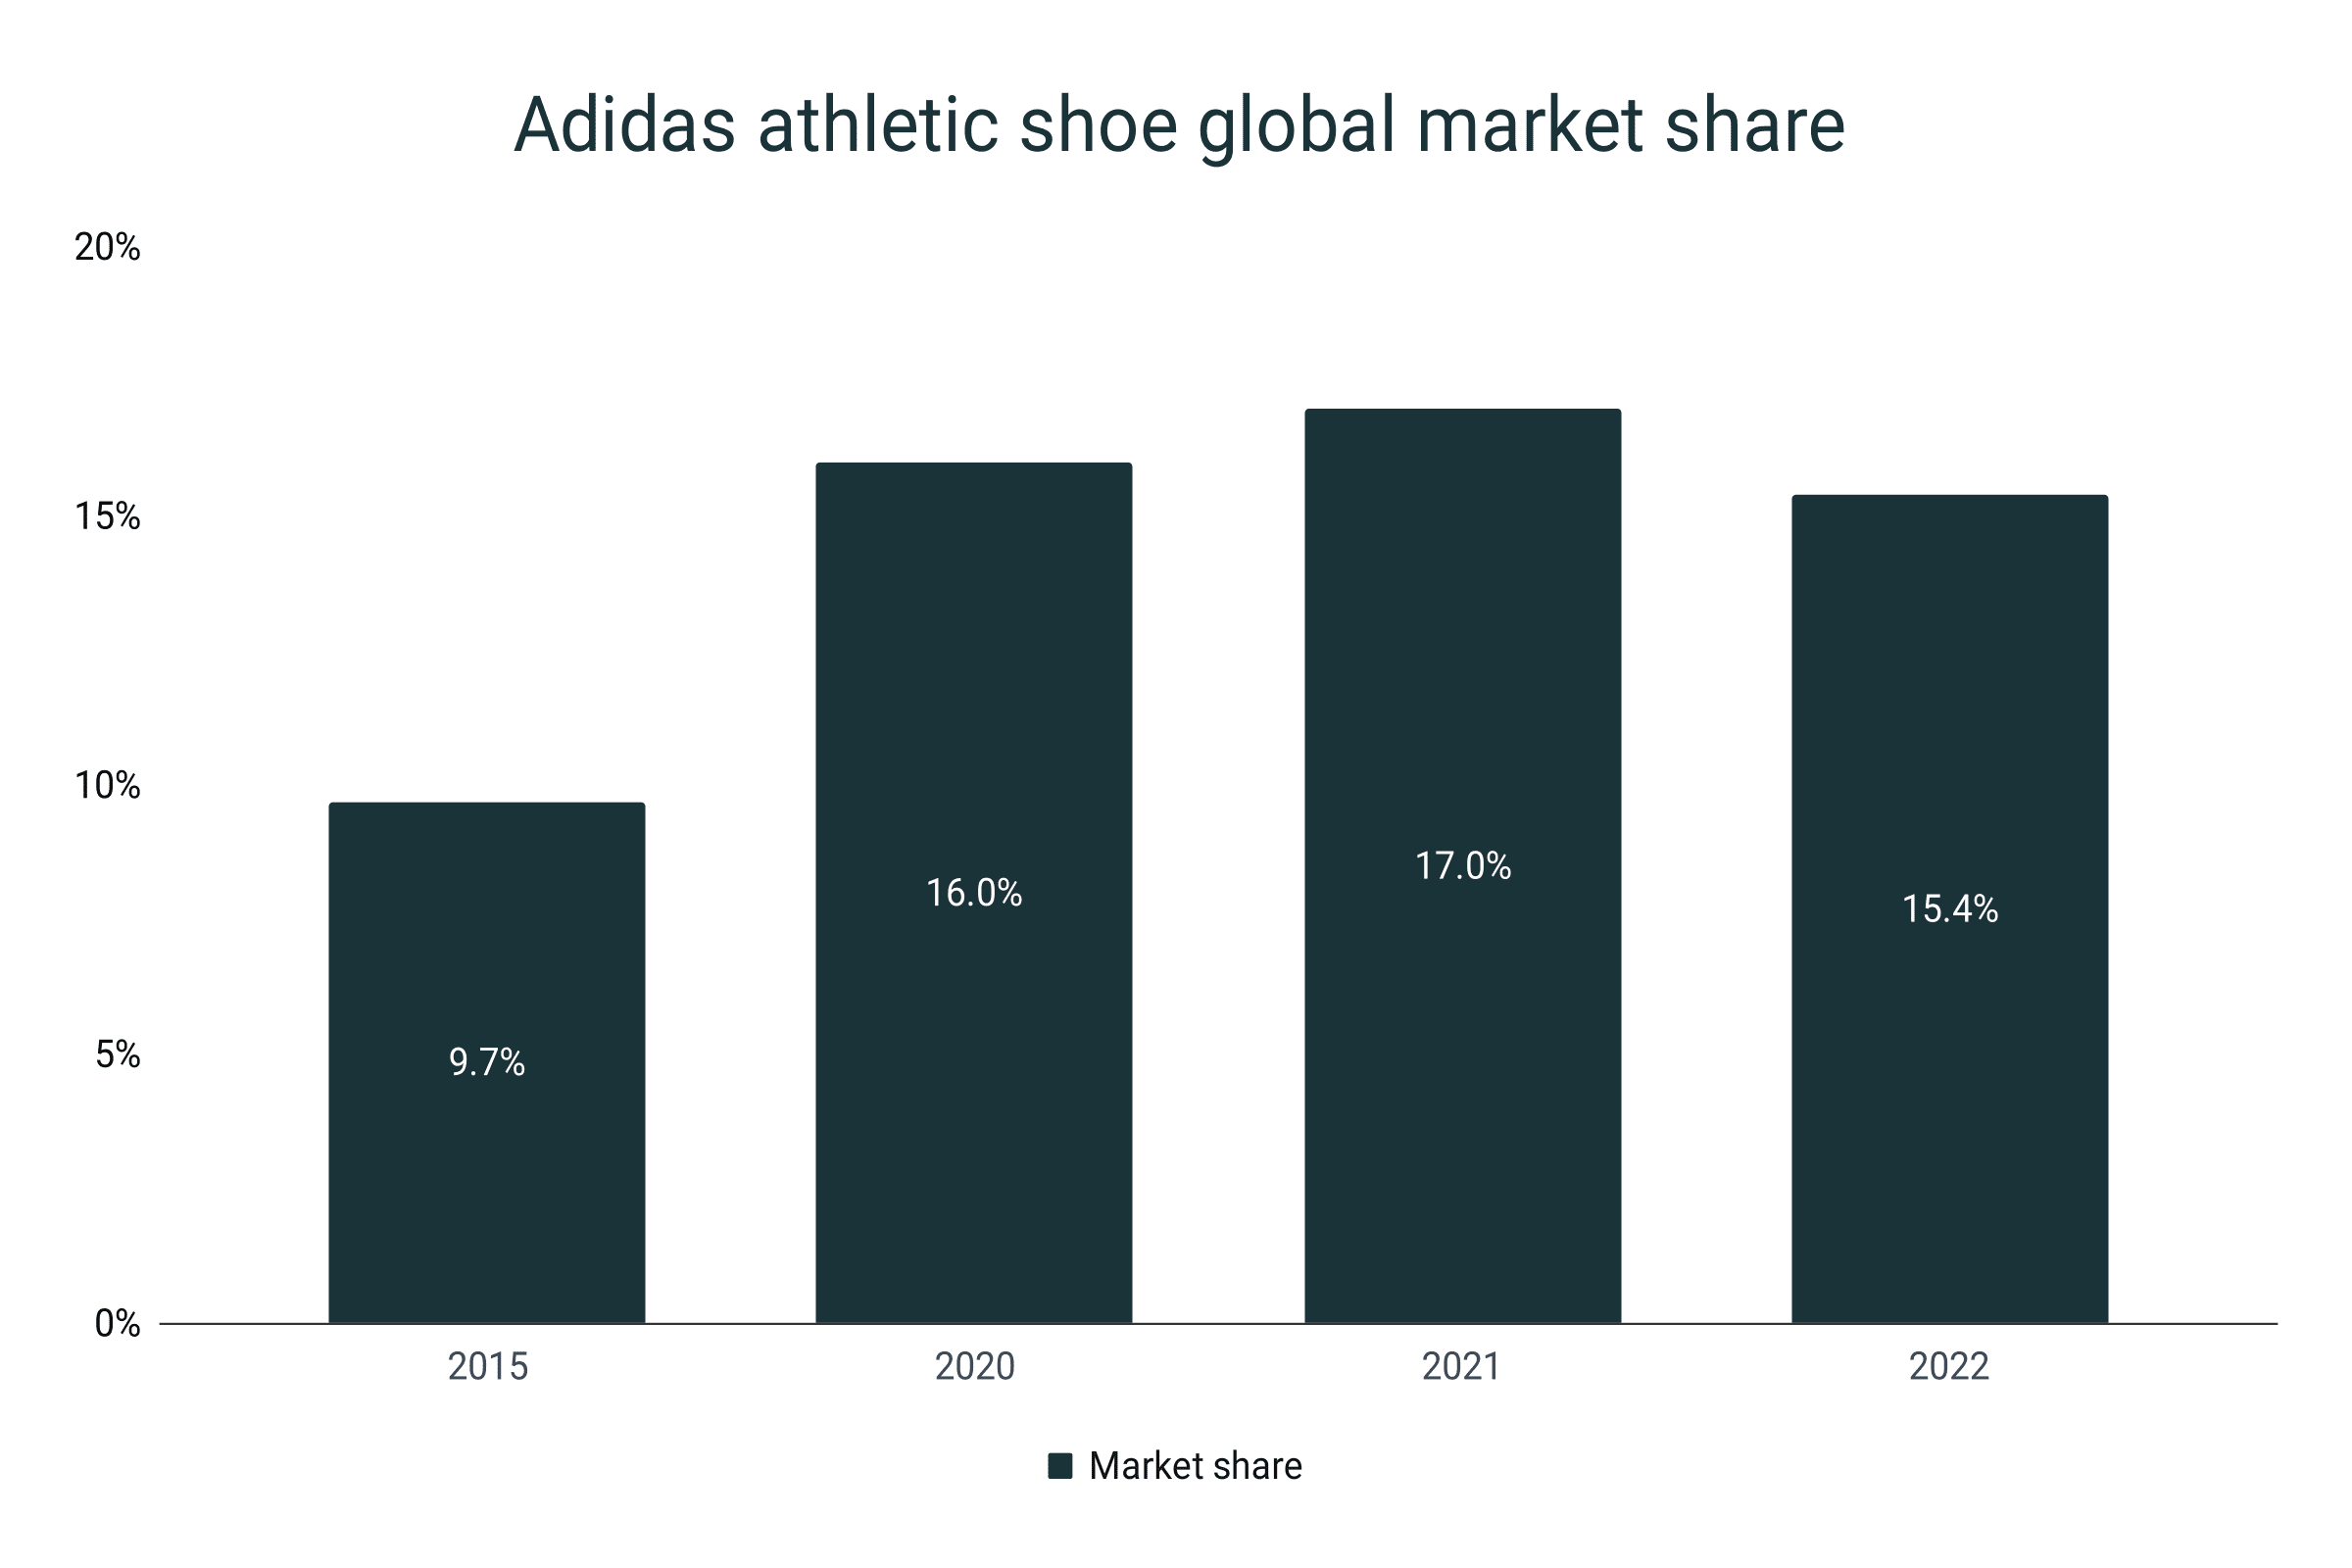
- As of 2022, the market share of Adidas in global athletic footwear equated to 15.4%.
- Previously, the brand’s stronghold is 17%, signifying a 1.6% decrease in the global arena.
- In 2015, Adidas took only 9.7% of the total athletic footwear market.
- By 2020, the market share is 16%. Then from 2020 to 2022, the three-year average is 16.1%.
Adidas athletic shoe global market share
|
Year |
Market share |
|
2015 |
9.7% |
|
2020 |
16% |
|
2021 |
17% |
|
2022 |
15.4% |
Adidas basketball shoe statistics
- During the 2021-22 National Basketball Association (NBA) season, 9.9% of the players used Adidas basketball shoes.
- This has posed a significant improvement compared to the 9.7% presence in the 2020-21 season.
- In the 2018-19 season, 15.8% of NBA players are using Adidas.
- During the 2019-20 and 2020-21 seasons, Adidas started to lose footing, posting 10.7% and 9.7% shares, respectively.
- On average, during the past four seasons of the NBA, 11.5% of all players have worn Adidas hoop shoes.
Percentage of NBA players using Adidas
|
Season |
Percent share |
|
2018-19 |
15.8% |
|
2019-20 |
10.7% |
|
2020-21 |
9.7% |
|
2021-22 |
9.9% |
|
Ave. (2018-22) |
11.5% |
Men vs. women Adidas shoe market
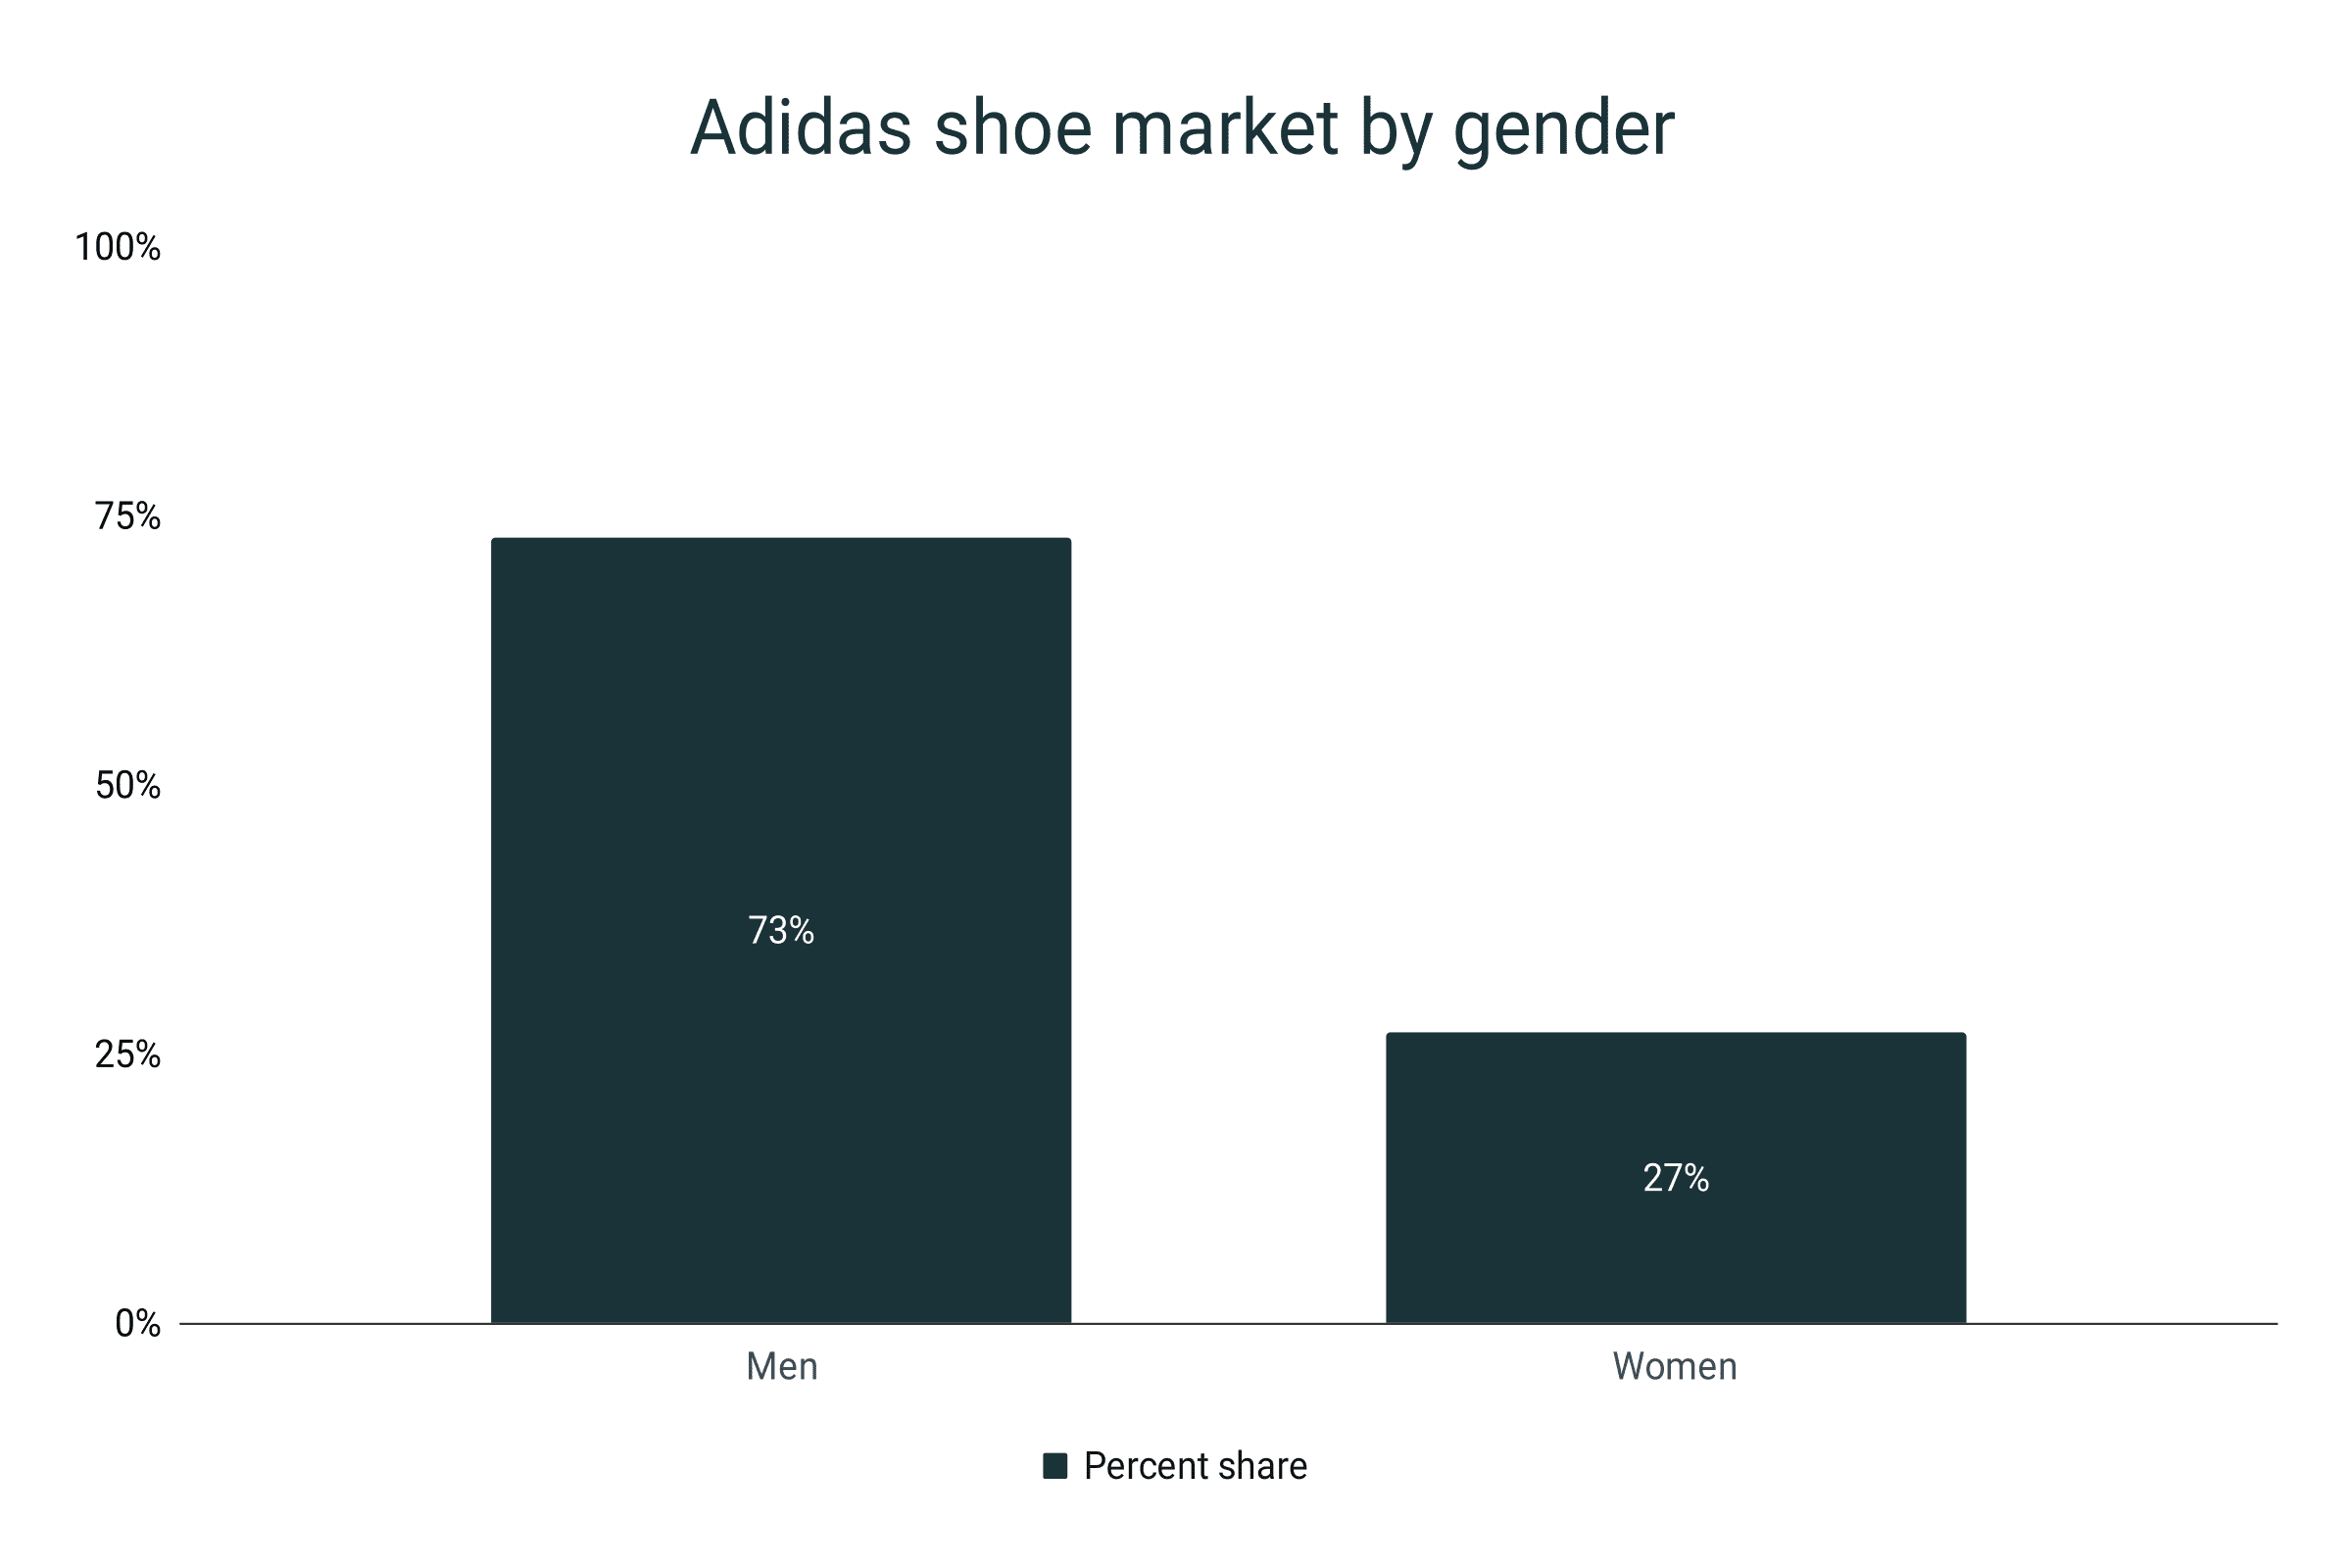
- Adidas is the most male-leaning shoe company with 73% of its market directed towards men.
- Consequently, its women-focused market is 27%.
- The disparity between the men and women end-user segment of Adidas is 46%.
- On average, footwear companies allocate 41.1% of their market to women. Meaning, Adidas is way below the average by 14.1%.
Adidas shoe market by gender
|
Gender |
Percent share |
|
Men |
73% |
|
Women |
27% |
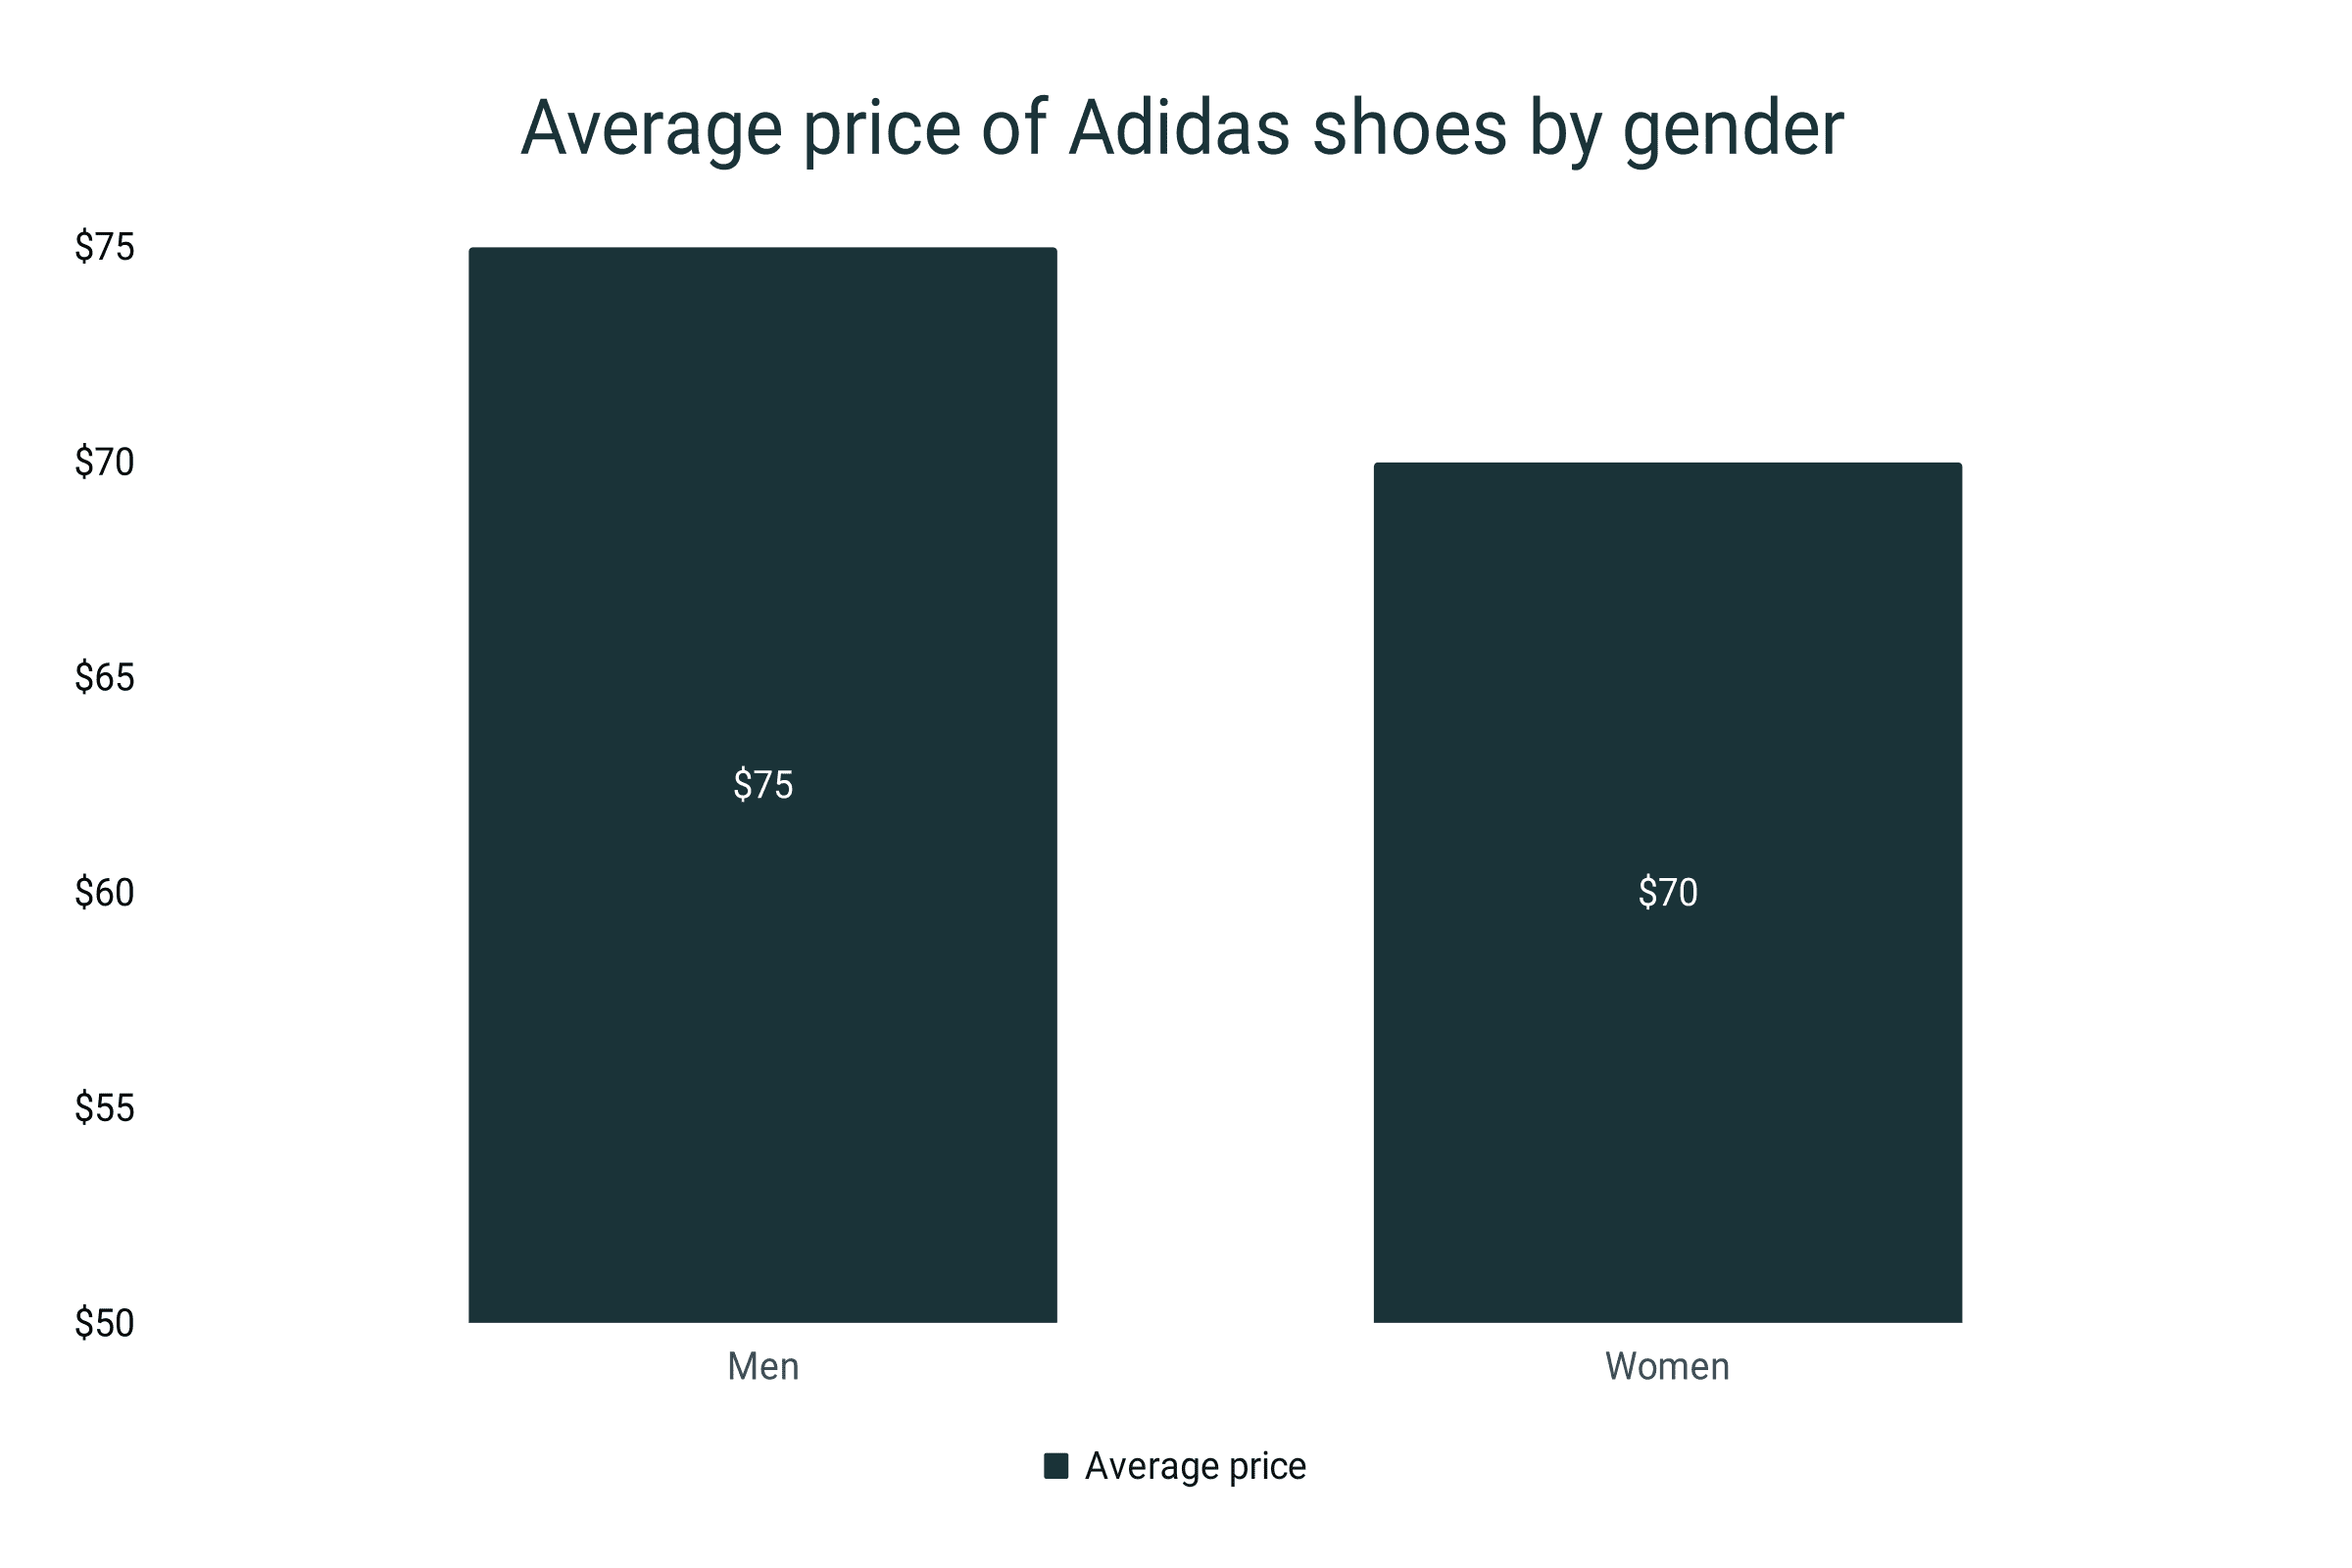
- In terms of prices, Adidas also reports that for-men shoes cost $75.
- The women-only shoes of Adidas, on the other hand, costs $70.
- For-her shoes by Adidas costs $5 less compared to its men’s footwear products.
Average price of Adidas shoes by gender
|
Gender |
Average price |
|
Men |
$75 |
|
Women |
$70 |
Adidas shoe resale market
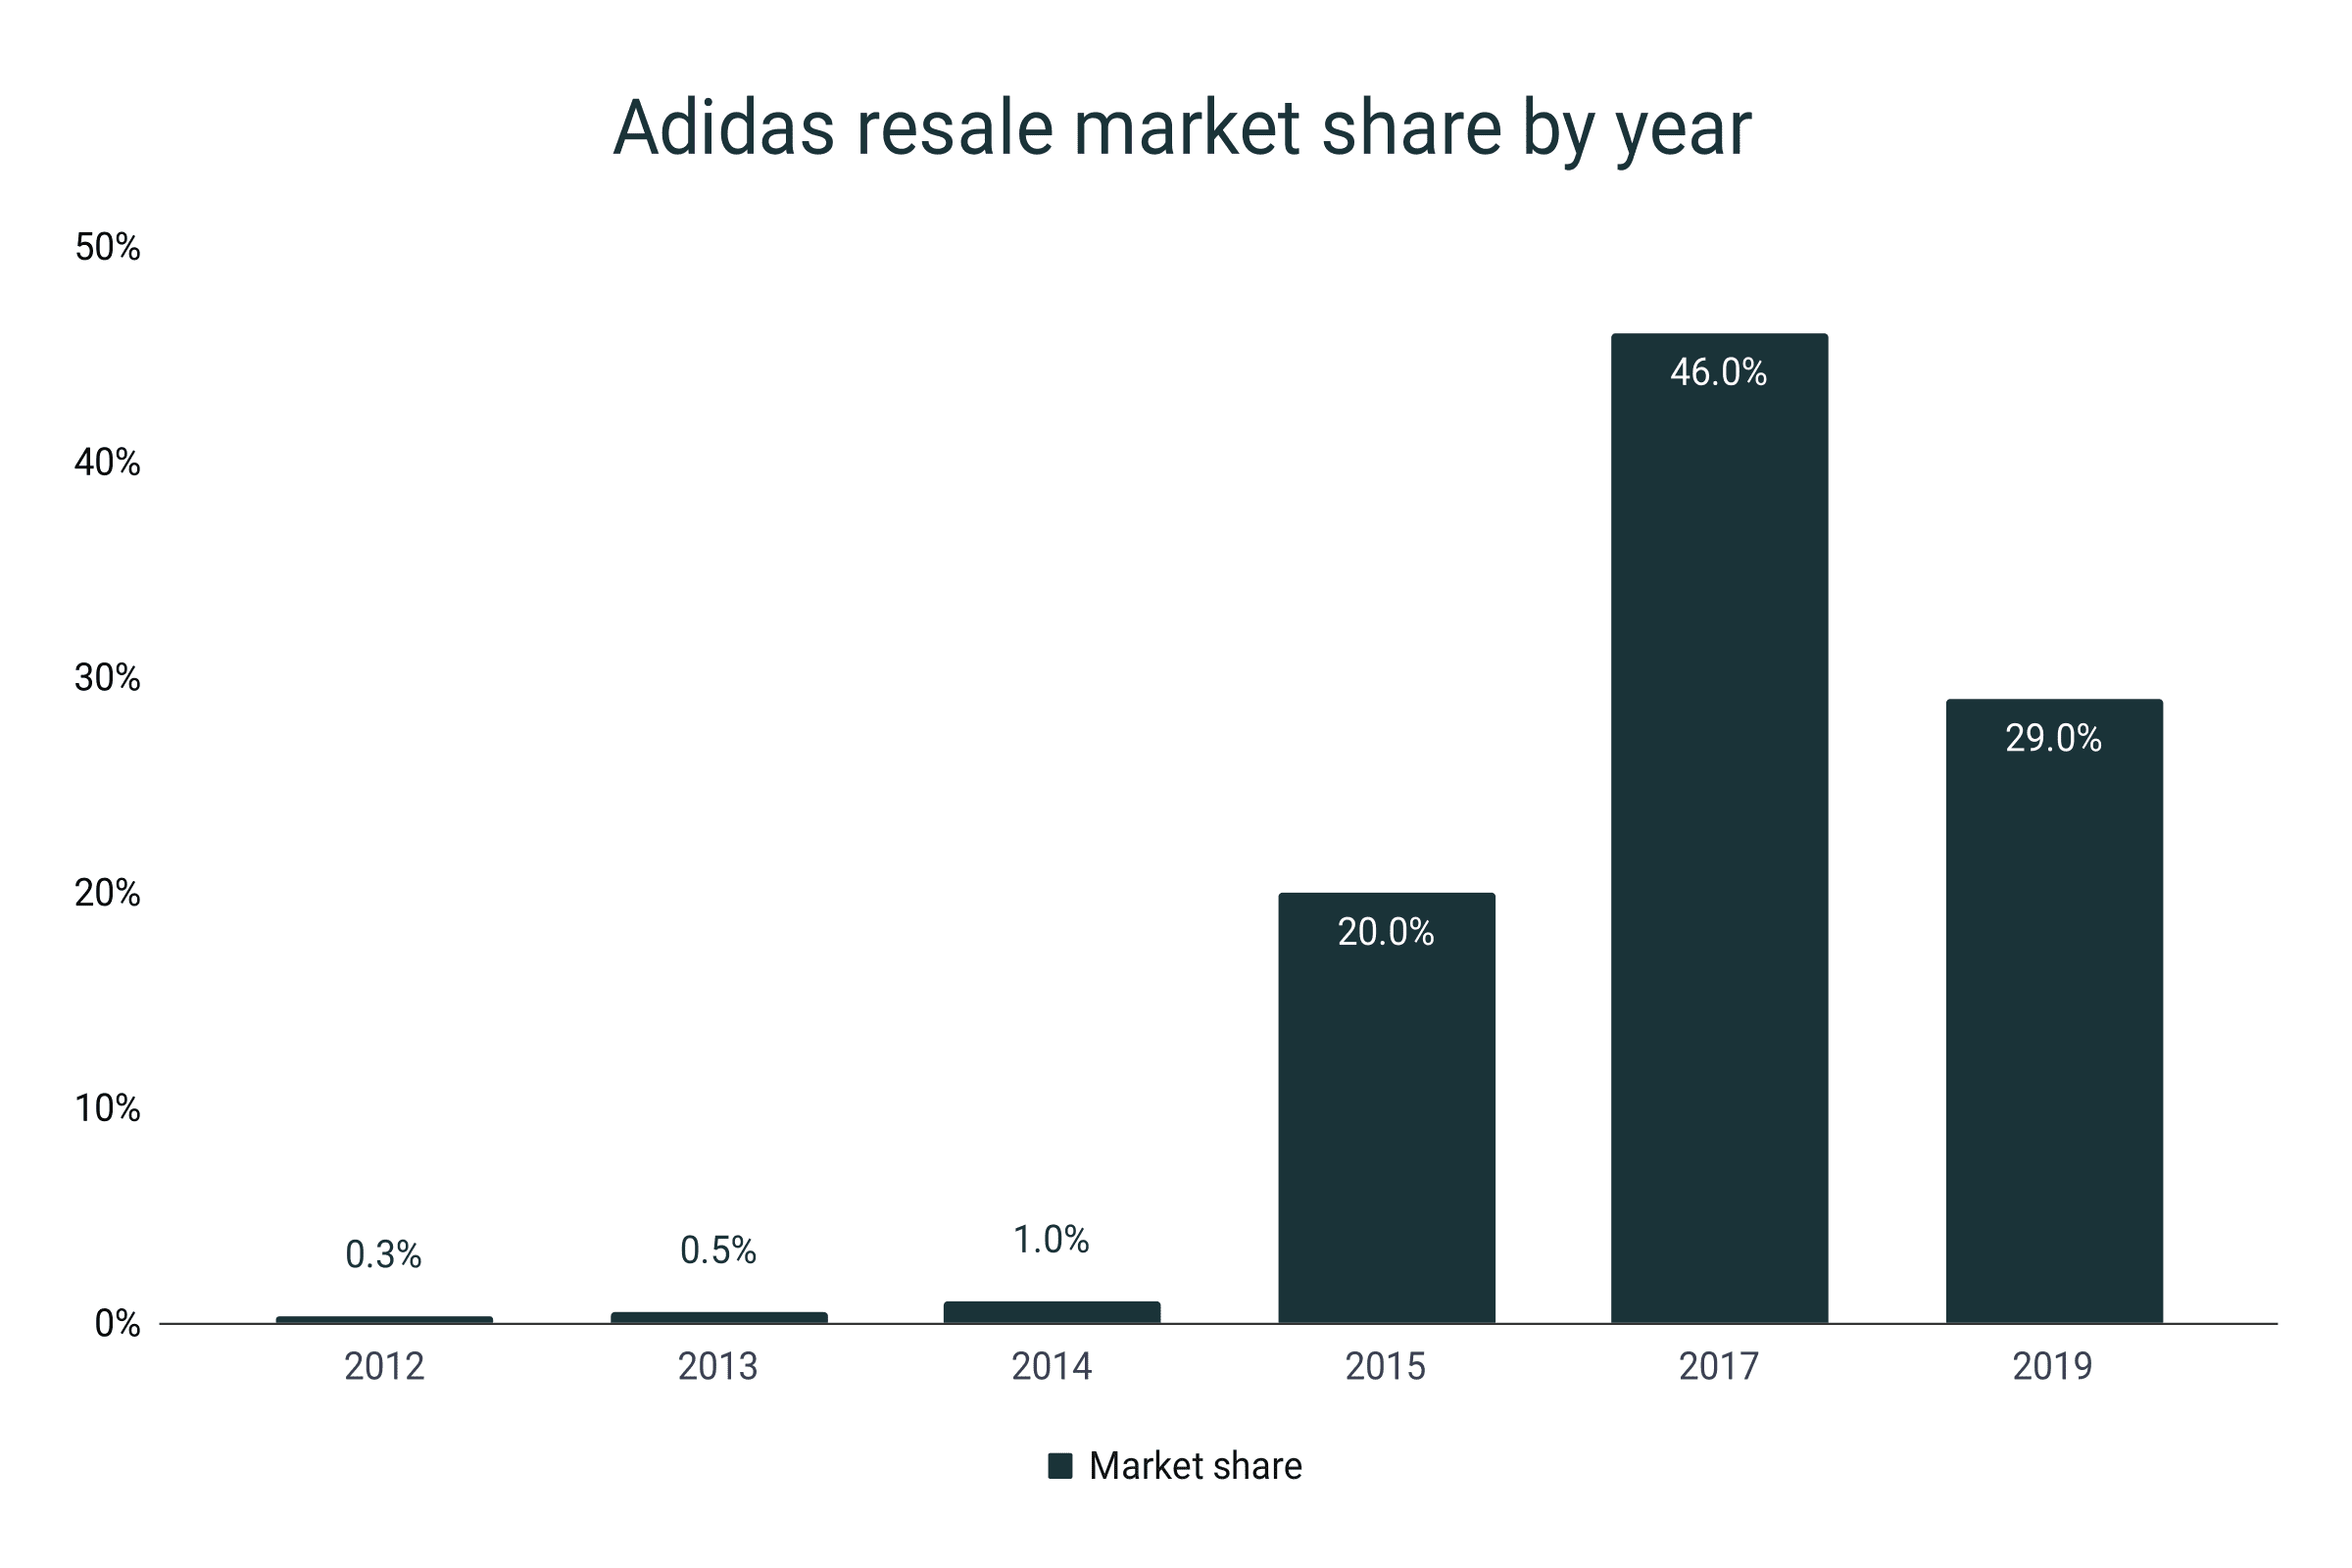
- By 2019, the secondary sneaker market of Adidas grasped a 29% portion.
- This is 17 points lower than the 2017 share which reached 46% in 2017.
- In 2012, Adidas held only a 0.3% share in the secondary shoe market.
- It slowly climbed to 0.5% in 2013 and reach 1% by 2014.
- In the 2012-2019 period, Adidas was able to pump its resale market by an additional 28.7% market share.
Adidas resale market share by year
|
Year |
Market share |
|
2012 |
0.3% |
|
2013 |
0.5% |
|
2014 |
1% |
|
2015 |
20% |
|
2017 |
46% |
|
2019 |
29% |
- The Adidas Yeezy 350 is the second most resold sneaker today with an 18% market share.
- It resells for $280 on average, a 27.3% premium compared to its $220 original retail price.
- Meanwhile, the average resale price of an Adidas show is $295.
- This is equivalent to an average price premium of 36%.
- Over 10,000 pairs of Yeezy 350 Clay were resold in China in 2019.
Adidas shoe resale price and premium
|
Ave. reselling price |
Premium |
|
|
Adidas |
$295 |
36% |
|
Adidas Yeezy 350 |
$280 |
27.3% |
Adidas shoe production
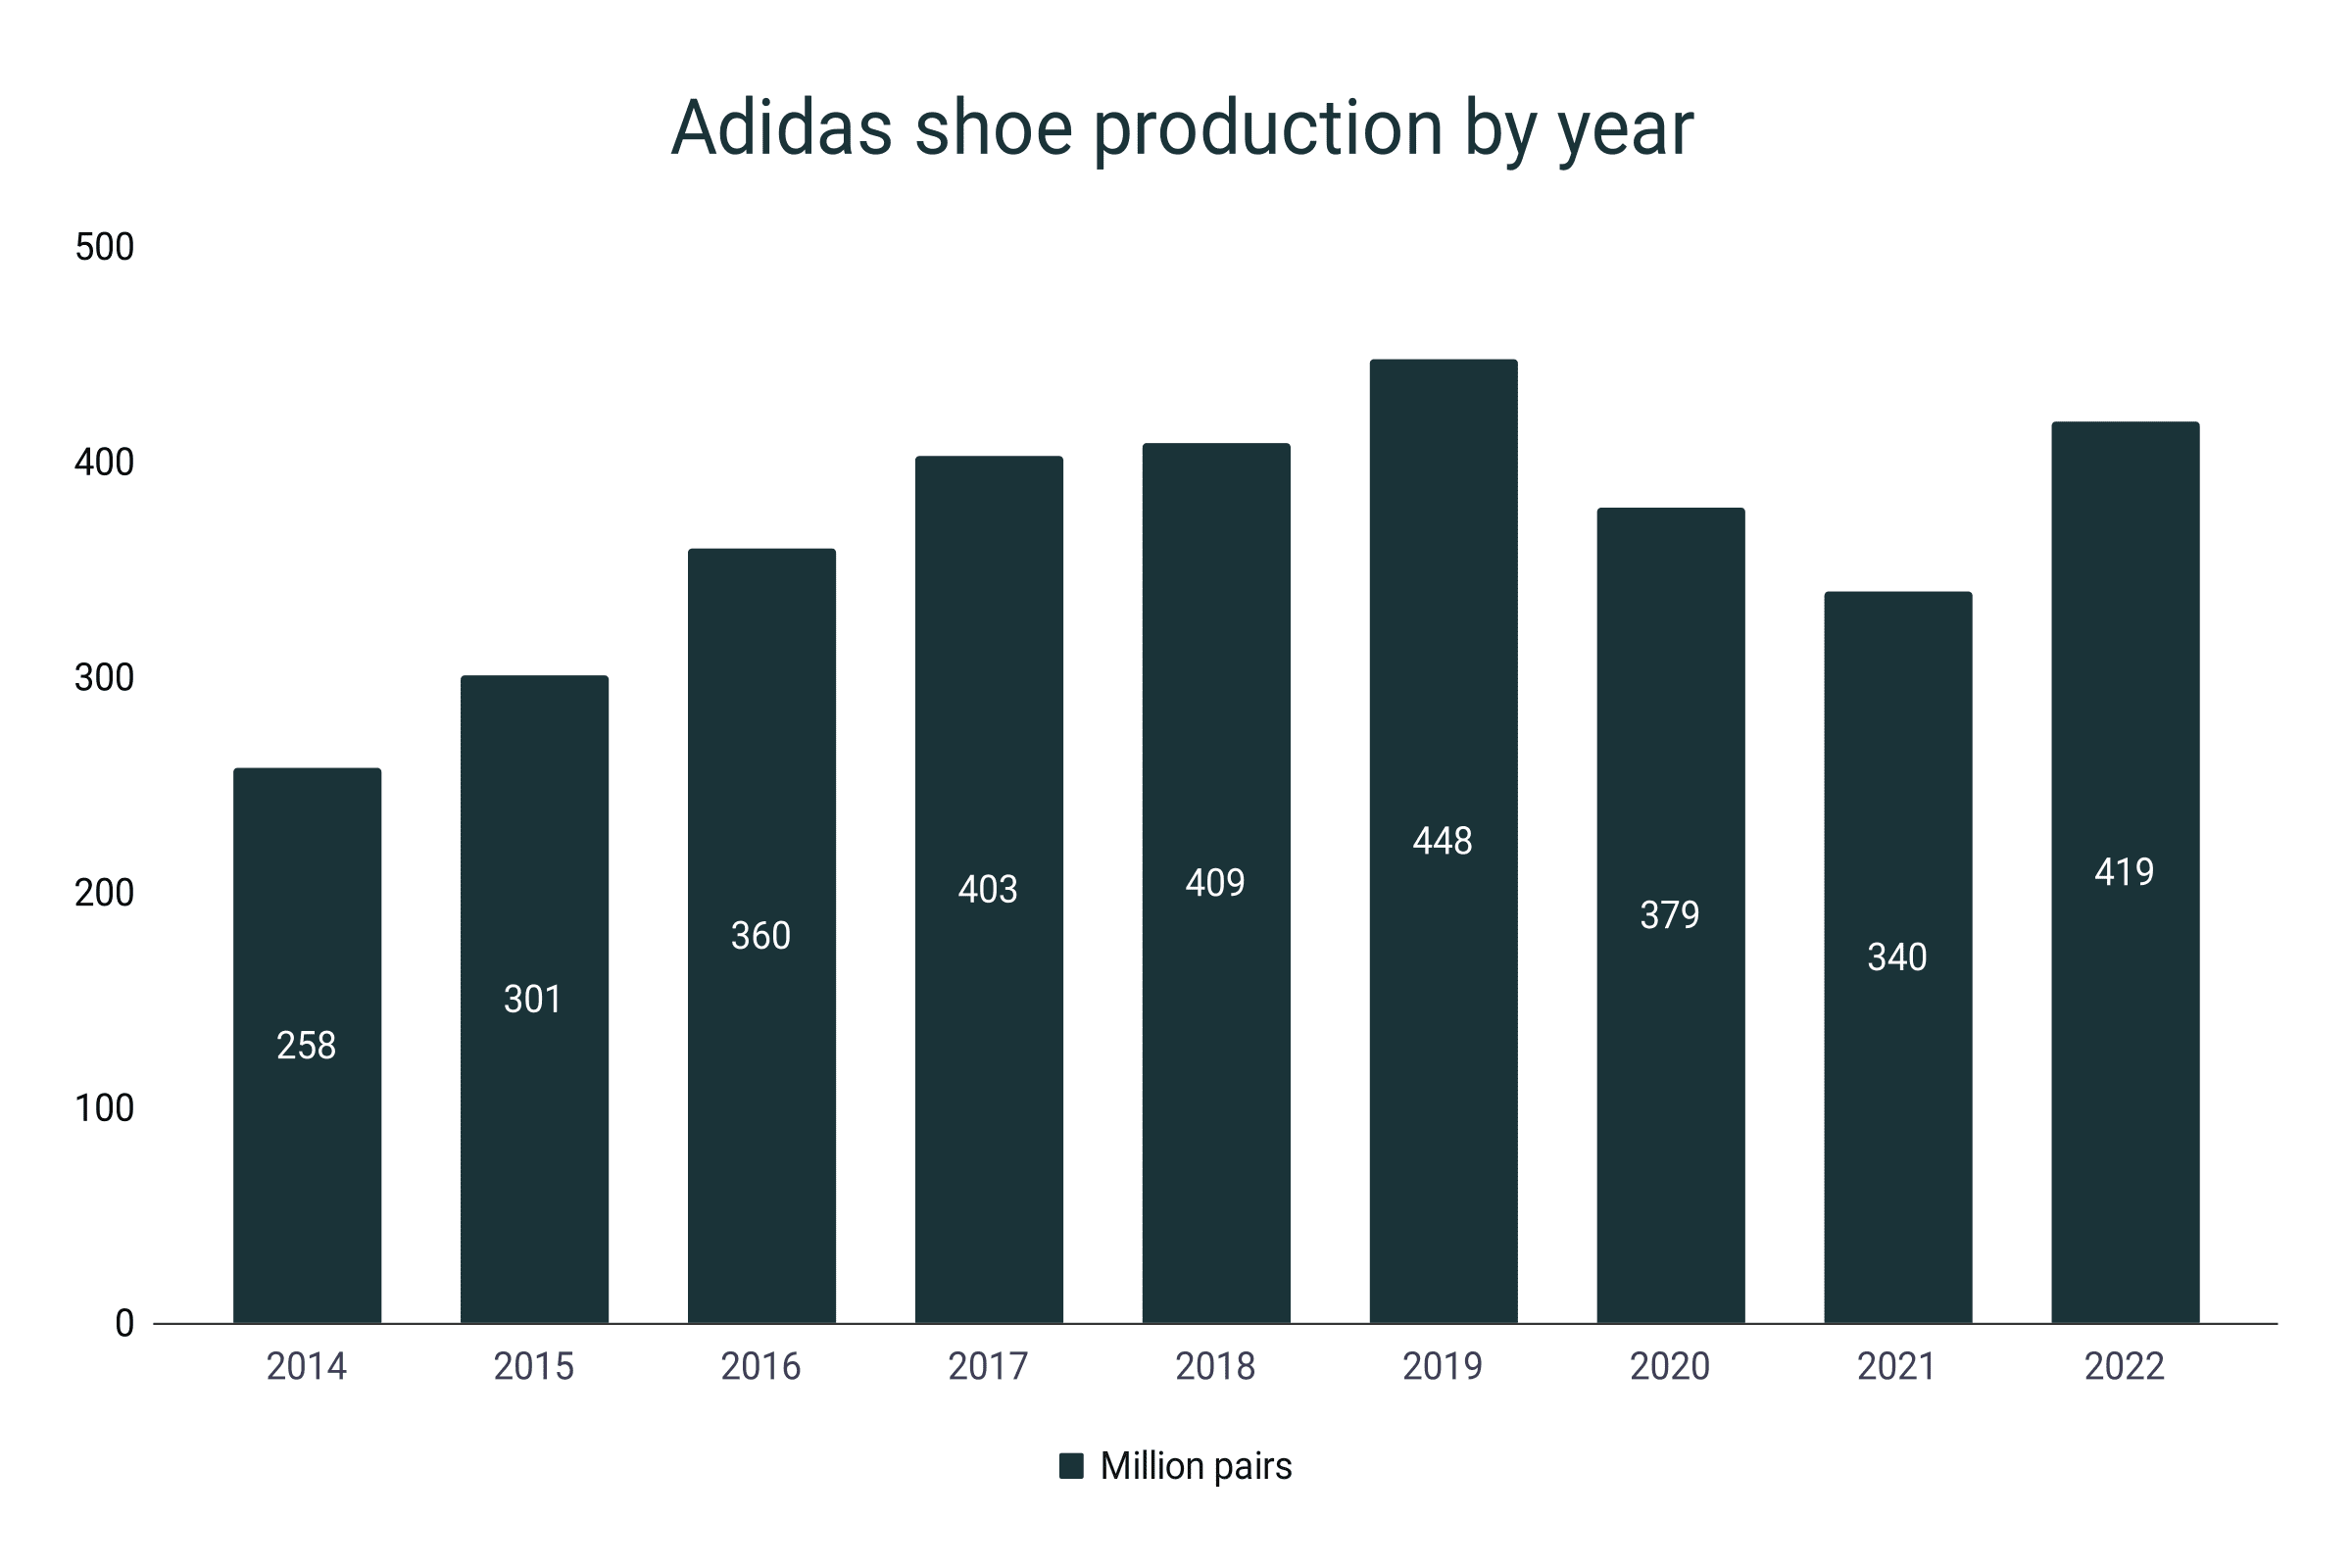
- A total of 419 million pairs of shoes were manufactured by Adidas in 2022.
- In 2021, the number is 340 million, meaning the company was able to increase shoe production by 23%.
- Since the pandemic, the shoe production of the company experienced a steady decline of 15% and 10% in 2020 and 2021, respectively.
- Back in 2014, Adidas totaled 258 million shoes produced.
- It blew up by 17% in 2015, reaching the 300+ million mark.
- From 2014 to 2022, Adidas boosted its manufacturing by 62.4%.
Adidas shoe production by year
|
Year |
Million pairs |
Growth |
|
2014 |
258 |
|
|
2015 |
301 |
17% |
|
2016 |
360 |
20% |
|
2017 |
403 |
12% |
|
2018 |
409 |
1% |
|
2019 |
448 |
10% |
|
2020 |
379 |
-15% |
|
2021 |
340 |
-10% |
|
2022 |
419 |
23% |
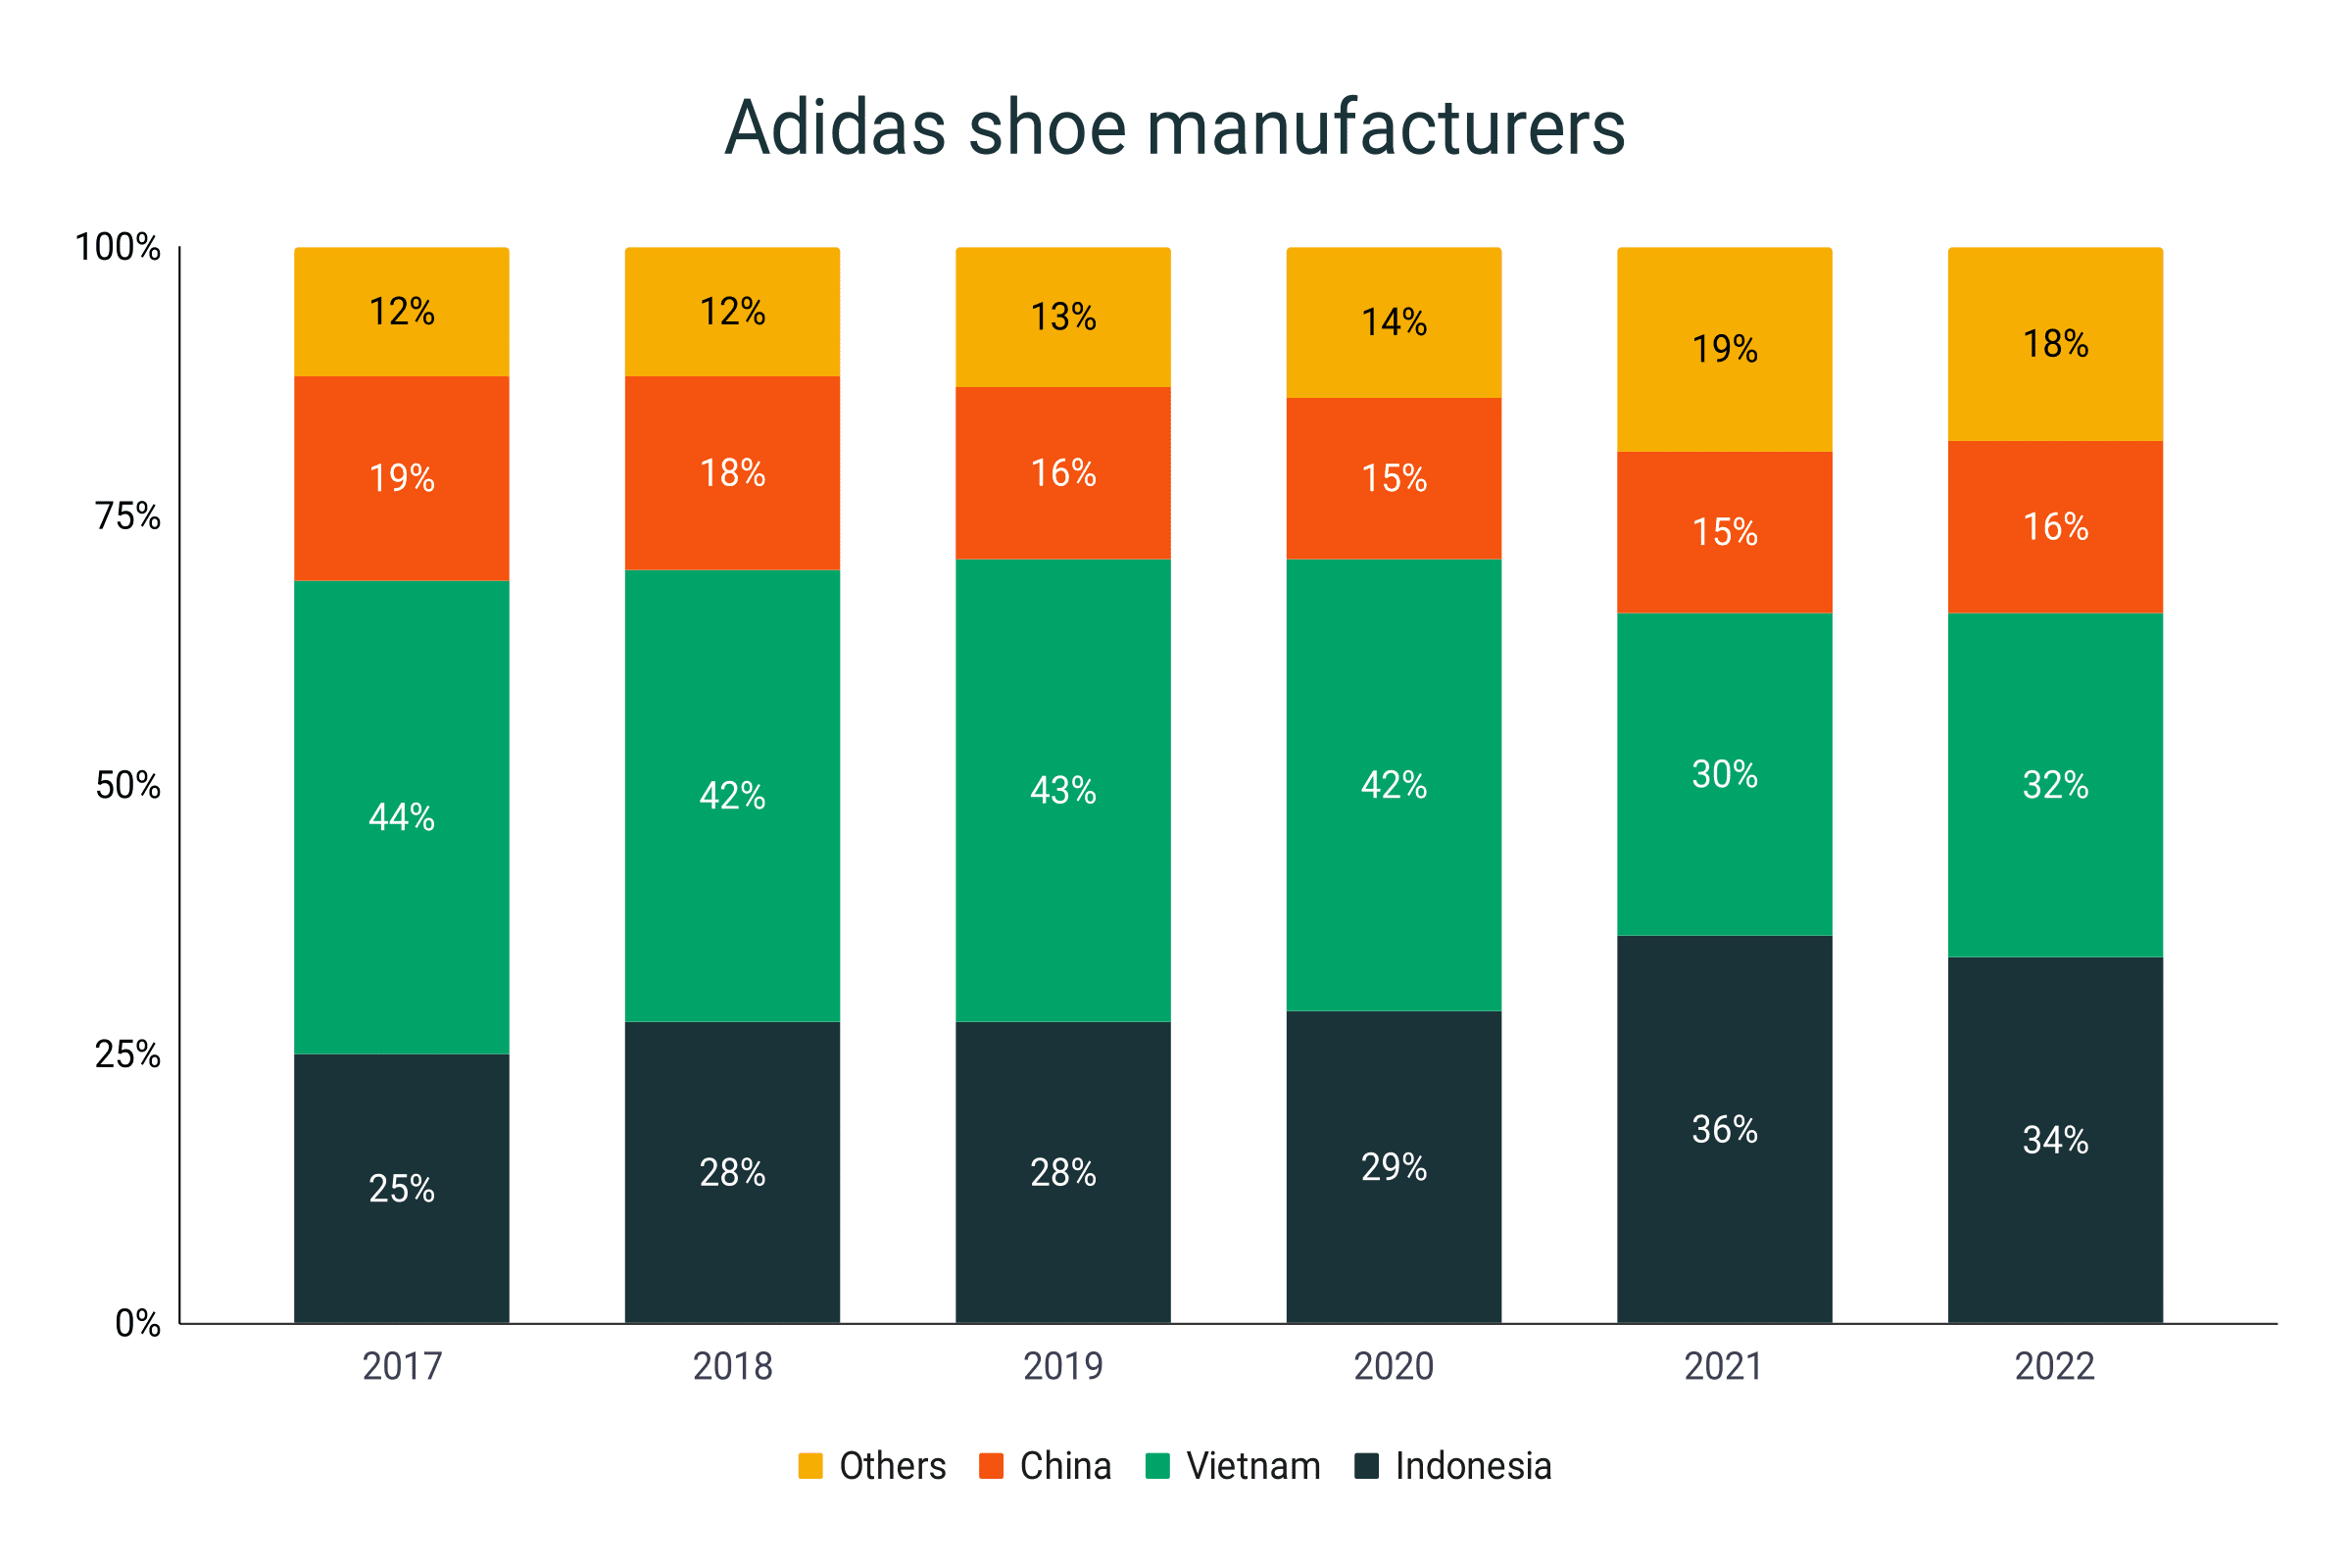
- In 2022, 97% of all Adidas shoes were manufactured in Asia.
- Indonesia has been the top shoe manufacturer for Adidas footwear. It snatched a 34% share in 2022 and 36% in 2021, overtaking Vietnam.
- Vietnam is now the second biggest manufacturer of Adidas shoes with 32% and 30% in 2022 and 2021, respectively.
- In 2020, Vietnam enjoyed a 42% portion of all manufactured Adidas shoes. Indonesia had 29%.
- The six-year average of Indonesia and Vietnam, from 2017-2022, is 30% and 38.8%, respectively.
- China is the third biggest supplier of Adidas footwear products. From 2017-22, it held an average of 16.5% share.
- Meanwhile, the rest of the countries combined are the origin of 18% of all Adidas shoes manufactured in 2022.
Adidas shoe manufacturers
|
Year |
Indonesia |
Vietnam |
China |
Others |
|
2017 |
25% |
44% |
19% |
12% |
|
2018 |
28% |
42% |
18% |
12% |
|
2019 |
28% |
43% |
16% |
13% |
|
2020 |
29% |
42% |
15% |
14% |
|
2021 |
36% |
30% |
15% |
19% |
|
2022 |
34% |
32% |
16% |
18% |
Adidas footwear sustainability statistics
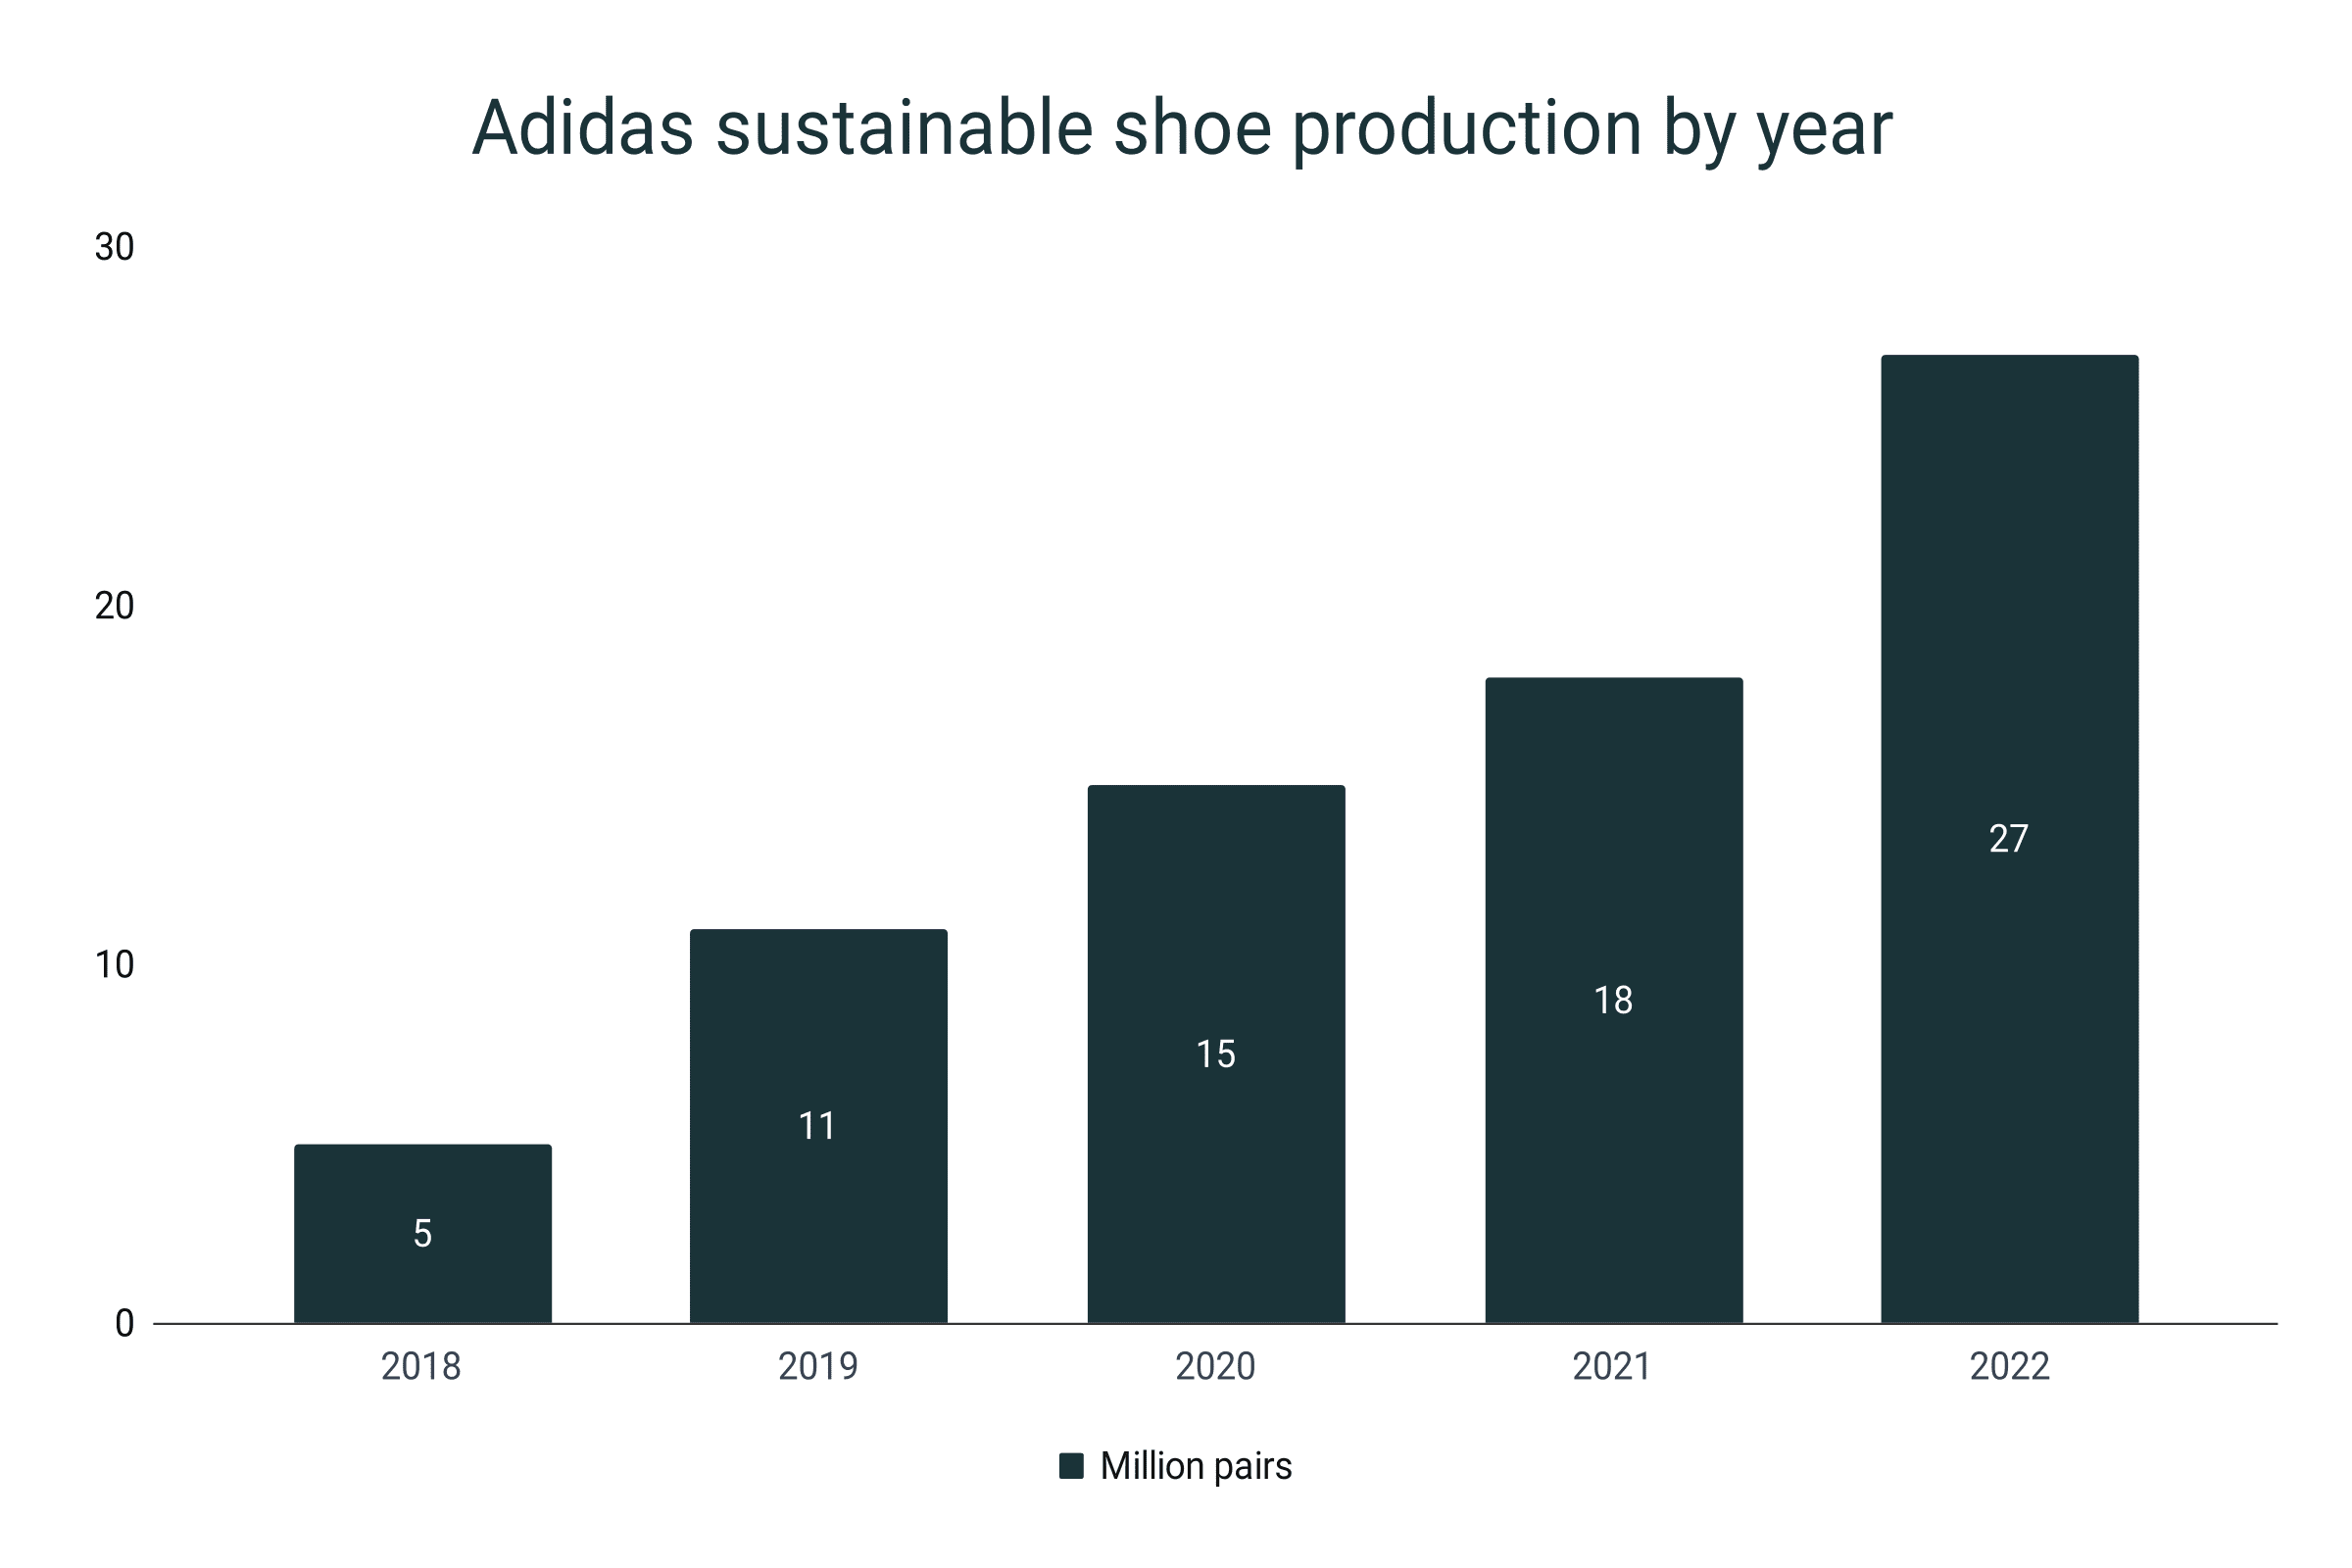
- Adidas, in collaboration with Parley for the Oceans, manufactured 27 million pairs of shoes with recycled ocean waste in 2022.
- Compared to the 18 million output in 2021, the brand was able to increase its sustainable footwear production by 50%.
- In 2018, the company produced 5 million pairs of shoes that used recycled ocean waste.
- By 2019, the production number jumped by 120%, recording 11 million pairs in total.
Adidas sustainable shoe production by year
|
Year |
Million pairs |
Growth |
|
2018 |
5 |
|
|
2019 |
11 |
120% |
|
2020 |
15 |
36% |
|
2021 |
18 |
20% |
|
2022 |
27 |
50% |
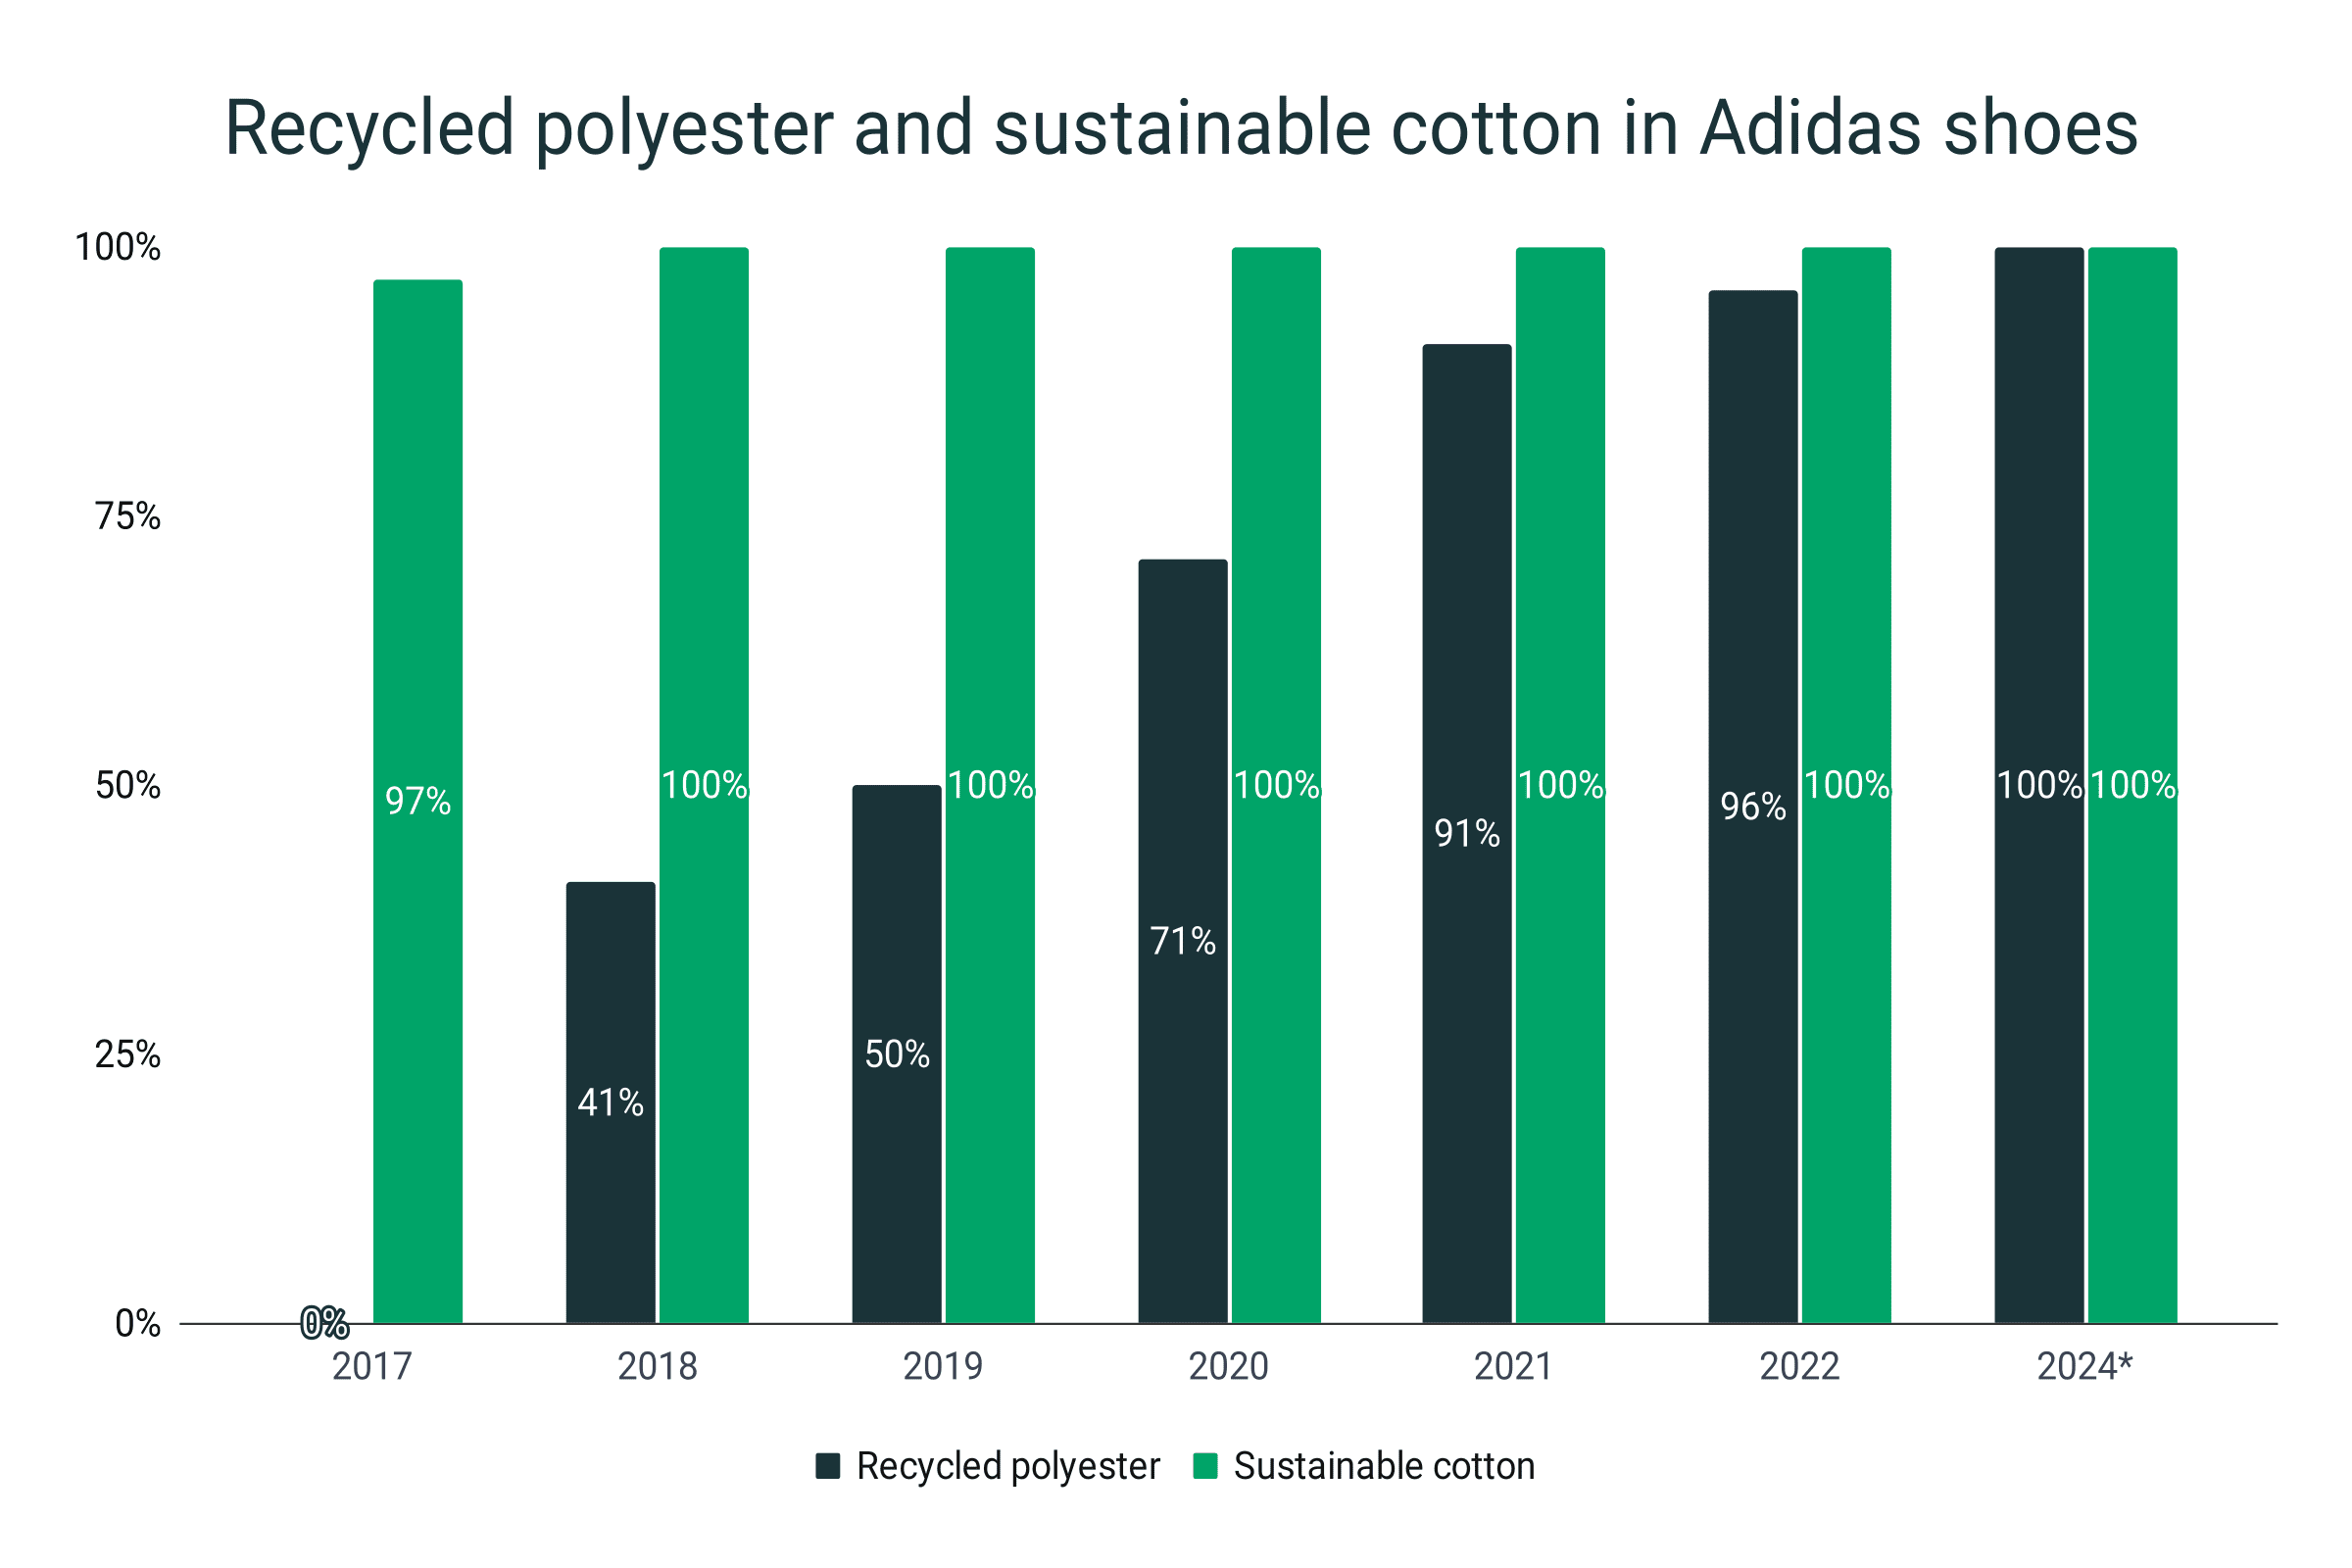
- Adidas targets to achieve 100% usage of recycled polyester by 2024.
- In 2022, it was able to use recycled polyester in 96% of its footwear products.
- The campaign started in 2017 and breached the 50% mark by 2019.
- For the use of sustainably sourced cotton, Adidas was at the 97-point mark by 2017.
- Since 2018, 100% of Adidas shoes use sustainable cotton.
Recycled polyester and sustainable cotton in Adidas shoes
|
Year |
Recycled polyester |
Sustainable cotton |
|
2017 |
No data |
97% |
|
2018 |
41% |
100% |
|
2019 |
50% |
100% |
|
2020 |
71% |
100% |
|
2021 |
91% |
100% |
|
2022 |
96% |
100% |
|
2024* |
100% |
100% |
*Company outlook
Sources
https://www.adidas-group.com/media/filer_public/e9/ba/e9bad34f-ca11-44f6-977f-364d0650feaf/annual_report_gb-2018-en_secured.pdf
https://report.adidas-group.com/2019/en/servicepages/downloads/files/adidas_annual_report_2019.pdf
https://report.adidas-group.com/2020/en/servicepages/downloads/files/annual-report-adidas-ar20.pdf
https://report.adidas-group.com/2021/en/servicepages/downloads/files/annual-report-adidas-ar21.pdf
https://report.adidas-group.com/2022/en/_assets/downloads/annual-report-adidas-ar22.pdf
https://www.statista.com/statistics/278834/revenue-nike-adidas-puma-footwear-segment/
https://www.adidas-group.com/en/sustainability/environmental-impacts/more-sustainable-materials-and-circular-services/
https://www.statista.com/statistics/268434/wholesale-net-sales-of-the-adidas-group-since-2009-by-brand/
https://www.statista.com/statistics/227015/the-adidas-groups-footwear-production-worldwide/
https://www.google.com/url?sa=i&url=https%3A%2F%2Ffistiitp.com%2Fkgcc.aspx%3Fcname%3Dnike%2Bshoe%2Bmarket%2Bshare%26cid%3D94&psig=AOvVaw18cLHdFolrJxZAF_2Vi20X&ust=1692615158240000&source=images&cd=vfe&opi=89978449&ved=0CA8QjRxqFwoTCNjmr_yI64ADFQAAAAAdAAAAABBZ
https://blog.gitnux.com/nike-vs-adidas-statistics/#:~:text=FAQs-,What%20are%20the%20global%20market%20shares%20of%20Nike%20and%20Adidas,Adidas%20stands%20at%20around%2017%25.
https://www.google.com/url?sa=i&url=https%3A%2F%2Fseekingalpha.com%2Farticle%2F4516865-nike-vs-adidas-an-undisputed-leader&psig=AOvVaw0j5VHHjlxfcU6sR0m--0AF&ust=1691980446071000&source=images&cd=vfe&opi=89978449&ved=0CBIQjhxqFwoTCKD0073M2IADFQAAAAAdAAAAABBA
https://footwearplusmagazine.com/news/take-the-money-and-run/
https://ecommercedb.com/insights/adidas-produces-one-fifth-of-revenue-online/3989
https://www.statista.com/forecasts/1218323/adidas-revenue-development-ecommercedb
https://www.statista.com/statistics/531733/share-of-adidas-retail-sales-by-region/
https://www.complex.com/sneakers/a/charles-etoroma/adidas-nmd-history
https://stockx.com/news/the-history-of-adidas-resell/
https://priceonomics.com/how-much-do-shoes-cost-for-men-vs-women/
https://fortune.com/2015/06/05/adidas-footwear-fall/
https://blog.gitnux.com/nike-vs-adidas-statistics/#:~:text=FAQs-,What%20are%20the%20global%20market%20shares%20of%20Nike%20and%20Adidas,Adidas%20stands%20at%20around%2017%25.
https://stockx.com/news/state-of-resale/
https://www.statista.com/chart/28470/brand-profiler-sportswear/
https://ballershoesdb.com/blog/the-most-popular-shoes-and-brands-worn-by-players-around-the-nba-2020-edition/
https://finance.yahoo.com/news/adidas-nearly-doubled-us-sneaker-market-share-nikes-expense-153106743.html
