US Footwear Market Statistics
Top US footwear market statistics
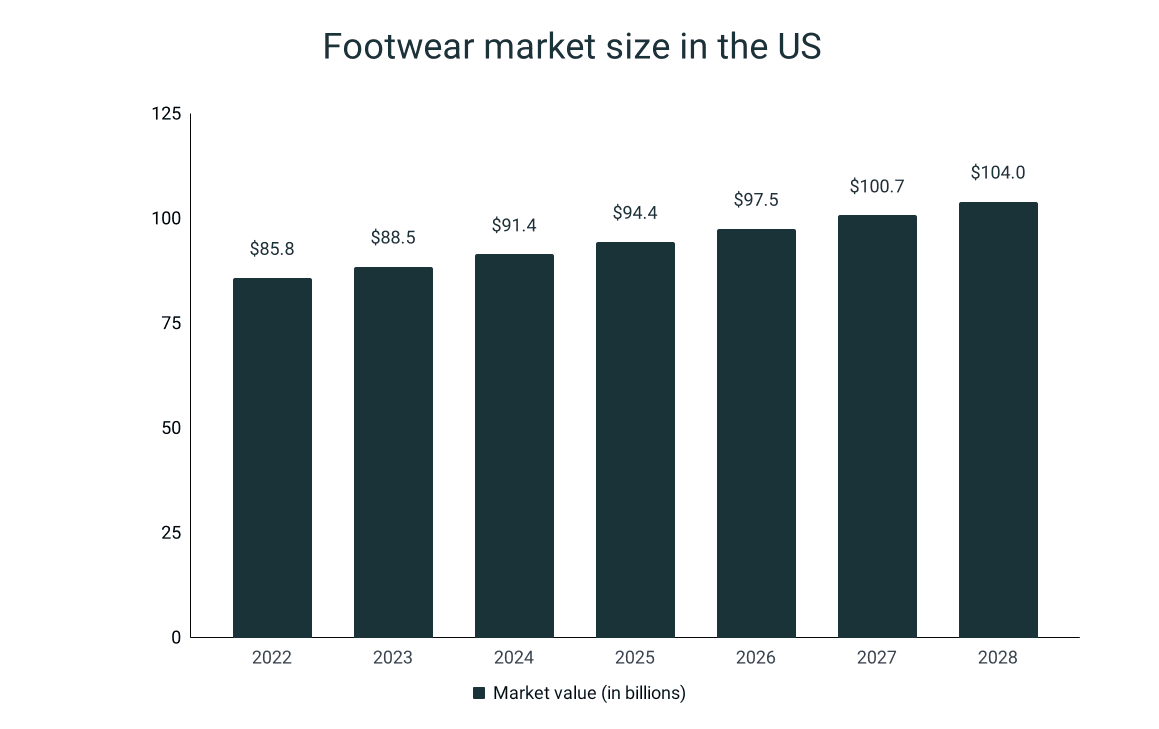
- The forecasted market size of footwear in the US in 2023 is worth $88.5 billion.
- From 2023 to 2028, the footwear segment in America is predicted to improve at a compound annual growth rate of 3.3%.
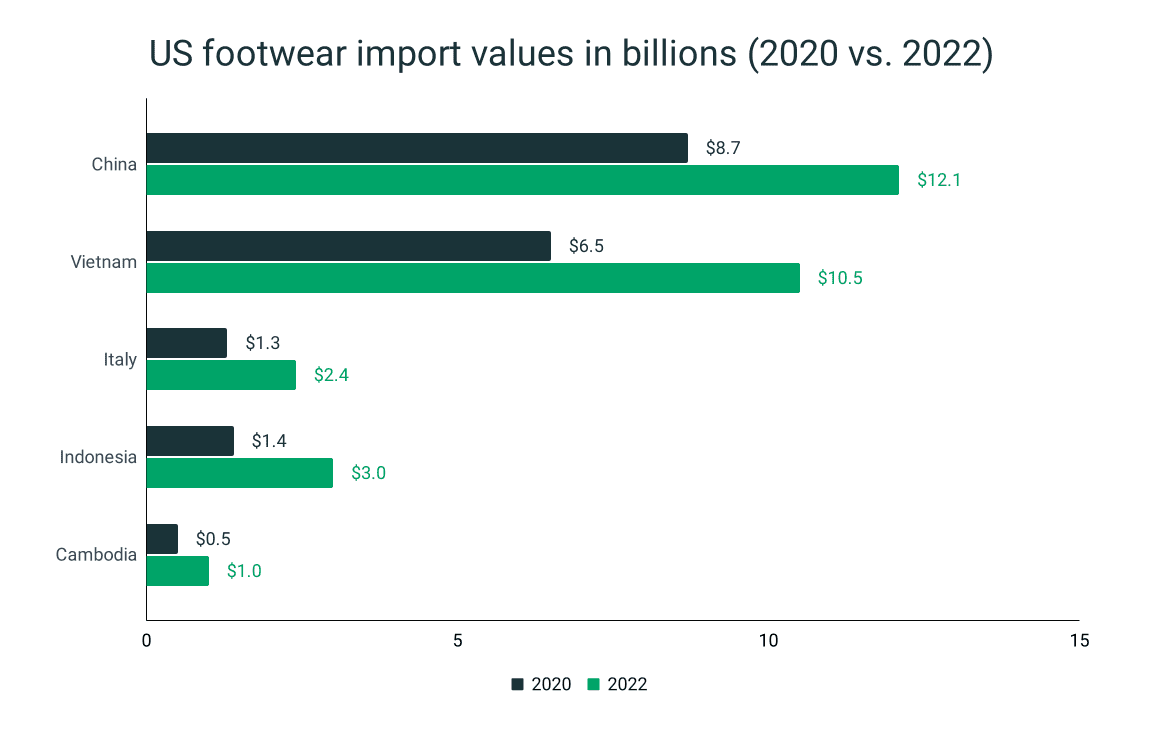
- China is consistently the major importer of shoes in the US. Case in point, the country’s import value was $8.7 billion in 2020 and it expanded by 39% in just two years.
- Southeast Asia ships over 2.4 billion footwear to the US, yearly. To put this into perspective, there are 7 pairs of shoes for every person in the US.
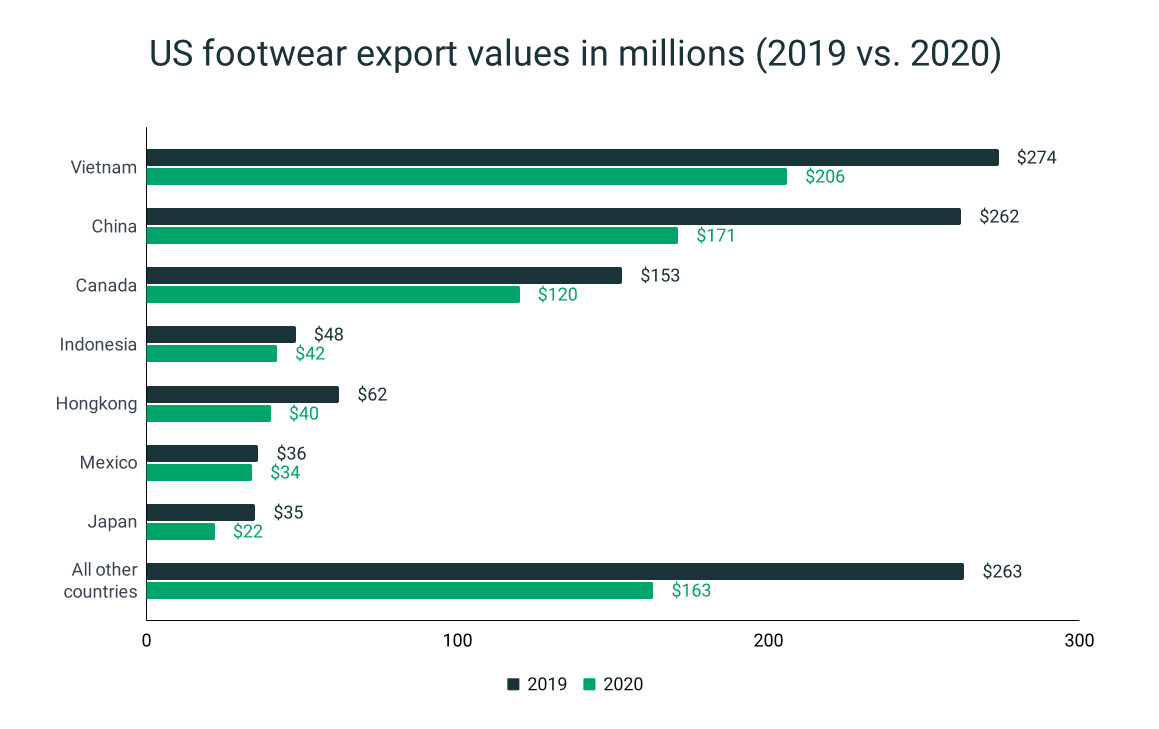
- The US made the highest exports to Vietnam in 2019 and 2020, amounting to $274 million and $206 million, respectively.
- As of 2023, the state with the most number of businesses relating to footwear is California, boasting 167 manufacturing companies and 3,436 shoe stores.
- Texas, which currently has 107 factories and 2,386 outlets, is the second US state with the most businesses focused on shoe production and retail.
- American women possess 27 pairs of shoes, on average. This is 125% more compared to the number of pairs men usually own.
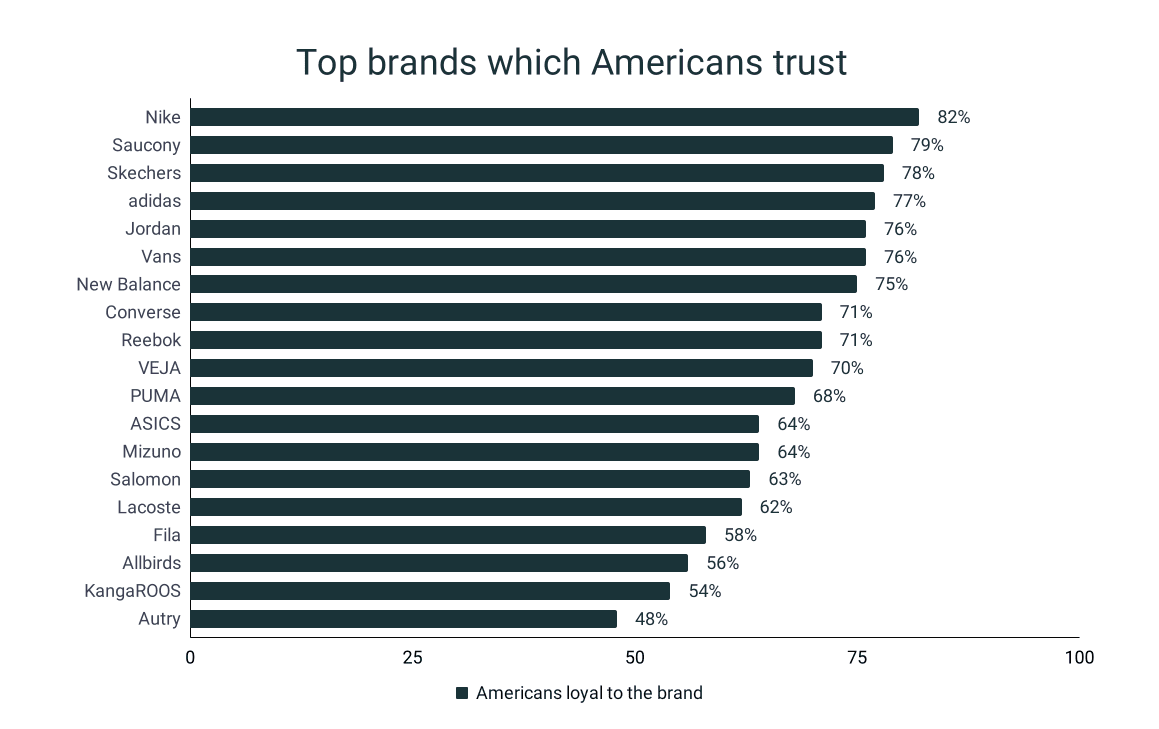
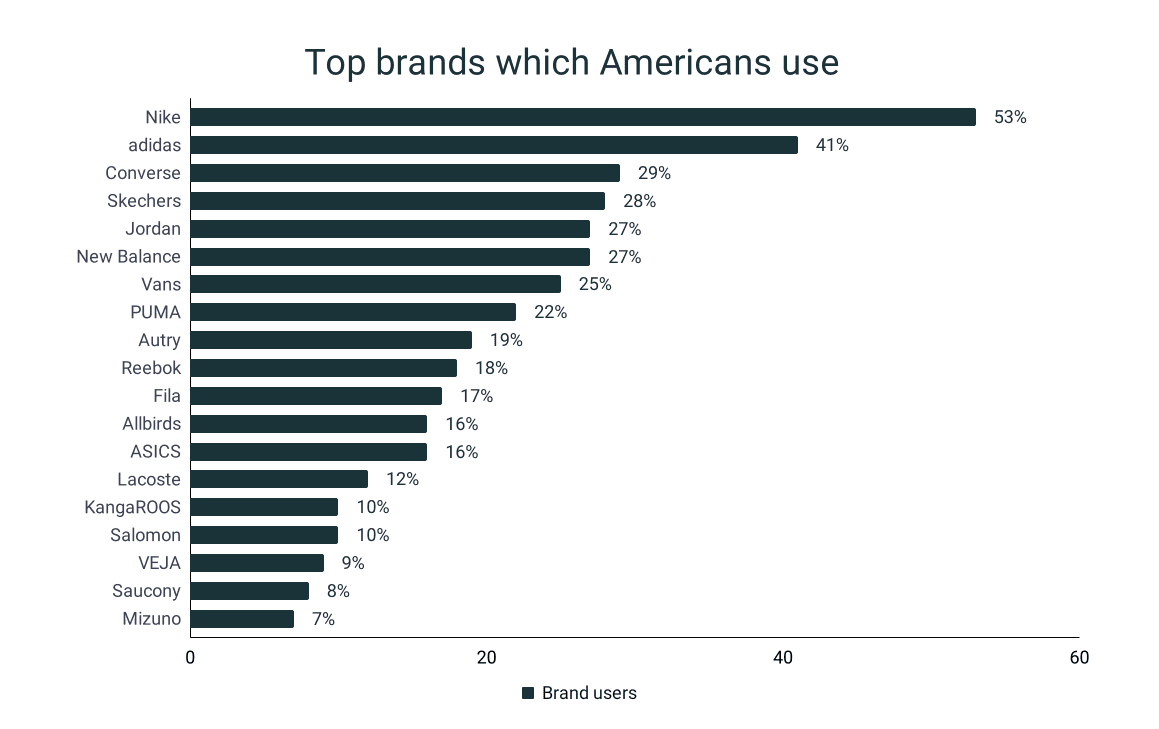
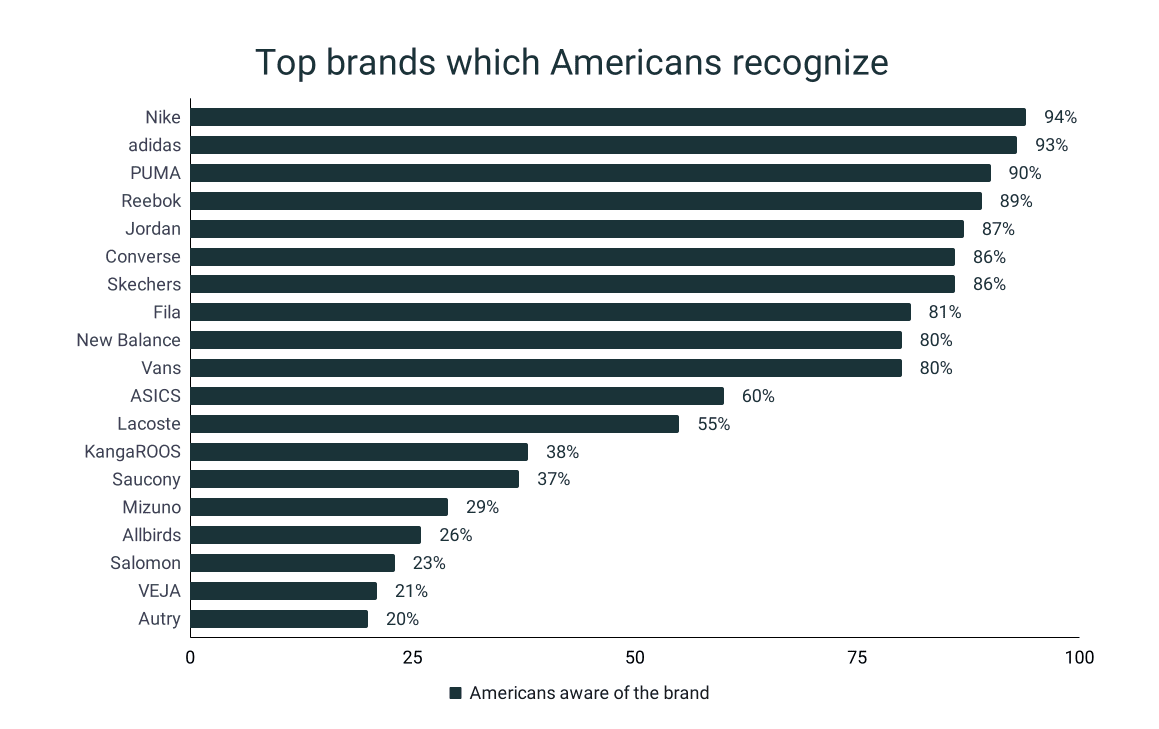
- Nike is the number one footwear brand in the US. In fact, 94% of Americans are familiar with the brand, 53% use their shoes, and 82% will continue to buy from the brand.
- 93% of the people in the US are aware of Adidas as a footwear brand, while 41% wear their shoes. Meanwhile, 77% of Americans plan on purchasing shoes again from the brand.
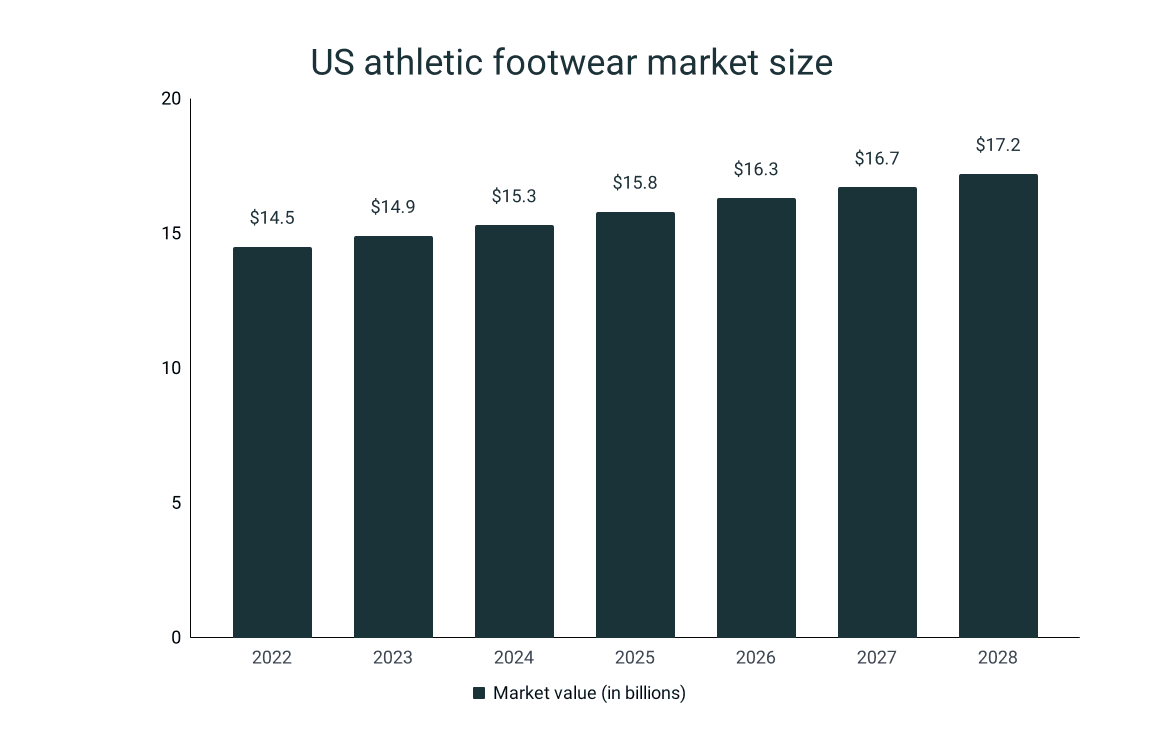
- The athletic footwear sector in America secured a revenue of $14.5 in 2022. This is estimated to grow by 2.9% in 2023, with a projected market value of $14.9 billion.
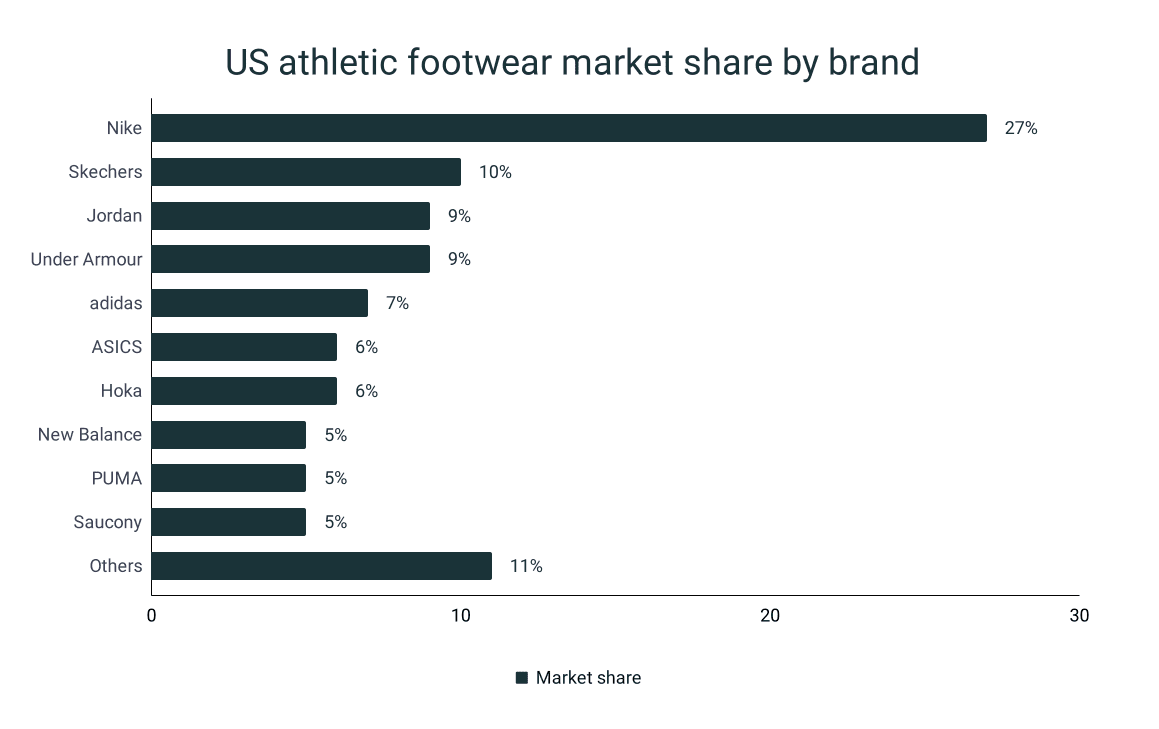
- The top five athletic footwear brands with the largest revenue shares in the industry are Nike (27%), Skechers (10%), Jordan (9%), Under Armour (9%), and Adidas (7%).
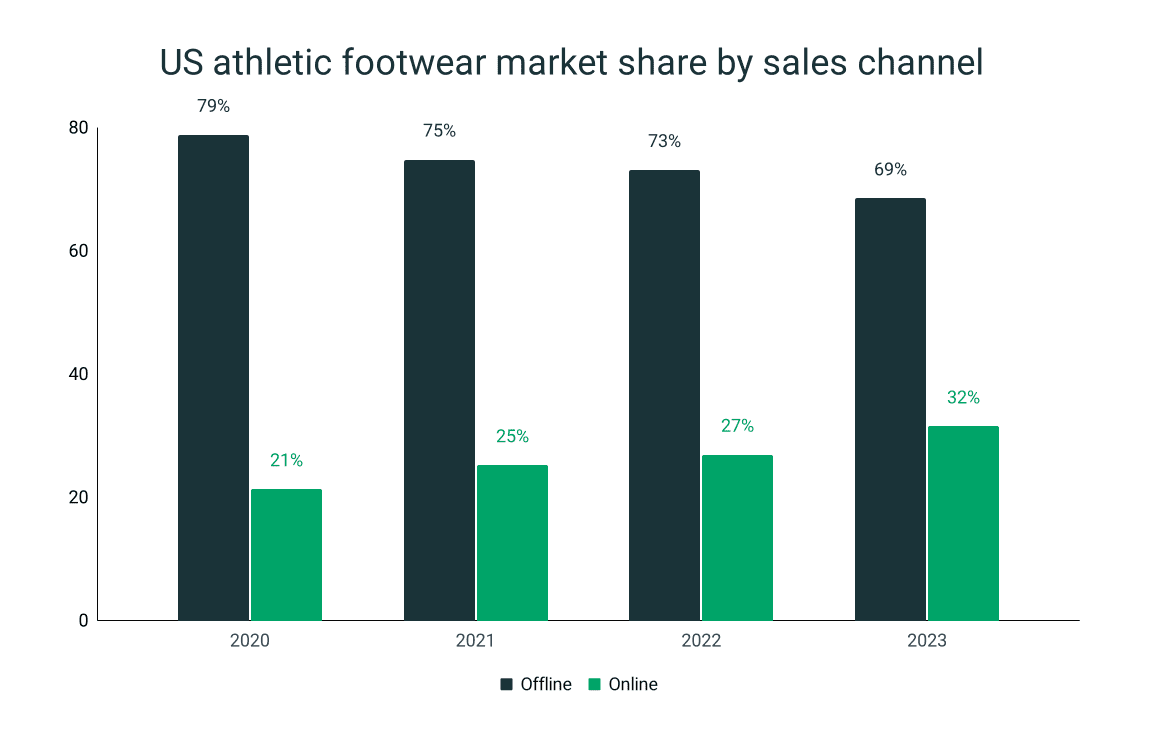
- Americans mostly procure their athletic footwear from offline retail channels, as evident in its market share of 73.1% in 2022. This is about 172% greater in comparison to the market share of the online sales channel.
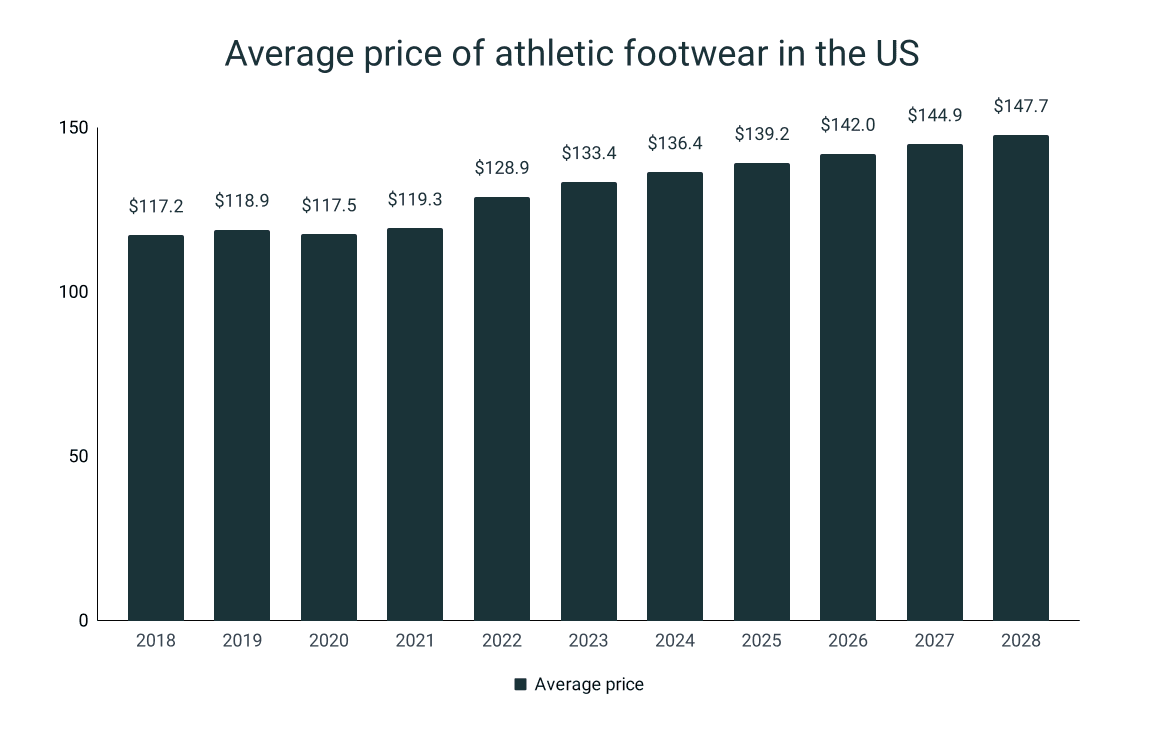
- The average price of athletic footwear in the US is $133.4 in 2023. This displays a 3.5% increase from the 2022 price and 11.8% growth from the 2021 price.
- In North America, the footwear market is anticipated to be worth $100.2 billion in 2023.
US footwear market size
- In 2023, the United States is anticipated to lead the world in footwear market revenue, with an impressive $88.5 billion in earnings. This market size is approximately 3.1% larger in comparison to the value in 2022.
- The average volume per individual in the US shoe industry in 2023 is estimated to be 5.39 pairs.
- If the population is taken into account, it is calculated that each person will contribute approximately $262.8 in revenue to the US footwear market in 2023.
- Non-luxury shoes are envisioned to represent 92% of the total shoe market in America in 2023.
- In 2022, the footwear industry in the US boasted a market worth $85.8 billion and has seen a growth of roughly 10.1% since 2021.
- The revenue share of the non-athletic segment (65.7%) also trumped the athletic segment (34.3%) by 47.8% in 2022.
- The US shoe market in 2021 generated around $78 billion in revenue.
- For the forecast period of 2023 to 2028, the shoe industry in America is predicted to surge by 3.30% each year.
- By 2028, the US market value is projected to reach $104 billion.
- Also, the market is predicted to attain a volume of 1.97 billion pairs by 2028, which will exhibit a 1.7% rise in 2024.
|
Year |
Market value (in billions) |
CAGR |
|
2022 |
$85.8 |
|
|
2023 |
$88.5 |
3.1% |
|
2028 |
$104.0 |
3.3% |
US footwear market imports
- The largest distributor of footwear in the US was China, which brought about an import value of $8.7 billion in 2020 and $12.1 billion in 2022.
- Vietnam, which prompted $6.5 billion and $10.5 billion in import costs in 2020 and 2022, was one of the top exporters of shoes in America.
- The United States also received shoe imports from Italy and Indonesia, which equated to import values of $1.3 billion and $1.4 billion in 2021. Italy and Indonesia experienced 84.6% and 114.% of increases in 2022, yielding $2.4 billion and $3.0 billion, respectively.
- It was estimated that the US brought in 8.1 pairs of shoes for every person in the country in 2022. The total sales revenue of the imports amounted to over $104.6 billion.
- Approximately 1.87 billion pairs of shoes were transported to the US in 2020.
- In 2019, more than 79% of the shoe imports in America were from China.
- Due to the cost-effective manufacturing of shoes in Southeast Asia, more than 2.4 billion footwear is imported into the US every year, equating to 7 pairs per US citizen.
|
Country |
Import value in 2020 |
Import value in 2022 |
Growth |
|
China |
$8.7 |
$12.1 |
39% |
|
Vietnam |
$6.5 |
$10.5 |
61.5% |
|
Italy |
$1.3 |
$2.4 |
84.6% |
|
Indonesia |
$1.4 |
$3.0 |
114.3% |
|
Cambodia |
$0.5 |
$1.0 |
100% |
US footwear market exports
- The top footwear exports made by the US were in Vietnam, with export costs of $274 million in 2019 and $206 million in 2020.
- The export value of the US into China collapsed by 34.7% from 2019 ($262 million) to 2020 ($171 million).
- America completed footwear exports to Canada, at a value of $153 million in 2019 and $120 million in 2020, which exhibited a decline of 21.6%.
- The export value of the US to Indonesia amounted to $48 million in 2019. However, this experienced a 12.5% loss in 2020, with only $42 million in export costs.
|
Country |
Export value in 2019 (in millions) |
Export value in 2020 (in millions) |
Decline |
|
Vietnam |
$274 |
$206 |
24.8% |
|
China |
$262 |
$171 |
34.7% |
|
Canada |
$153 |
$120 |
21.6% |
|
Indonesia |
$48 |
$42 |
12.5% |
|
Hongkong |
$62 |
$40 |
35.4% |
|
Mexico |
$36 |
$34 |
5.6% |
|
Japan |
$35 |
$22 |
37.1% |
|
All other countries |
$263 |
$163 |
38% |
Footwear businesses in the US
- As of 2023, there are 863 shoe and footwear manufacturing businesses in the United States. Meanwhile, there are 12,848 shoe stores in the country.
- California is the leading state in the United States in terms of the number of footwear businesses with a total of 167 manufacturing companies and 3,436 stores.
- The next state with the most companies that are centered in shoe sales and footwear production is Texas, bragging 107 factories and 2,386 stores.
- New York lands the third spot with 68 businesses concentrated on footwear manufacturing.
- On the other hand, when it comes to footwear retail outlets, Florida steals the third spot with 2,149 businesses.
- There are over 13,000 employees working in the footwear production industry in the US while there are 319,732 individuals hired in the shoe stores segment.
US footwear users and consumers
- An average household expenditure on footwear are worth $314.
- In the United States, women spend more on shoes than men. In fact, in 2020, a typical household allocated approximately $155 for women’s shoes.
- On average, American men own 12 pairs of shoes while women own 27 pairs.
Top sneaker brands in the US
- 94% of Americans recognize the Nike brand, while only 53% use sneakers from the brand. 82% of those who wear the brand plan on continuing to wear them.
- Adidas is popular among US citizens with 93% who said they are familiar with the brand. 41% sport the kicks from Adidas while 77% admit they are loyal to the brand.
- 29% of individuals in the US use the shoes from Converse and 71% of them will remain users of the brand. On the other hand, 86% know Converse.
- PUMA is a well-known footwear brand with 90% of people aware of them. 22% wear their shoes and 68% confirm they will purchase footwear again from the brand.
- Mizuno is only owned by 7% of Americans but 29% are familiar with the brand.
|
Brand |
American users of the brand |
Americans aware of the brand |
Americans loyal to the brand |
|
Nike |
53% |
94% |
82% |
|
adidas |
41% |
93% |
77% |
|
Converse |
29% |
86% |
71% |
|
Skechers |
28% |
86% |
78% |
|
Jordan |
27% |
87% |
76% |
|
New Balance |
27% |
80% |
75% |
|
Vans |
25% |
80% |
76% |
|
PUMA |
22% |
90% |
68% |
|
Autry |
19% |
20% |
48% |
|
Reebok |
18% |
89% |
71% |
|
Fila |
17% |
81% |
58% |
|
Allbirds |
16% |
26% |
56% |
|
ASICS |
16% |
60% |
64% |
|
Lacoste |
12% |
55% |
62% |
|
KangaROOS |
10% |
38% |
54% |
|
Salomon |
10% |
23% |
63% |
|
VEJA |
9% |
21% |
70% |
|
Saucony |
8% |
37% |
79% |
|
Mizuno |
7% |
29% |
64% |
Athletic footwear market in the US
- The industry of athletic footwear in America is estimated to attain a revenue of $14.9 billion in 2023, making the US the global top performer among other countries.
- Approximately 1/3 of the overall footwear revenue in the US accounts for athletic shoes.
- The earnings of the athletic footwear sector of the US market are projected to be $44.27 per person in 2023, a 2.4% increase in 2022.
- The average volume per American, on the other hand, is roughly computed to be 0.33 pairs in 2023. Meanwhile, the predicted total volume of the footwear market is around 111.7 million pairs.
- In 2023, sustainable footwear is expected to represent 6.8% of the athletic footwear market.
- The US market size of athletic shoes in 2022 generated a revenue of about $14.5, which reflected a 2.9% progress since 2021.
- The sustainable shoe industry covered 6.3% of the 2022 footwear market in the US. Compared to the 2021 market share, this is roughly a 6.8% improvement.
- In 2021, the athletic shoe market in the US gained $13.3 billion in revenue while the wholesale sales amounted to roughly $20 billion.
- About 2/3 of Generation Y or Millenials purchased athletic shoes from 2019 to 2021.
- The market size is predicted to balloon annually by 2.95% from 2023 to 2028. On this account, by 2028, the athletic footwear market in the US will be worth $17.2 billion.
- The athletic footwear volume in the US is also estimated to grow to 116.7 million pairs by 2028, while the forecasted volume per capita is 0.34.
|
Year |
Market value (in billions) |
CAGR |
|
2022 |
$14.5 |
|
|
2023 |
$14.9 |
2.90% |
|
2028 |
$17.2 |
2.95% |
Athletic footwear market share by brand in the US
- In 2022, Nike had the highest revenue share of 27% in the athletic footwear sector in America.
- This was followed by Skechers with 9% of the total athletic footwear market in the US.
- Jordan and Under Armour each represented 9% of the athletic footwear industry.
- Adidas was fifth in line with 7% of market share.
- Covering 6% of each of the athletic shoe segments in the US, ASICS and Hoka share the sixth spot of brands with the highest market contribution.
|
Brand |
Market share |
|
Nike |
27% |
|
Skechers |
10% |
|
Jordan |
9% |
|
Under Armour |
9% |
|
adidas |
7% |
|
ASICS |
6% |
|
Hoka |
6% |
|
New Balance |
5% |
|
PUMA |
5% |
|
Saucony |
5% |
|
Others |
11% |
Athletic footwear market share by distribution channel in the US
- In 2023, the offline sales channel is predicted to account for most of the market at 68.5%.
- Consequently, the online retail network is expected to achieve a market share of 31.5% in 2023.
- In previous years, the offline sales channel of athletic footwear also dominated the industry. In fact, it covered 73.1% of the market in 2022, 74.8% in 2021, and 78.8% in 2020.
- The online channel, on the other hand, represented 26.9% of overall athletic footwear revenue in 2022, 25.2% in 2021, and 21.3% in 2020.
|
Year |
Offline market share |
Online market share |
|
2020 |
78.8% |
21.3% |
|
2021 |
74.8% |
25.2% |
|
2022 |
73.1% |
26.9% |
|
2023 |
68.5% |
31.5% |
Average price of athletic footwear in the US
- In 2023, athletic footwear typically costs around $133.4, which is 3.5% more expensive than the price in 2022.
- The average price of athletic shoes in the US in 2022 was $128.9.
- In 2021, athletic footwear would set an American back by $119.3. This was 10.6% cheaper than the 2023 price.
- In 2028, the value of each athletic footwear is expected to be $147.7, on average. This will reflect a 10.7% hike from the 2023 price point.
|
Year |
Average price |
|
2018 |
$117.2 |
|
2019 |
$118.9 |
|
2020 |
$117.5 |
|
2021 |
$119.3 |
|
2022 |
$128.9 |
|
2023 |
$133.4 |
|
2024 |
$136.4 |
|
2025 |
$139.2 |
|
2026 |
$142.0 |
|
2027 |
$144.9 |
|
2028 |
$147.7 |
Footwear market size in North America
- The projected revenue of the footwear sector in North America is $100.2 billion in 2023.
- The market is expected to yield a $197.20 per capita revenue in 2023.
- In the same year, the shoe industry in the US is also anticipated to obtain an average volume per person of 4.23 pairs.
- The market value of shoes in North America is foreseen to grow annually by 3.24% from 2023 to 2028.
- Therefore, by 2028, it is predicted that the market size will expand to $117.5.
Sources
https://www.statista.com/outlook/cmo/footwear/united-state
https://www.statista.com/topics/4704/us-footwear-market
https://www.grandviewresearch.com/industry-analysis/footwear-market
https://www.statista.com/outlook/cmo/footwear/north-america
https://www.statista.com/outlook/cmo/footwear/athletic-footwear/united-states
https://www.statista.com/insights/consumer/brand-profiles/2/3/sneakers/united-states
https://www.statista.com/statistics/606074/value-of-the-leading-5-footwear-import-origins-of-the-us/
https://www.ibisworld.com/industry-statistics/employment/shoe-footwear-manufacturing-united-states/
https://www.ibisworld.com/industry-statistics/number-of-businesses/shoe-stores-united-states/
https://www.statista.com/outlook/cmo/footwear/athletic-footwear/united-states#revenue
