Is Russian Doping What It Appears To Be?
This analysis covers 29,190 results achieved by 354 Russian athletes, dispersed over 4,691 events, during the 1993-2019 period.
Given the current controversy regarding doping at the Olympic Games, with a specific focus on Russian athletes, we decided to see what the actual numbers have to say. For this purpose, we focused only on athletics (track and field) and analysed the results of Russian athletes who competed at the Summer Olympic Games during the 1993-2019 period.
Terminology
Clean athletes - athletes who have never been disqualified for doping.
Banned athletes - athletes who were disqualified for doping.
Regular results - banned athletes’ results achieved when they were not disqualified.
Disqualified (DQ) results - banned athletes’ results achieved during their disqualification period.
The main focus points
- Share of disqualified results by year, country, discipline, and athlete
- How the results of clean athletes compare to the results of banned athletes
- How the disqualified results compare to regular results
Key takeaways
- Clean athletes performed better than banned athletes in 6 out of 21 disciplines, with the biggest differences in Hammer Throw Men (3.25%), Javelin Throw Women (2.63%), and 400 Metres Hurdles Women (2.30%)
- The biggest differences in favour of banned athletes are seen in Hammer Throw Women (6.98% or 4.39m), Heptathlon Women (6.66% or 402.3 points), Discus Throw Women (6.27% or 2.54m).
- Women have 2x greater share of banned athletes than men.
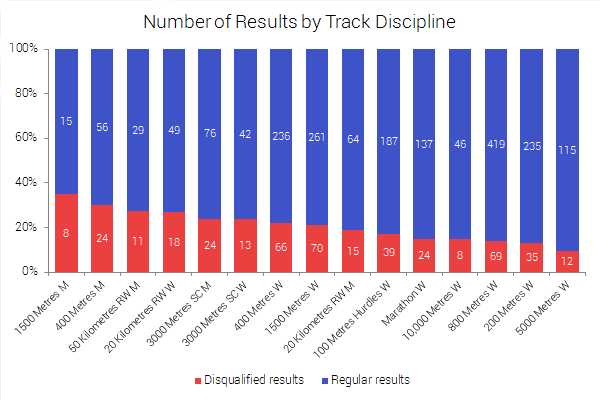
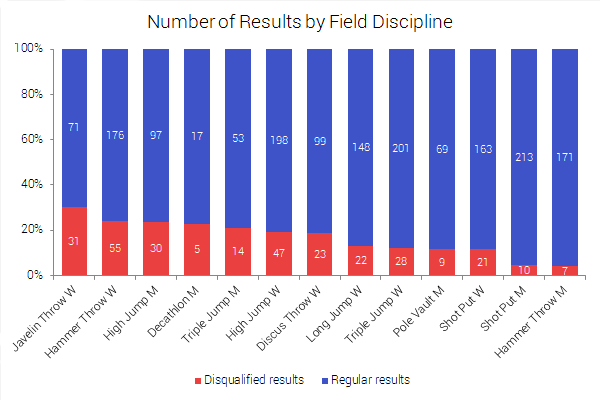
- When analysing banned athletes’ results, in 5 out of 28 disciplines their regular results are better than their disqualified results. Outside of their disqualification period, athletes performed better in Triple Jump Women (0.59%), Shot Put Women (0.23%), Shot Put Men (0.07%), 20 Kilometres Race Walk Women (0.03%), 20 Kilometres Race Walk Men (0.02%).
- The biggest differences in favour of disqualified are seen in: Javelin Throw Women (9.84%), Marathon Women (5.35%), 3000 Metres Steeplechase Women (4.46%).
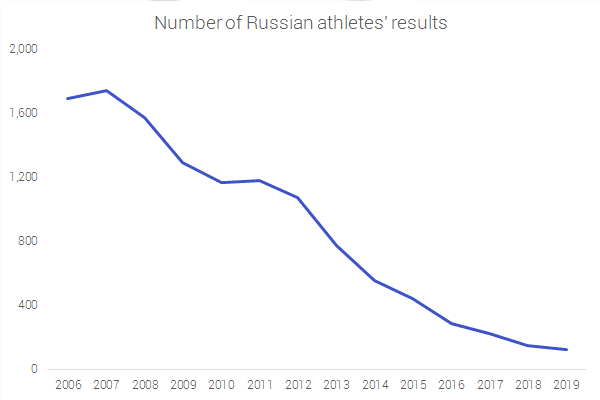
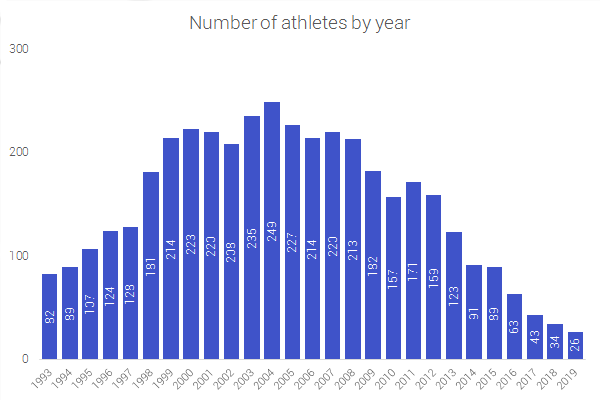
- In 2007, 220 Russian athletes achieved 1,743 results. By 2019, the number of results decreased by 92.77% and the number of athletes by 88.18%.
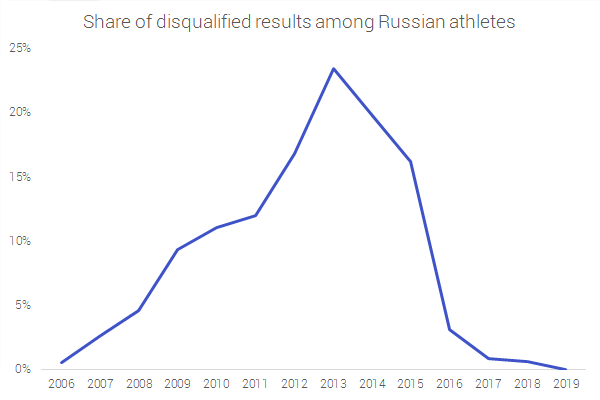
- The highest share of disqualified results was recorded in the 2009-2015 period. The peak happened in 2013 when 23.51% of achieved results were the disqualified ones.
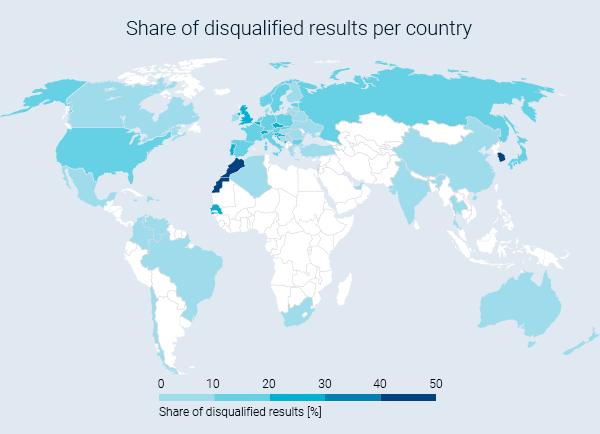
- Korea (40.68%), Morocco (40.00%), and China (32.04%) are countries that hosted competitions with the highest share of disqualified results achieved by Russian athletes.
|
Number of results |
29,190 |
|
Number of events |
4,691 |
|
Number of banned athletes |
92 |
|
Number of banned athletes’ results |
8,388 |
|
Number of clean athletes |
262 |
|
Number of clean athletes’ results |
20,802 |
|
Time period |
1993-2019 |
|
Number of disciplines |
104 |
|
Women |
Men |
|
|
Number of athletes |
198 |
156 |
|
Number of clean athletes |
132 |
130 |
|
Number of banned athletes |
66 |
26 |
|
Number of all results |
17,310 |
11,880 |
|
Number of clean athletes’ results |
10,685 |
10,117 |
|
Number of banned athletes’ results |
6,625 |
1,763 |
|
Number of disciplines |
50 |
54 |
Women have 2x bigger share of banned athletes than men. Out of 198 women, 33.33% were banned and 66.67% were clean. When it comes to men, out of 156, 83.33% were clean and 16.67% were banned.
Share of Disqualified Results
Share of disqualified results per year
After 2007, we see a decrease in the number of overall results. The highest share of disqualified results was recorded in the 2009-2015 period. In no other years were over 10% of all results disqualified. The peak occurred in 2013 when 23.51% of achieved results were disqualified.
|
Year |
Number of DQ results |
Number of all results |
% of DQ results |
|
1993-2005 |
25 |
16,912 |
0.15 |
|
2006 |
10 |
1,689 |
0.59 |
|
2007 |
47 |
1,743 |
2.70 |
|
2008 |
72 |
1,572 |
4.58 |
|
2009 |
121 |
1,290 |
9.38 |
|
2010 |
129 |
1,165 |
11.07 |
|
2011 |
142 |
1,180 |
12.03 |
|
2012 |
181 |
1,076 |
16.82 |
|
2013 |
182 |
774 |
23.51 |
|
2014 |
111 |
557 |
19.93 |
|
2015 |
72 |
444 |
16.22 |
|
2016 |
9 |
288 |
3.12 |
|
2017 |
2 |
224 |
0.89 |
|
2018 |
1 |
150 |
0.67 |
|
2019 |
0 |
126 |
0.00 |
Even though there’s a decrease in the number of results over time, the share of disqualified results follows a different trend. They increase with a peak in 2013. From 2013 until today, the share of disqualified results has declined.
In 2007, 220 Russian athletes achieved 1,743 results. By 2019, the number of results decreased by 92.77% and the number of athletes by 88.18% (126 results achieved by 26 athletes).
Share of disqualified results per country
Among 63 countries where Russian Olympic athletes competed, the highest share of their disqualified results came in Korea (40.68%), Morocco (40.00%), China (32.04%), Great Britain (29.90%) and Croatia (28.57%). This share is 10.03% for competitions held in Russia. Canada is last on the list with only 3.33% of disqualified results.
Click to view the complete list:
|
Country |
Number of regular results |
Number of dq results |
Number of all results |
% of DQ results |
|
KOR |
35 |
24 |
59 |
40.68 |
|
MAR |
15 |
10 |
25 |
40.00 |
|
CHN |
70 |
33 |
103 |
32.04 |
|
GBR |
143 |
61 |
204 |
29.90 |
|
HRV |
45 |
18 |
63 |
28.57 |
|
SVN |
11 |
4 |
15 |
26.67 |
|
MNE |
3 |
1 |
4 |
25.00 |
|
SEN |
6 |
2 |
8 |
25.00 |
|
CHE |
138 |
43 |
181 |
23.76 |
|
QAT |
33 |
10 |
43 |
23.26 |
|
CZE |
74 |
21 |
95 |
22.11 |
|
BEL |
77 |
21 |
98 |
21.43 |
|
PRT |
74 |
20 |
94 |
21.28 |
|
NOR |
47 |
11 |
58 |
18.97 |
|
DEU |
306 |
69 |
375 |
18.40 |
|
SWE |
120 |
27 |
147 |
18.37 |
|
ITA |
284 |
59 |
343 |
17.20 |
|
JPN |
69 |
14 |
83 |
16.87 |
|
POL |
74 |
15 |
89 |
16.85 |
|
SVK |
41 |
8 |
49 |
16.33 |
|
NLD |
21 |
4 |
25 |
16.00 |
|
FRA |
238 |
42 |
280 |
15.00 |
|
BGR |
6 |
1 |
7 |
14.29 |
|
USA |
160 |
26 |
186 |
13.98 |
|
ESP |
180 |
29 |
209 |
13.88 |
|
AUT |
32 |
5 |
37 |
13.51 |
|
FRA |
53 |
8 |
61 |
13.11 |
|
EST |
48 |
7 |
55 |
12.73 |
|
RUS |
4277 |
477 |
4754 |
10.03 |
|
HUN |
58 |
6 |
64 |
9.38 |
|
FIN |
62 |
6 |
68 |
8.82 |
|
LTU |
12 |
1 |
13 |
7.69 |
|
GRC |
200 |
16 |
216 |
7.41 |
|
IND |
14 |
1 |
15 |
6.67 |
|
TUR |
34 |
2 |
36 |
5.56 |
|
UKR |
19 |
1 |
20 |
5.00 |
|
CAN |
29 |
1 |
30 |
3.33 |
|
AUS |
50 |
0 |
50 |
0.00 |
|
BIH |
1 |
0 |
1 |
0.00 |
|
BLR |
12 |
0 |
12 |
0.00 |
|
BRA |
7 |
0 |
7 |
0.00 |
|
CHL |
4 |
0 |
4 |
0.00 |
|
COL |
4 |
0 |
4 |
0.00 |
|
DNK |
2 |
0 |
2 |
0.00 |
|
DOM |
1 |
0 |
1 |
0.00 |
|
IRL |
2 |
0 |
2 |
0.00 |
|
ISR |
6 |
0 |
6 |
0.00 |
|
JAM |
5 |
0 |
5 |
0.00 |
|
LVA |
18 |
0 |
18 |
0.00 |
|
LUX |
1 |
0 |
1 |
0.00 |
|
MEX |
9 |
0 |
9 |
0.00 |
|
MLT |
3 |
0 |
3 |
0.00 |
|
NZL |
5 |
0 |
5 |
0.00 |
|
PRI |
3 |
0 |
3 |
0.00 |
|
ROU |
2 |
0 |
2 |
0.00 |
|
ZAF |
6 |
0 |
6 |
0.00 |
|
SGP |
6 |
0 |
6 |
0.00 |
|
SRB |
11 |
0 |
11 |
0.00 |
|
THA |
10 |
0 |
10 |
0.00 |
|
CHN |
3 |
0 |
3 |
0.00 |
|
ARE |
3 |
0 |
3 |
0.00 |
|
VEN |
1 |
0 |
1 |
0.00 |
|
DZA |
1 |
0 |
1 |
0.00 |
Countries that haven’t been mentioned didn’t host any Russian athletes in competitions.
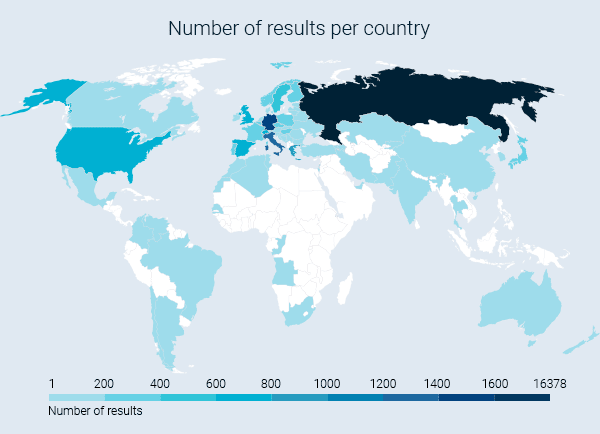
The dirtiest and cleanest Olympic disciplines
By looking at the share of disqualified results for each discipline, the top 5 dirtiest (with the biggest % of disqualified results) and cleanest (with the smallest % of disqualified results) Olympic disciplines for women and men are listed.
|
Discipline |
Number of DQ results |
Number of all results |
% of DQ results |
|
100 Metres Women |
0 |
878 |
0.00 |
|
400 Metres Hurdles Women |
0 |
592 |
0.00 |
|
Pole Vault Women |
0 |
530 |
0.00 |
|
200 Metres Women |
35 |
971 |
3.60 |
|
High Jump Women |
49 |
975 |
5.03 |
|
Discipline |
Number of DQ results |
Number of all results |
% of DQ results |
|
1500 Metres Women |
70 |
562 |
12.46 |
|
Hammer Throw Women |
117 |
952 |
12.29 |
|
20 Kilometres Race Walk Women |
18 |
150 |
12.00 |
|
Javelin Throw Women |
55 |
495 |
11.11 |
|
3000 Metres Steeplechase Women |
13 |
138 |
9.42 |
|
Discipline |
Number of DQ results |
Number of all results |
% of DQ results |
|
Long Jump Men |
0 |
602 |
0.0 |
|
Javelin Throw Men |
0 |
548 |
0.0 |
|
800 Metres Men |
0 |
374 |
0.0 |
|
100 Metres Men |
0 |
335 |
0.0 |
|
400 Metres Hurdles Men |
0 |
331 |
0.0 |
|
Discipline |
Number of DQ results |
Number of all results |
% of DQ results |
|
50 Kilometres Race Walk Men |
11 |
97 |
11.34 |
|
3000 Metres Steeplechase Men |
24 |
247 |
9.72 |
|
20 Kilometres Race Walk Men |
15 |
163 |
9.20 |
|
High Jump Men |
30 |
669 |
4.48 |
|
400 Metres Men |
24 |
537 |
4.47 |
Individual share of disqualified results
Individual results of banned athletes were analysed by comparing the number of their regular and disqualified results, across all disciplines combined. Only those who had at least 5 results in each result group (regular and disqualified) were taken into account.
|
Athlete |
Number of DQ results |
Number of regular results |
% of DQ results |
|
Tatyana Chernova |
20 |
8 |
71.43 |
|
Yelizaveta Grechishnikova |
12 |
11 |
52.17 |
|
Kornikova-kirdyapkina Anisiya |
11 |
21 |
34.38 |
|
Olga Kaniskina |
11 |
22 |
33.33 |
|
Darya Pishchalnikova |
32 |
65 |
32.99 |
|
Athlete |
Number of DQ results |
Number of regular results |
% of DQ results |
|
Minshin Ildar |
49 |
54 |
47.57 |
|
Sergey Kirdyapkin |
8 |
9 |
47.06 |
|
Denis Alekseyev |
20 |
30 |
40.00 |
|
Valeriy Borchin |
8 |
12 |
40.00 |
|
Igor Yerokhin |
6 |
15 |
28.57 |
|
Athlete |
Number of DQ results |
Number of regular results |
% of DQ results |
|
Kuzenkova Olga |
5 |
121 |
3.97 |
|
Yakovenko Mariya |
5 |
89 |
5.32 |
|
Yegorova Olga |
7 |
112 |
5.88 |
|
Poistogova Yekaterina |
5 |
78 |
6.02 |
|
Pyatykh Anna |
13 |
200 |
6.10 |
|
Athlete |
Number of DQ results |
Number of regular results |
% of DQ results |
|
Kirill Ikonnikov |
6 |
70 |
7.89 |
|
Borisov Yevgeniy |
7 |
72 |
8.86 |
|
Tsirikhov Soslan |
10 |
98 |
9.26 |
|
Lyukman Adams |
15 |
97 |
13.39 |
|
Aleksandr Pogorelov |
5 |
32 |
13.51 |
Clean vs. banned athletes
The average results of banned and clean athletes are compared here, with the difference shown in percentages. All the showcased results in this section are statistically significant, as pointed out with significance levels for each discipline.
|
Discipline |
Banned |
Clean |
Difference [%] |
Significance level |
|
200 Metres Women |
22.83 |
22.95 |
-0.52 |
97.6 |
|
400 Metres Men |
45.96 |
46.32 |
-0.78 |
99.8 |
|
400 Metres Hurdles Women |
57.25 |
55.96 |
2.30 |
99.9 |
|
800 Metres Women |
02:02.01 |
02:01.25 |
0.62 |
99.9 |
|
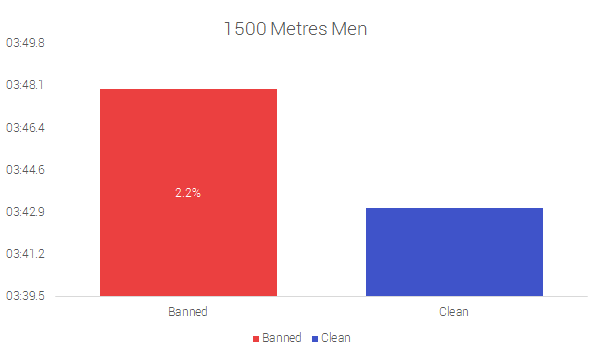
1500 Metres Men |
03:47.96 |
03:43.08 |
2.12 |
99.9 |
|
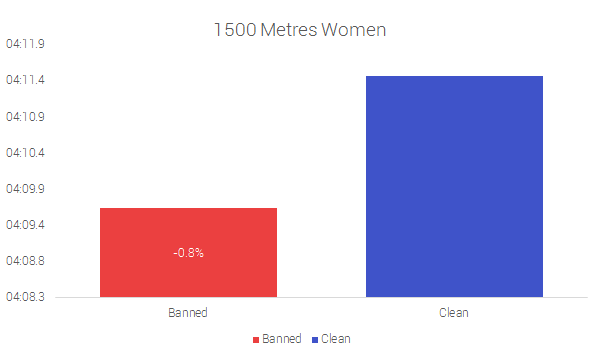
1500 Metres Women |
04:09.55 |
04:11.55 |
-0.80 |
97.5 |
|
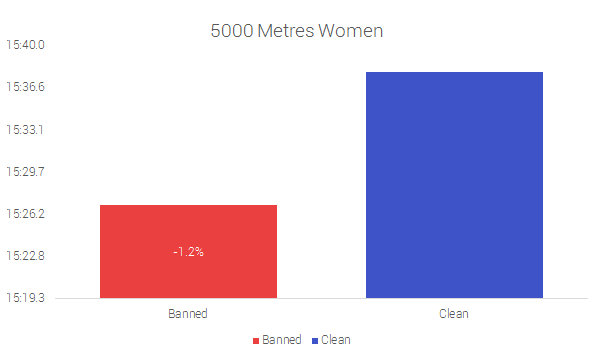
5000 Metres Women |
15:26.98 |
15:37.93 |
-1.17 |
99.4 |
|
20 Kilometres Race Walk Women |
01:28:13.34 |
01:30:08.34 |
-2.13 |
99.9 |
|
Discus Throw Men |
64.09 |
60.31 |
6.27 |
99.9 |
|
Discus Throw Women |
60.09 |
57.55 |
4.41 |
99.9 |
|
Hammer Throw Men |
73.44 |
75.91 |
-3.25 |
99.9 |
|
Hammer Throw Women |
67.21 |
62.82 |
6.98 |
99.9 |
|
Heptathlon Women |
6441.04 |
6038.74 |
6.66 |
99.9 |
|
High Jump Men |
2.27 |
2.24 |
1.35 |
99.9 |
|
High Jump Women |
1.93 |
1.90 |
1.55 |
99.9 |
|
Javelin Throw Women |
57.97 |
59.54 |
-2.63 |
99.9 |
|
Long Jump Women |
6.62 |
6.57 |
0.76 |
97.5 |
|
Pole Vault Men |
5.47 |
5.56 |
-1.60 |
99.9 |
|
Shot Put Men |
19.46 |
19.30 |
0.82 |
95.0 |
|
Shot Put Women |
18.39 |
17.59 |
4.59 |
99.9 |
|
Triple Jump Women |
14.29 |
13.99 |
2.17 |
99.9 |
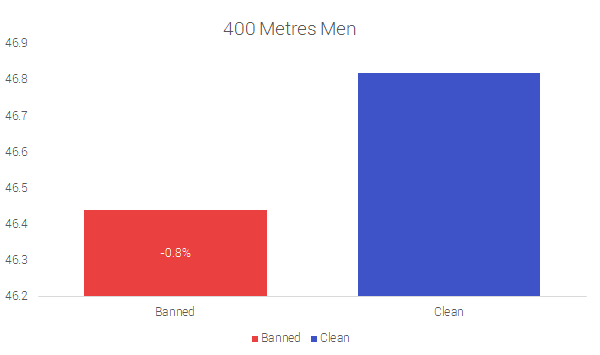
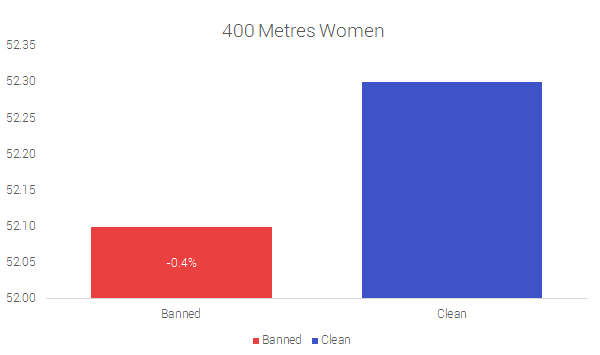
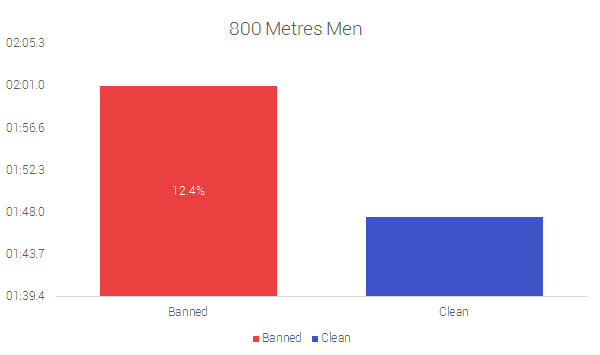
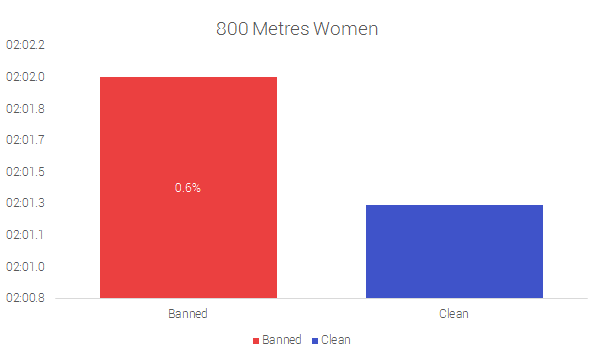
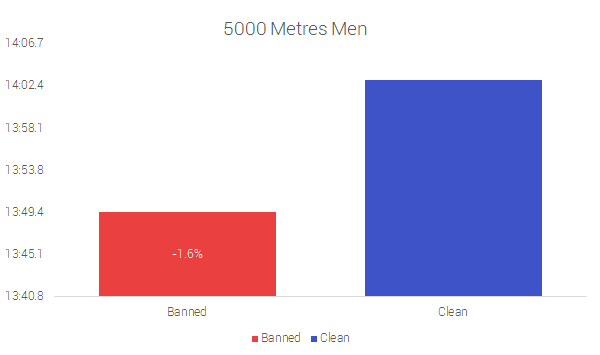
The results of banned athletes are better than clean athletes’ results in 15 out of 21 disciplines.
The biggest differences, in favour of banned athletes, we see in Hammer Throw Women (6.98% or 4.39m), Heptathlon Women (6.66% or 402.3 points), Discus Throw Women (6.27% or 2.54m).
The biggest differences, in favour of clean athletes, we see in Hammer Throw Men (3.25% or 2.47m), Javelin Throw Women (2.63% 1.57m), and 400 Metres Hurdles Women (2.30% or 1.29s).
In Shot Put, High Jump and Discus Throw banned athletes in both women and men disciplines outperformed clean athletes. However, in Hammer Throw and 1500 Metres, banned athletes only outperformed clean athletes in female disciplines. In these disciplines, clean men have better results than banned men.
Click below to look at comparison graphs for all disciplines.
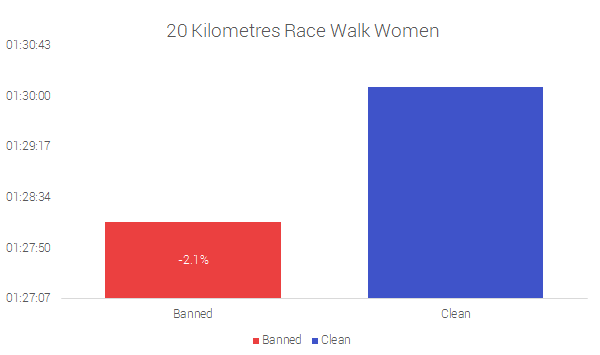
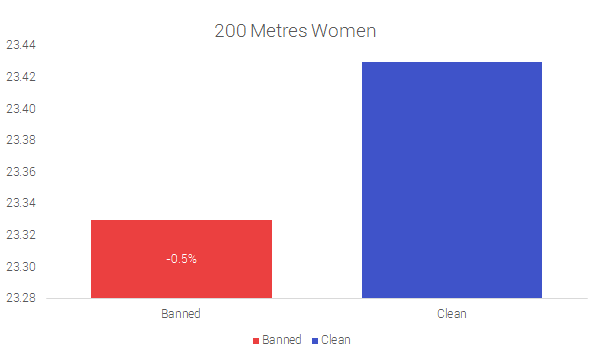
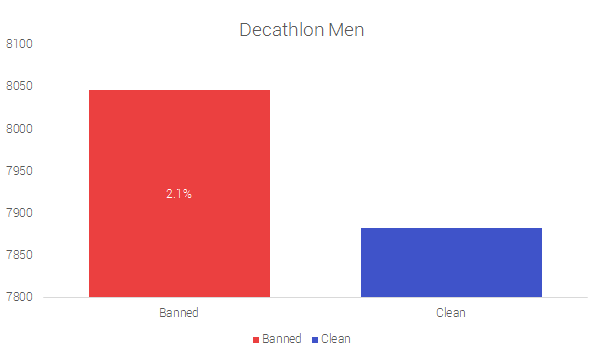
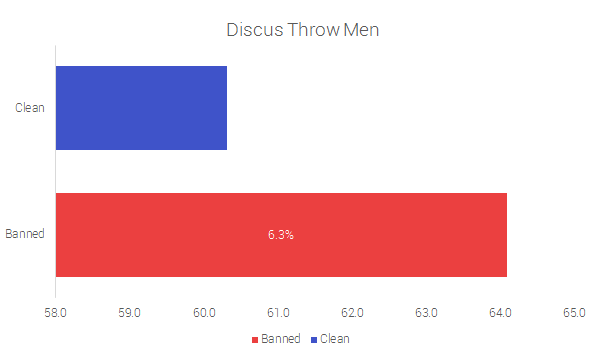
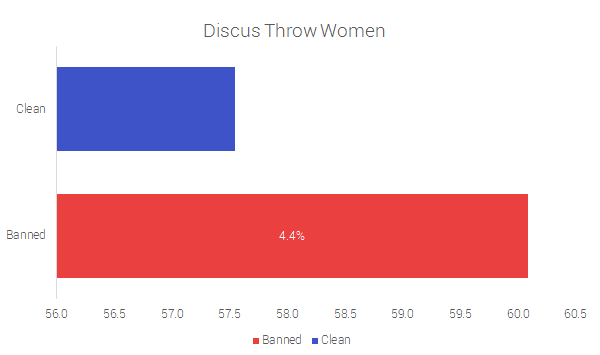
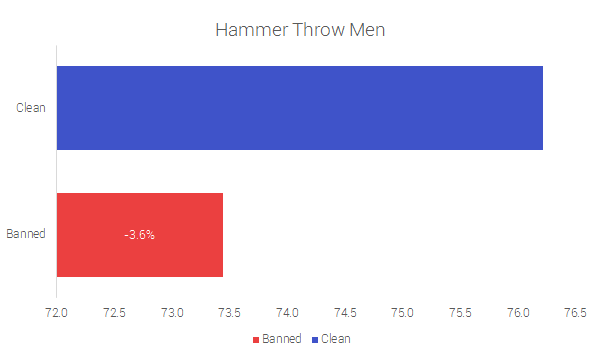
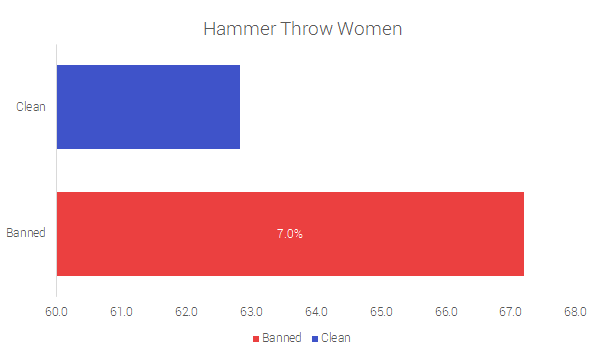
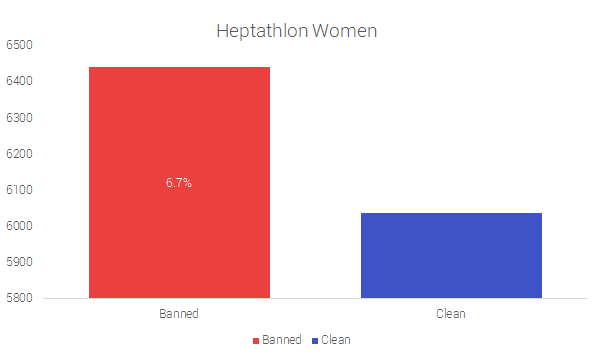
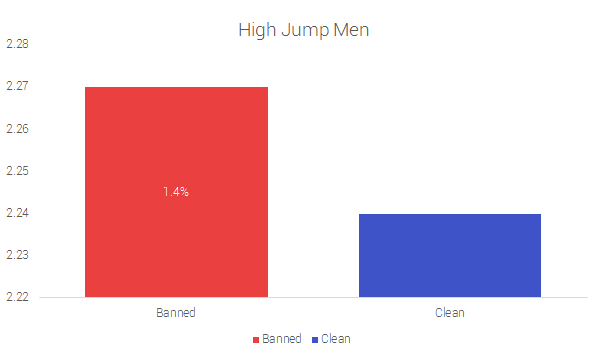
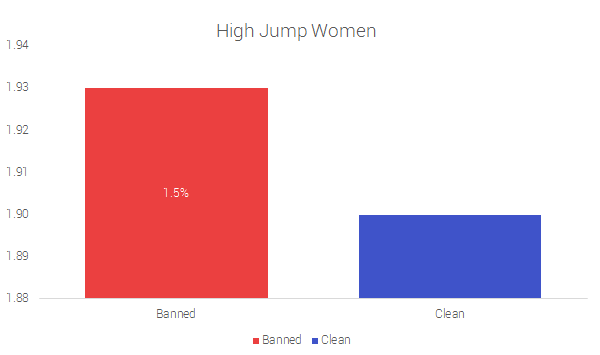
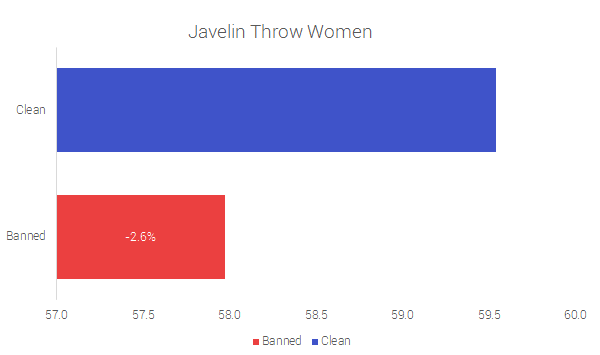
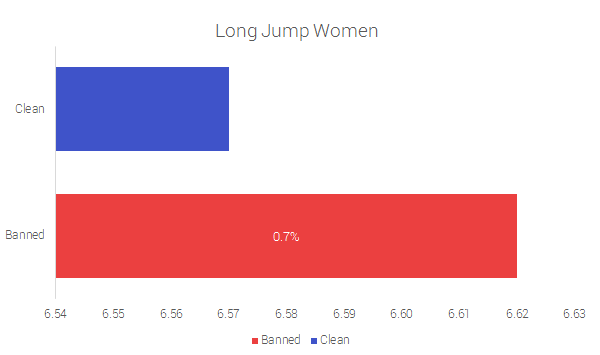
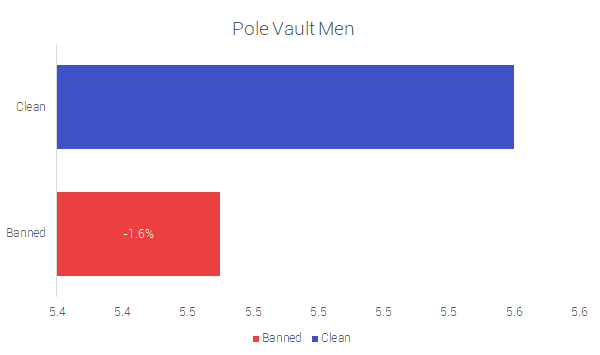
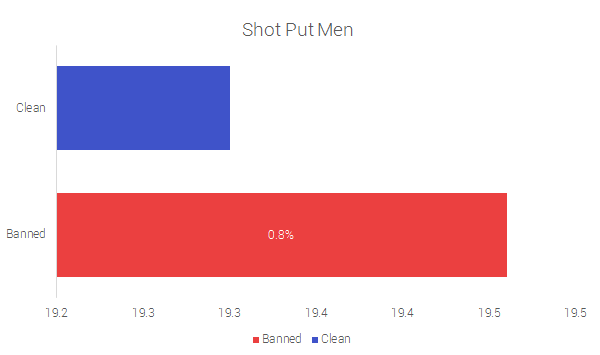
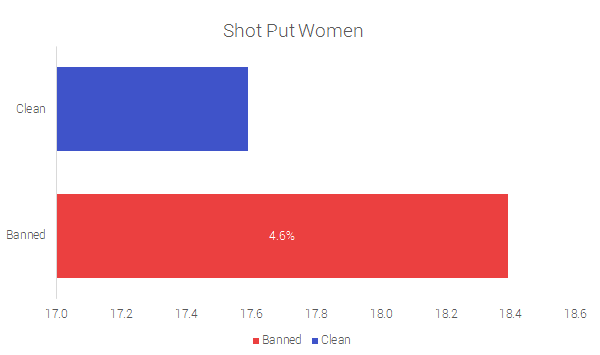
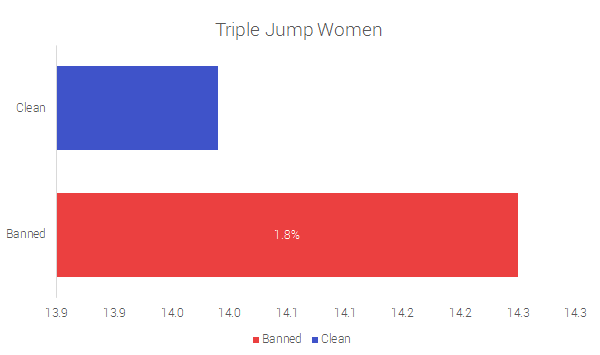
7 disciplines have more results from banned athletes than results from clean athletes.
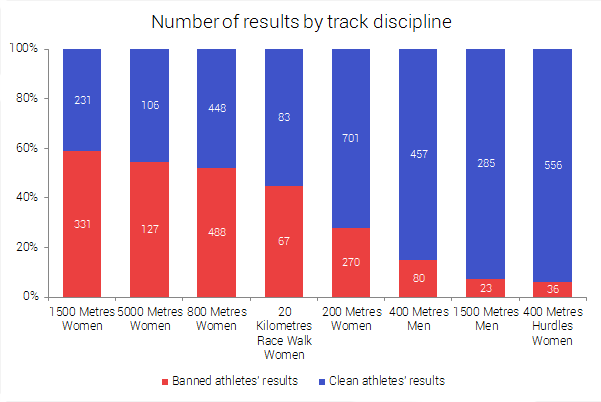
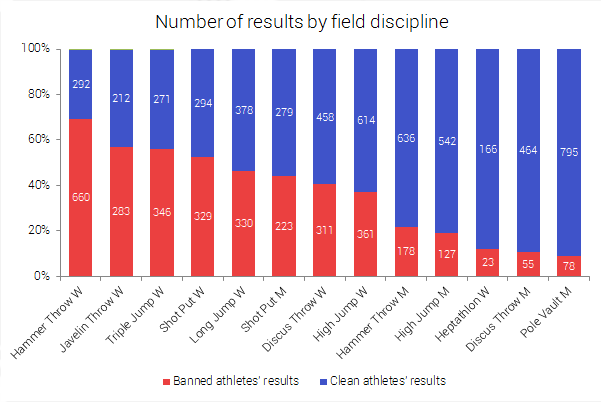
Regular vs. Disqualified Results
The average regular and disqualified results of banned athletes are compared here. All of the showcased disciplines in this section have passed the sample size test (more than 5 results in each result group). Statistically significant disciplines are marked with *.
- In all 10 statistically significant disciplines, disqualified results are better than regular results
- The largest advantage for disqualified results is seen in: Javelin Throw Women (9.84%), Marathon Women (5.35%), 3000 Metres Steeplechase Women (4.46%)
- In 5 out of 28 disciplines, regular results are better than the disqualified results: Triple Jump Women (0.59%), Shot Put Women (0.23%), Shot Put Men (0.07%), 20 Kilometres Race Walk Women (0.03%), 20 Kilometres Race Walk Men (0.02%).
|
Discipline |
Regular |
Disqualified |
Difference [%] |
|
400 Metres Men |
00:46.1 |
00:45.7 |
-0.79 |
|
1500 Metres Men |
03:49.0 |
03:46.1 |
-1.28 |
|
3000 Metres Steeplechase Men |
08:38.8 |
08:34.6 |
-0.83 |
|
20 Kilometres Race Walk Men |
1:21:07 |
1:21:08 |
0.02 |
|
50 Kilometres Race Walk Men* |
3:48:01 |
3:40:58 |
-3.19 |
|
100 Metres Hurdles Women |
00:12.8 |
00:12.6 |
-1.36 |
|
200 Metres Women |
00:22.8 |
00:22.7 |
-0.44 |
|
400 Metres Women* |
00:51.9 |
00:50.6 |
-2.70 |
|
800 Metres Women* |
02:02.3 |
02:00.1 |
-1.84 |
|
1500 Metres Women* |
04:10.7 |
04:05.1 |
-2.31 |
|
3000 Metres Steeplechase Women* |
09:47.4 |
09:22.3 |
-4.46 |
|
5000 Metres Women |
15:27.0 |
15:26.5 |
-0.05 |
|
10,000 Metres Women |
32:10.8 |
31:44.5 |
-1.38 |
|
20 Kilometres Race Walk Women |
1:28:13 |
1:28:15 |
0.03 |
|
Marathon Women* |
2:34:30 |
2:26:39 |
-5.35 |
|
Discipline |
Regular |
Disqualified |
Difference [%] |
|
Decathlon Men |
7978 |
8282 |
3.82 |
|
Hammer Throw Men* |
73.32 |
76.47 |
4.30 |
|
High Jump Men* |
2.25 |
2.30 |
2.20 |
|
Pole Vault Men |
5.46 |
5.52 |
1.10 |
|
Shot Put Men |
19.46 |
19.45 |
-0.07 |
|
Triple Jump Men |
16.55 |
16.71 |
0.95 |
|
Discus Throw Women |
62.57 |
63.16 |
0.94 |
|
Hammer Throw Women* |
68.71 |
70.42 |
2.48 |
|
High Jump Women |
1.94 |
1.96 |
0.74 |
|
Javelin Throw Women* |
58.62 |
64.39 |
9.84 |
|
Long Jump Women |
6.69 |
6.75 |
0.97 |
|
Shot Put Women |
18.75 |
18.70 |
-0.23 |
|
Triple Jump Women |
14.48 |
14.39 |
-0.59 |
Individual performance analysis
The individual performances of banned athletes were analysed by looking at their average regular and average disqualified results for each Olympic discipline they competed in. Only those who had at least 5 results in each result group (regular and disqualified) were taken into account.
The biggest difference among female athletes in favour of disqualified results is 13.82%, while, among male athletes, the biggest difference is 3.82%. The biggest differences are seen in field-specific events, for both women and men.
|
Athlete |
Discipline |
Regular results |
DQ results |
Difference [%] |
|
Darya Pishchalnikova |
Discus Throw Women |
56.23 |
64.00 |
13.82 |
|
Yevgeniya Kolodko |
Shot Put Women |
17.11 |
19.07 |
11.42 |
|
Mariya Bespalova |
Hammer Throw Women |
62.00 |
68.78 |
10.94 |
|
Mariya Abakumova |
Javelin Throw Women |
58.66 |
64.57 |
10.07 |
|
Bulgakova Anna |
Hammer Throw Women |
64.93 |
70.94 |
9.25 |
|
Athlete |
Discipline |
Regular results |
DQ results |
Difference [%] |
|
Aleksandr Pogorelov |
Decathlon Men |
7977.59 |
8282 |
3.82 |
|
Kirill Ikonnikov |
Hammer Throw Men |
74.07 |
76.51 |
3.29 |
|
Tsirikhov Soslan |
Shot Put Men |
19.06 |
19.51 |
2.35 |
|
Ivan Ukhov |
High Jump Men |
2.25 |
2.30 |
2.20 |
|
Dmitry Starodubtsev |
Pole Vault Men |
5.46 |
5.52 |
1.10 |
For some athletes, their regular results actually outperformed their DQ’d results.
This is most evident in the female field competitions - particularly the javelin where regular results were up to 5.76% better than disqualified results. Men, on the other hand, only have 3 disciplines where regular results were better than disqualified results and those are all track disciplines.
|
Athlete |
Discipline |
Regular results |
DQ results |
Difference [%] |
|
Yakovenko Mariya |
Javelin Throw Women |
54.19 |
51.07 |
5.76 |
|
Svetlana Krivelyova |
Shot Put Women |
19.16 |
18.28 |
4.62 |
|
Andrianova Tatyana |
800 Metres Women |
02:01.9 |
02:05.2 |
2.72 |
|
Tatyana Lebedeva |
Long Jump Women |
6.82 |
6.72 |
1.44 |
|
Pyatykh Anna |
Triple Jump Women |
14.29 |
14.12 |
1.21 |
|
Athlete |
Discipline |
Regular results |
DQ results |
Difference [%] |
|
Maksim Dyldin |
400 Metres Men |
00:45.4 |
00:45.6 |
0.38 |
|
Valeriy Borchin |
20 Kilometres Race Walk Men |
19:30.6 |
19:44.8 |
0.30 |
|
Denis Alekseyev |
400 Metres Men |
00:45.8 |
00:45.8 |
0.04 |
The results (achieved by Yuliya Kondakova, Ekaterina Galitskaia, Svetlana Shkolina, Ivan Ukhov, and Lyukman Adams) for which appeals were pending before the CAS at the moment of publishing this piece were considered as disqualified.
Let the shoes (not doping) make the difference
For all those additional workouts outside track, we test shoes on the road, in the gym, and in the lab road running shoes and training footwear. We buy them with our own money and tear them apart in the lab. Because of this, we publish 100% unbiased shoe reviews.
Use of Content
- Feel free to use any text sections, the data, and the graphics for web usage. We just ask that you refer and link back to this original piece.
- For print usage, questions or interviews on the topic, reach out to jovana@runrepeat.com.
