Shoe Consumption Statistics
The footwear market has fully recovered since the pandemic. As a consequence, the worldwide shoe consumption is also on the rise. The variety of numerical data in this report presents the highs and lows and the twists and trends of global shoe consumption throughout the years and toward the future.
Top shoe consumption statistics
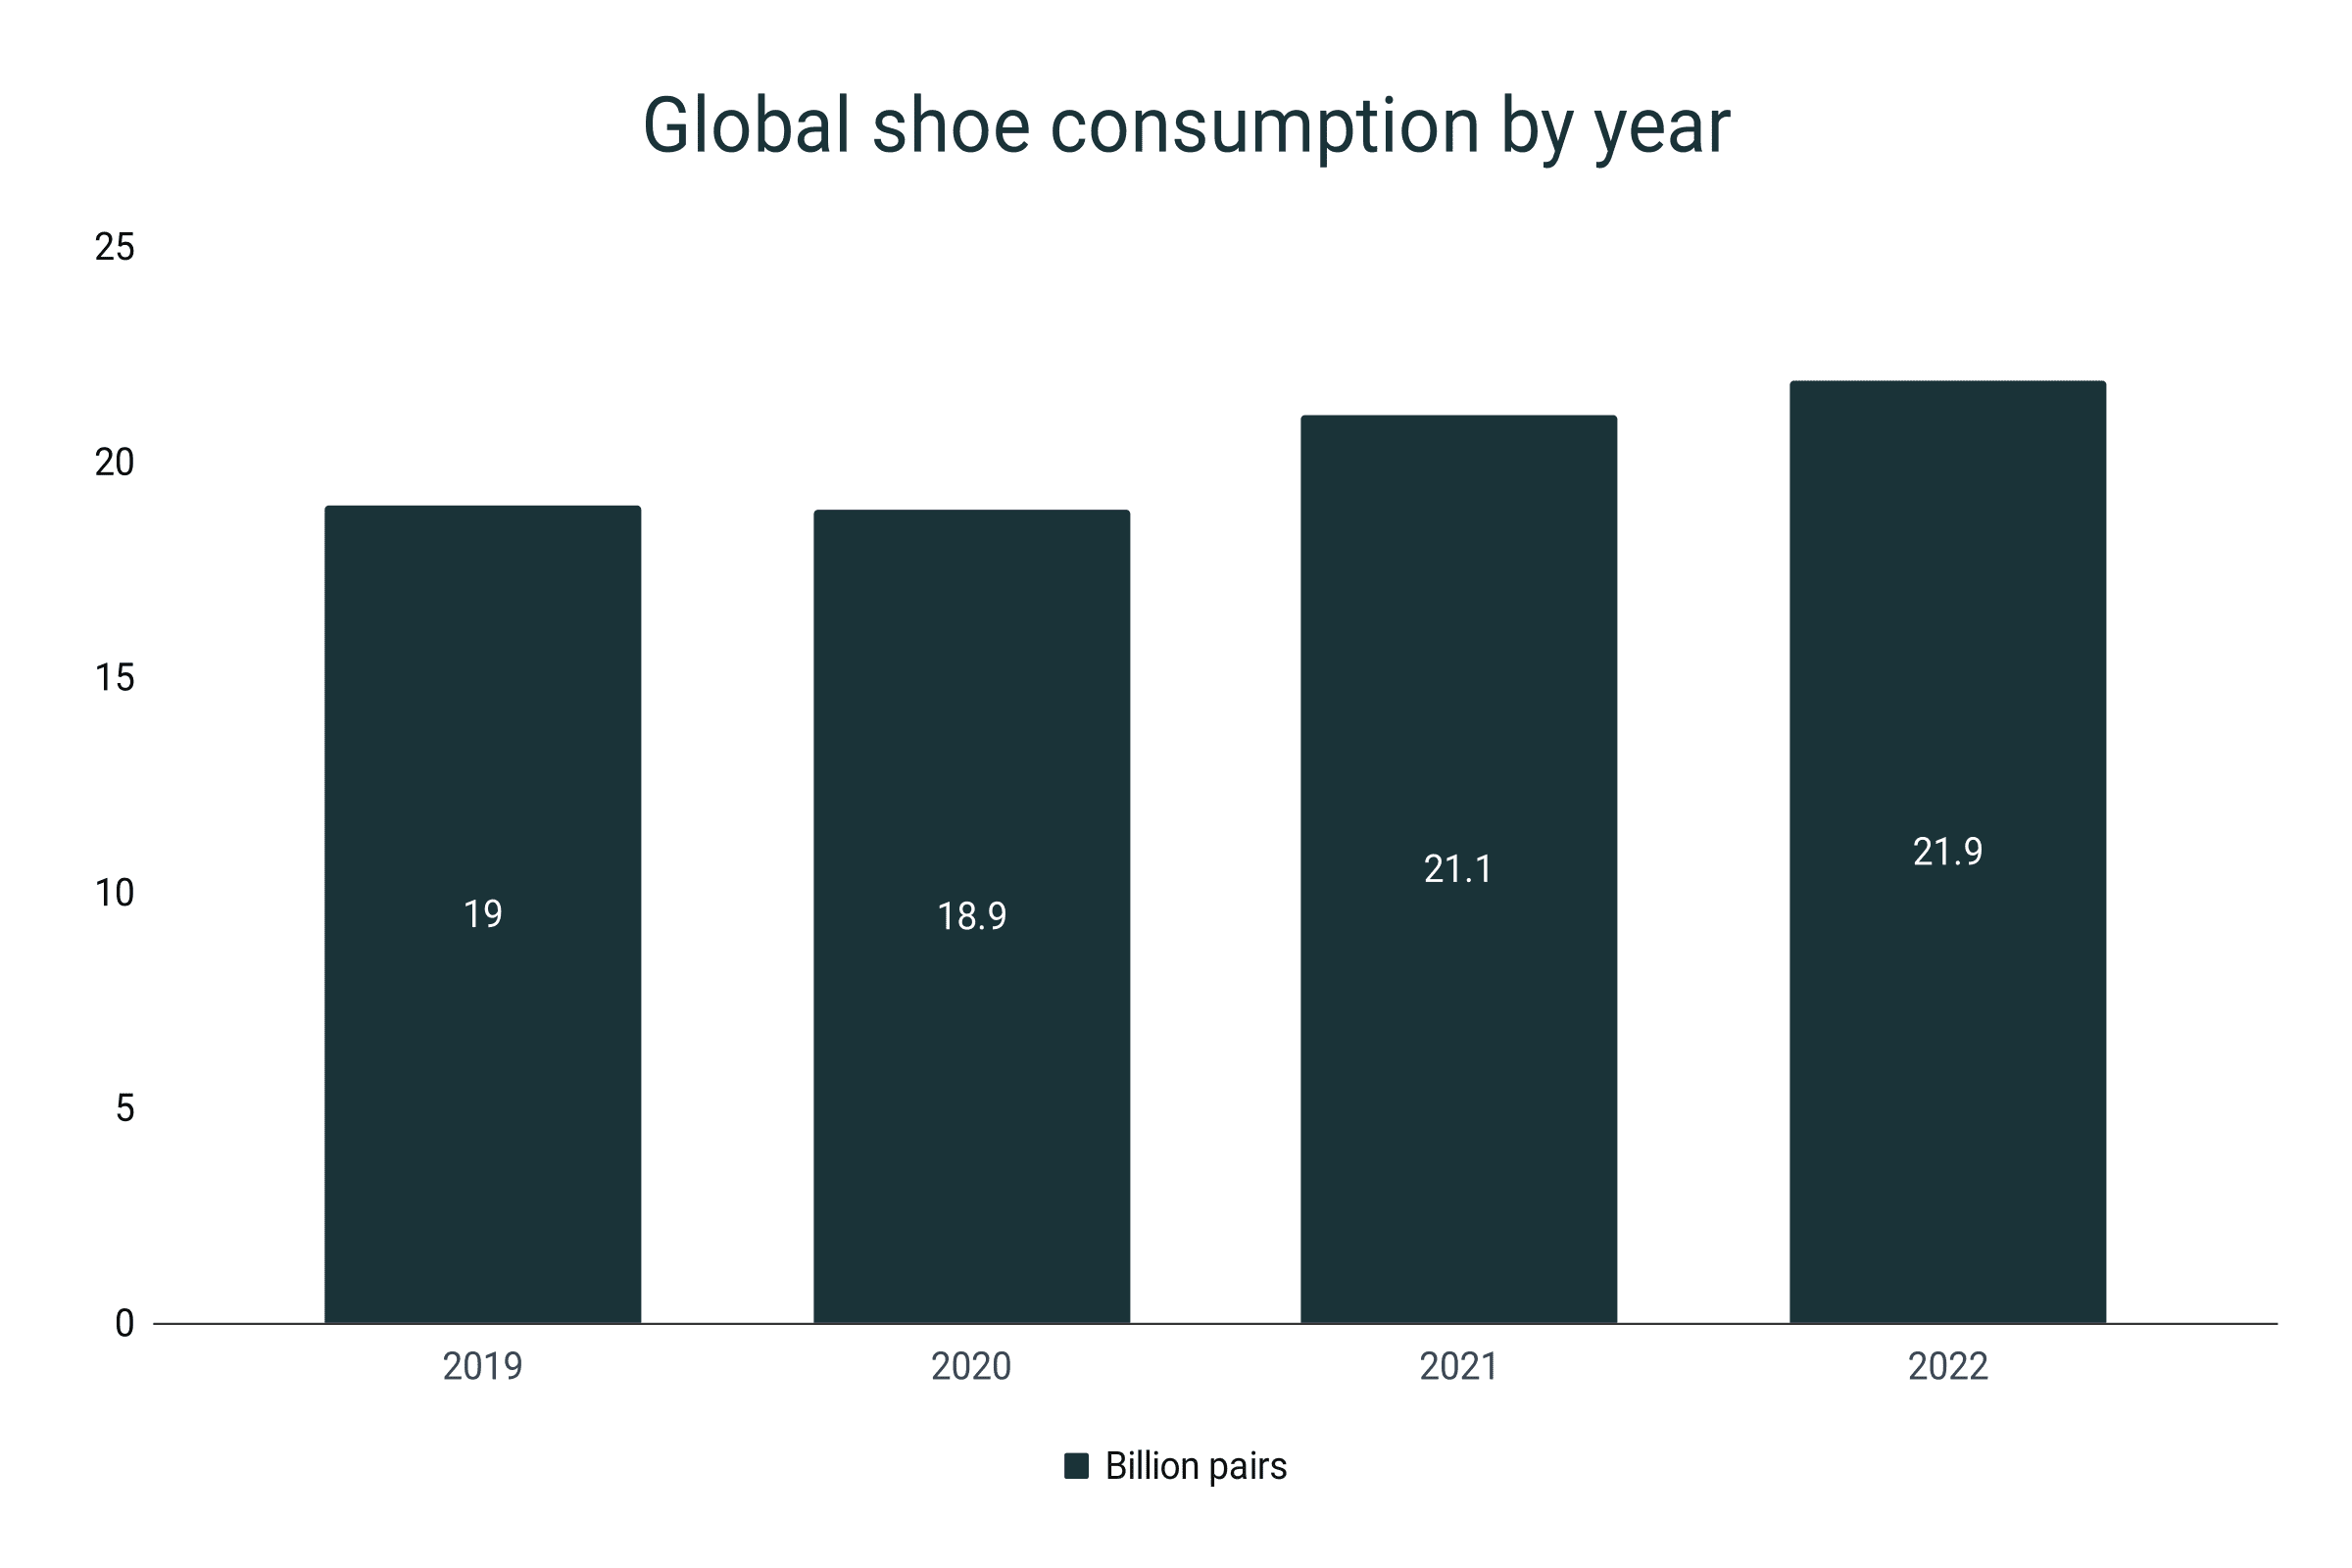
- By the end of 2022, a total of 21.9 billion pairs of shoes were consumed worldwide.
- From 2019 to 2022, the world shoe consumption has grown by 15.3%.
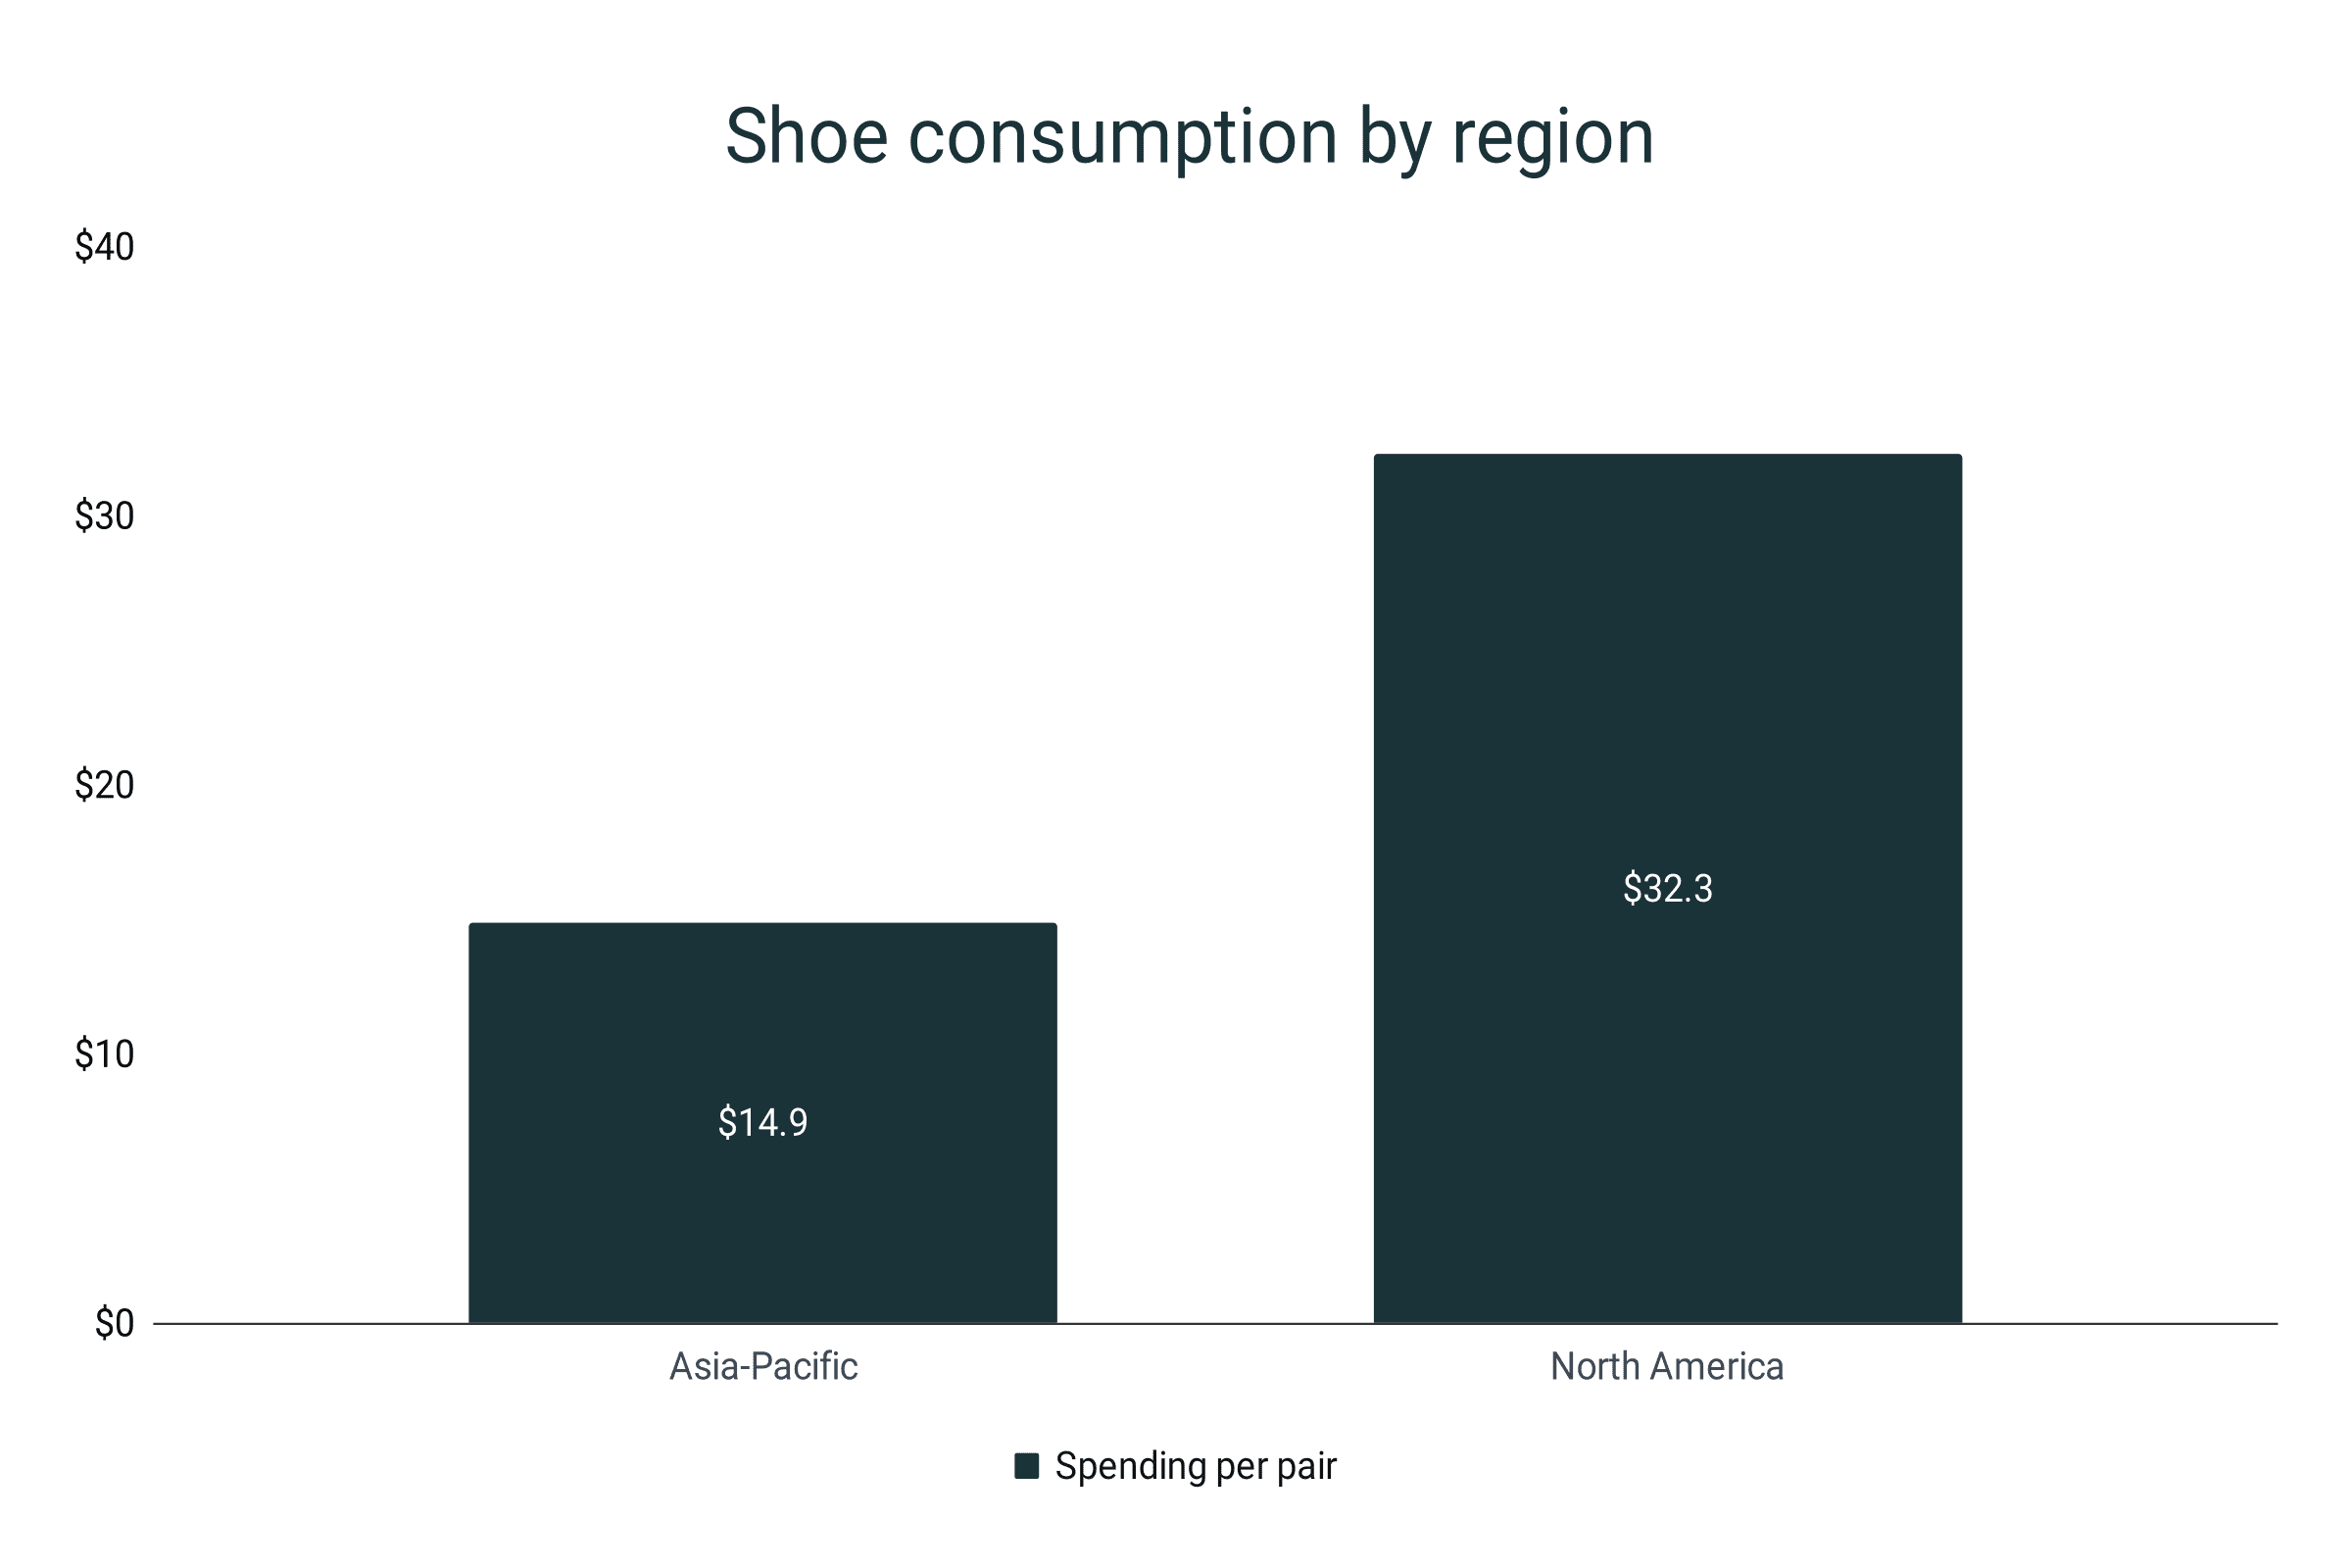
- North American footwear consumers buy 7.4 pairs of shoes every year and spend $32.3 on each pair on average.
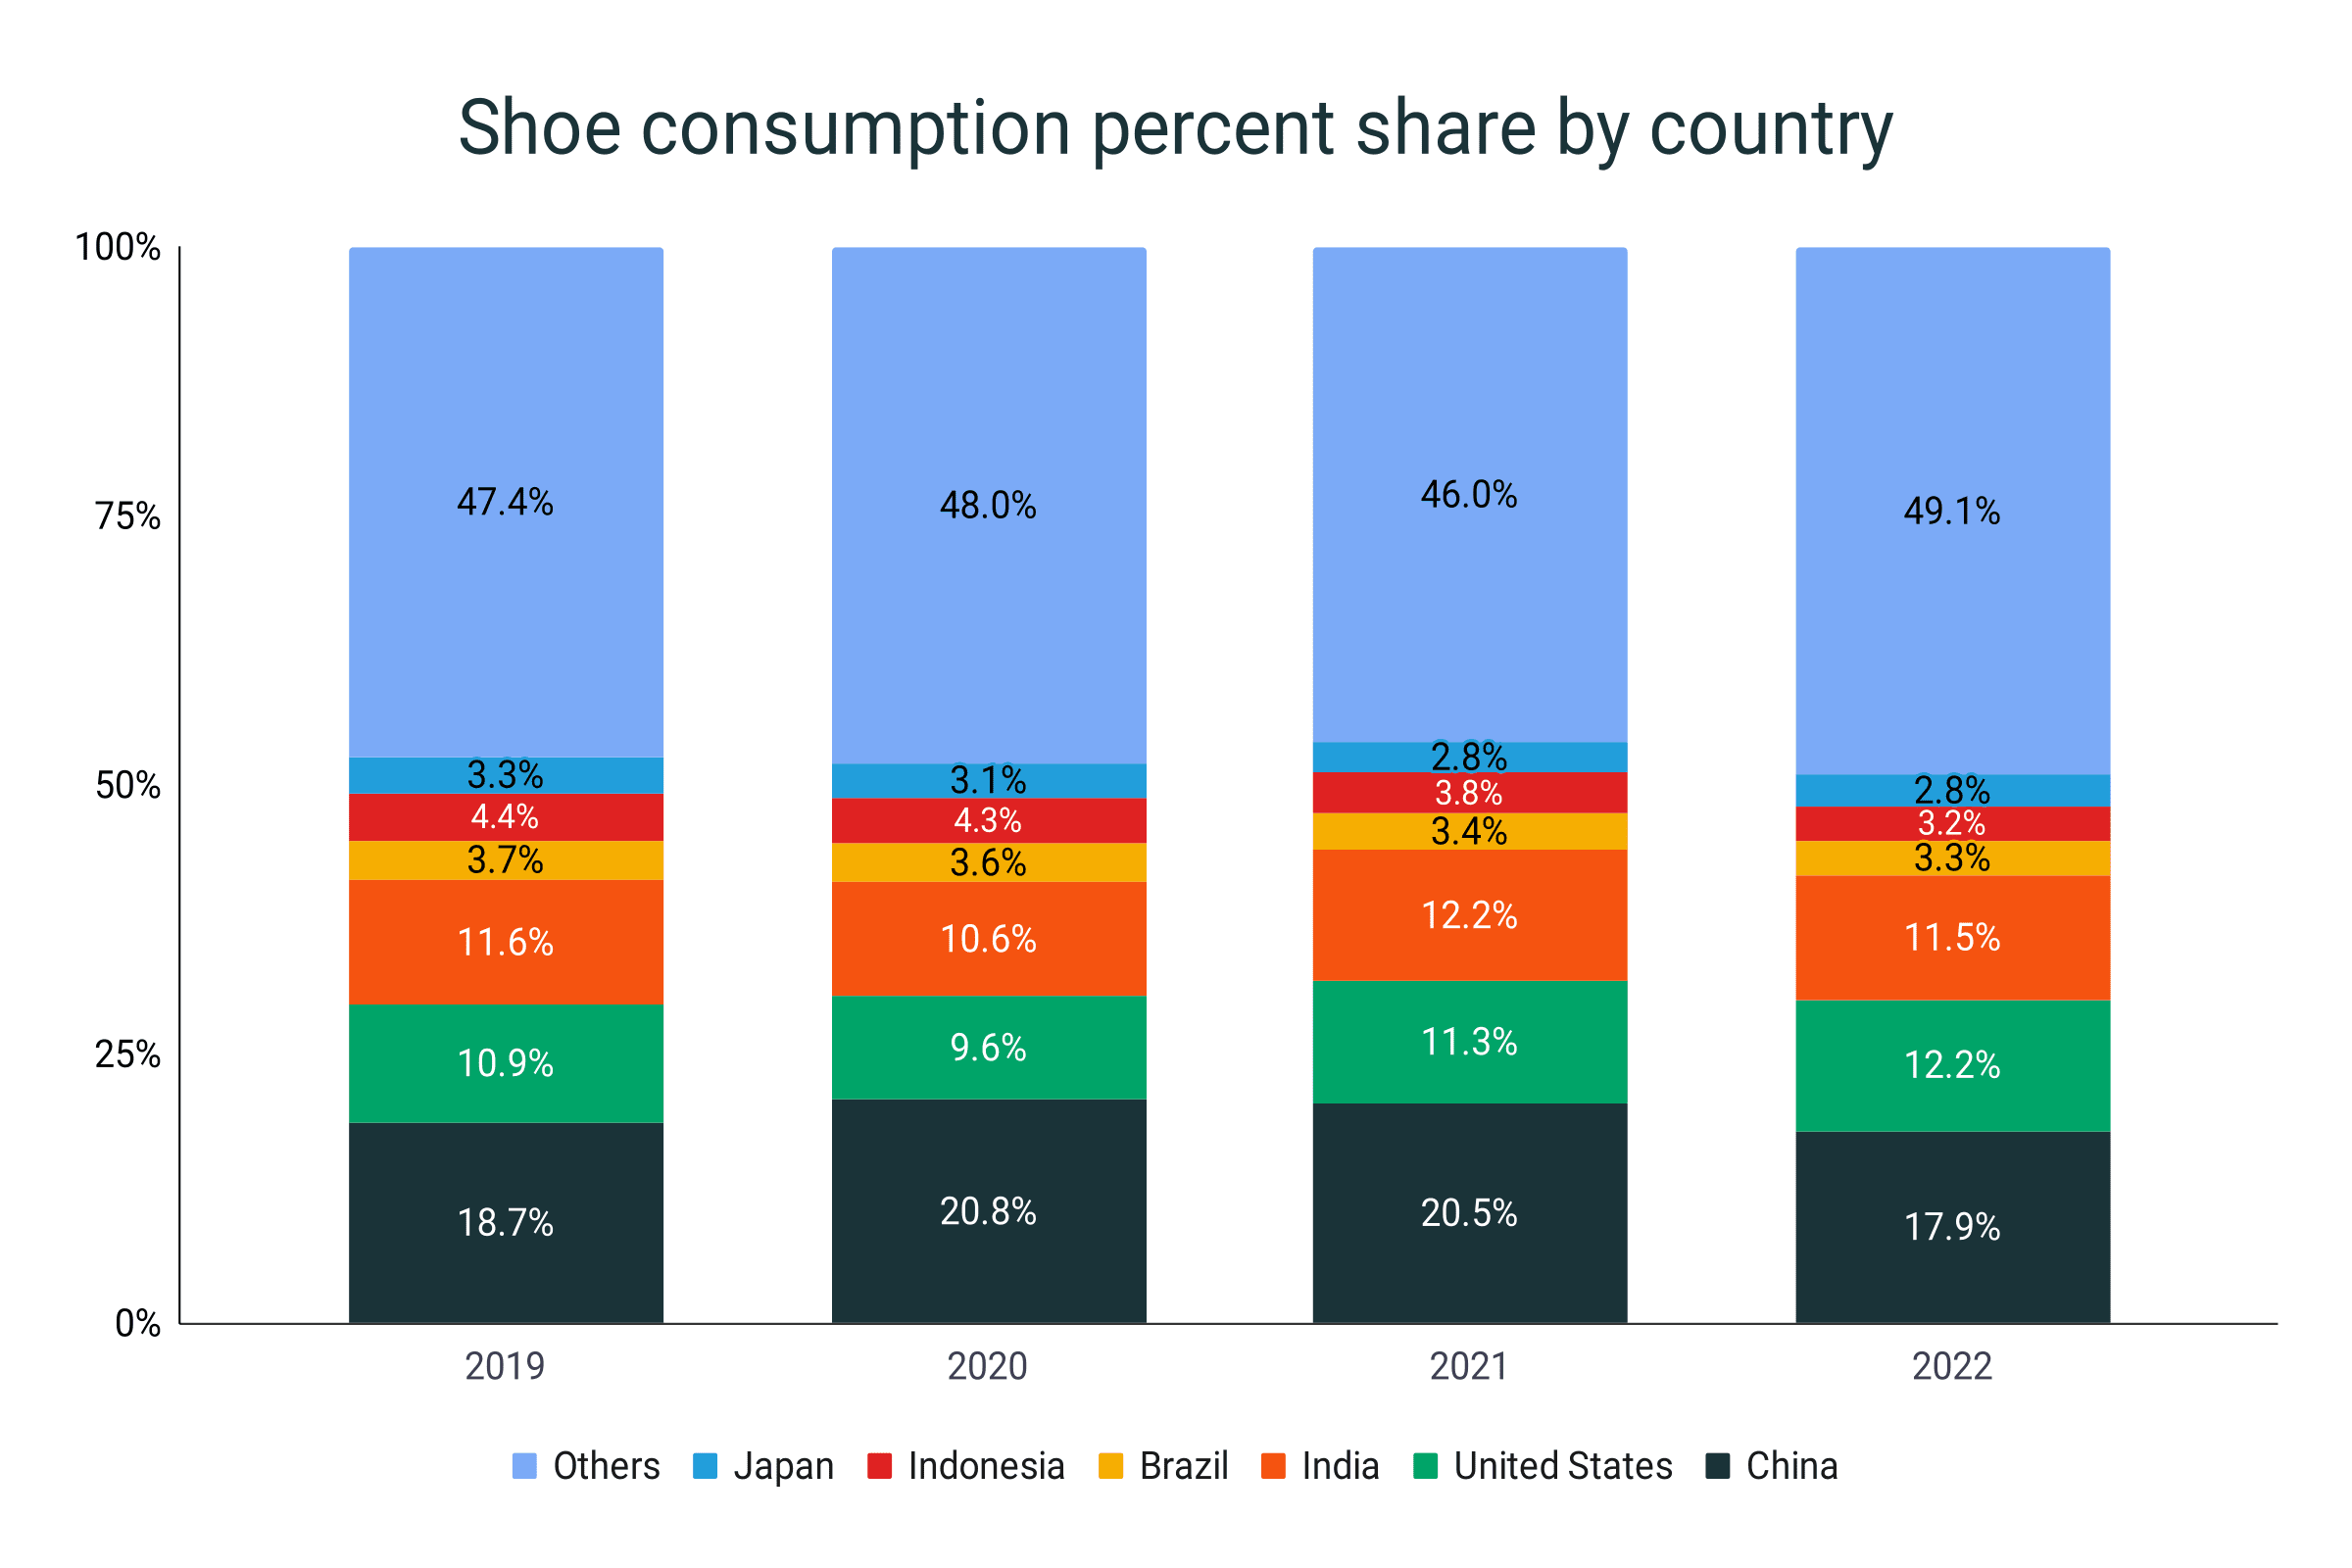
- Despite falling to 17.9% in 2022 compared to 20.5% in 2021, China still was the top footwear consumer in the world. The United States and India took the second and third spots, respectively.
- In 2022, the percent share of the six top shoe-consuming countries, China, United States, India, Brazil, Indonesia, and Japan, took up 50.9% of the overall footwear consumption. The rest of the countries combined totaled to 49.1%.
- About 300 million people in the world still cannot afford to buy a pair of shoes.
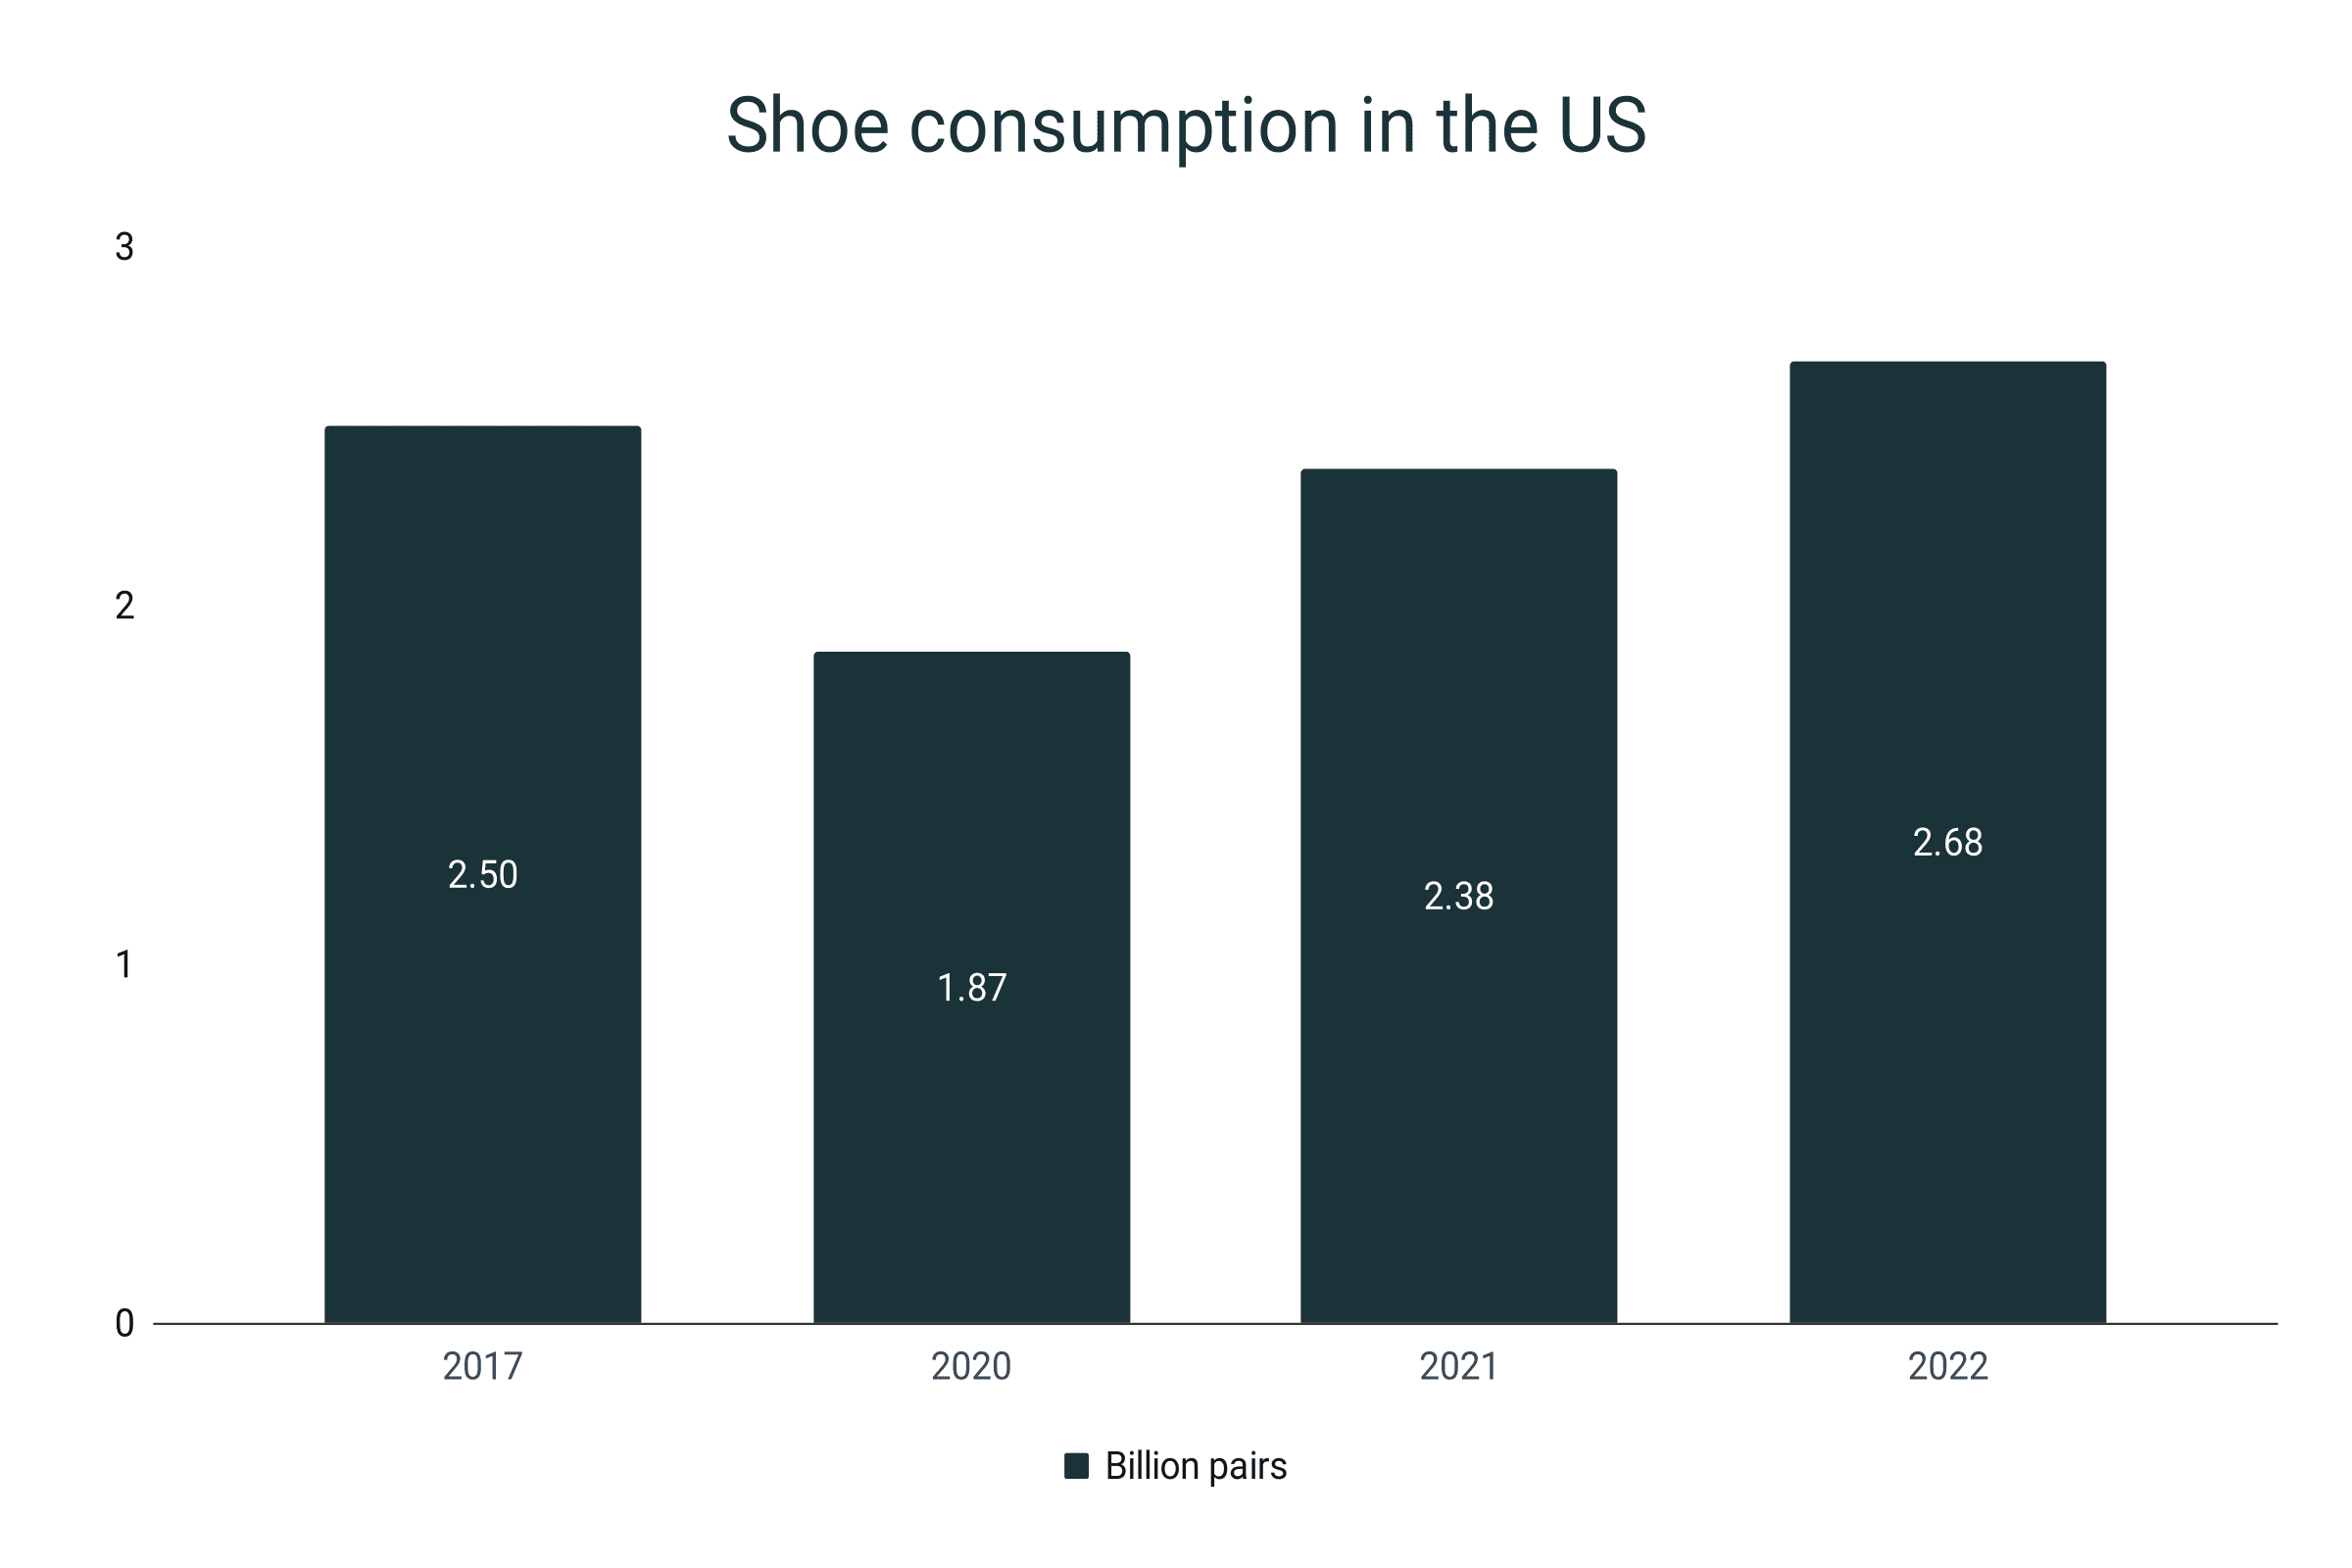
- The shoe consumption in the United States grew by 12.7%, reaching 2.68 billion pairs in 2022.
- Americans spend an average of $735 on shoes every year.
- Approximately 4.6 billion people still buy shoes in-store. Meanwhile, 2 billion people prefer buying their shoes online.
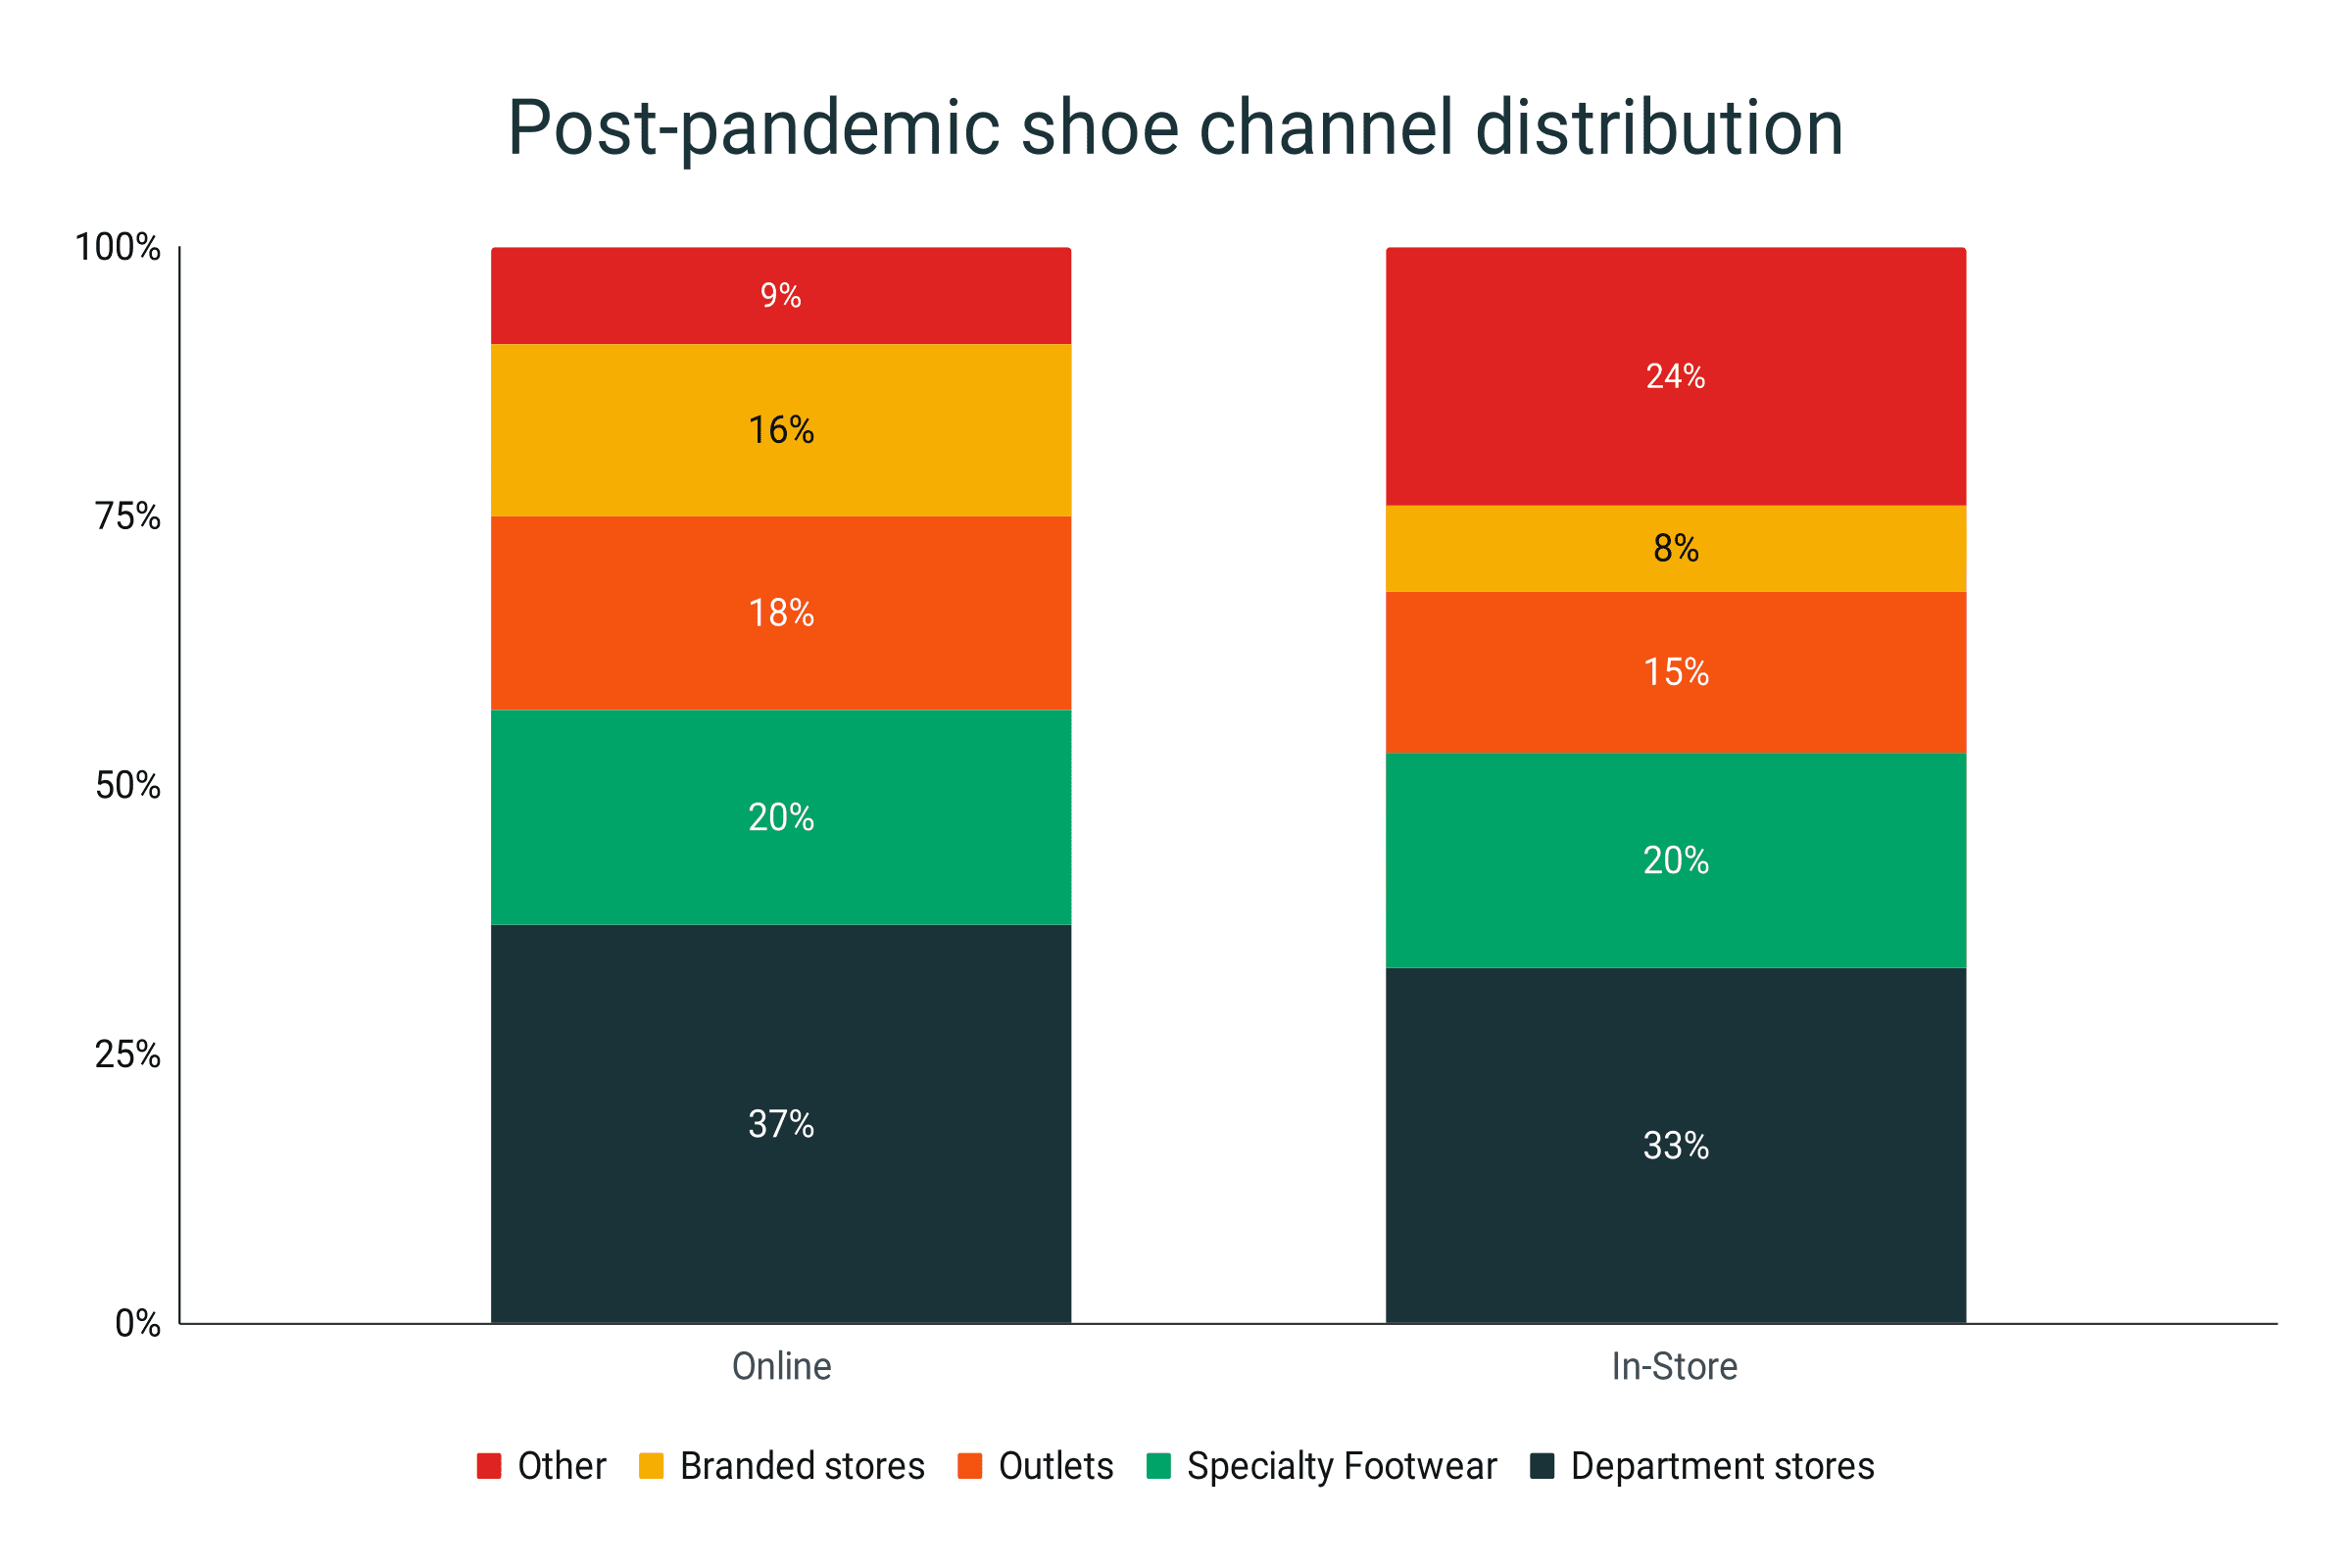
- 37% and 33% of online and in-store footwear shoppers purchase shoes in department stores.
- On average, Americans spent $155 on women’s shoes in 2020.
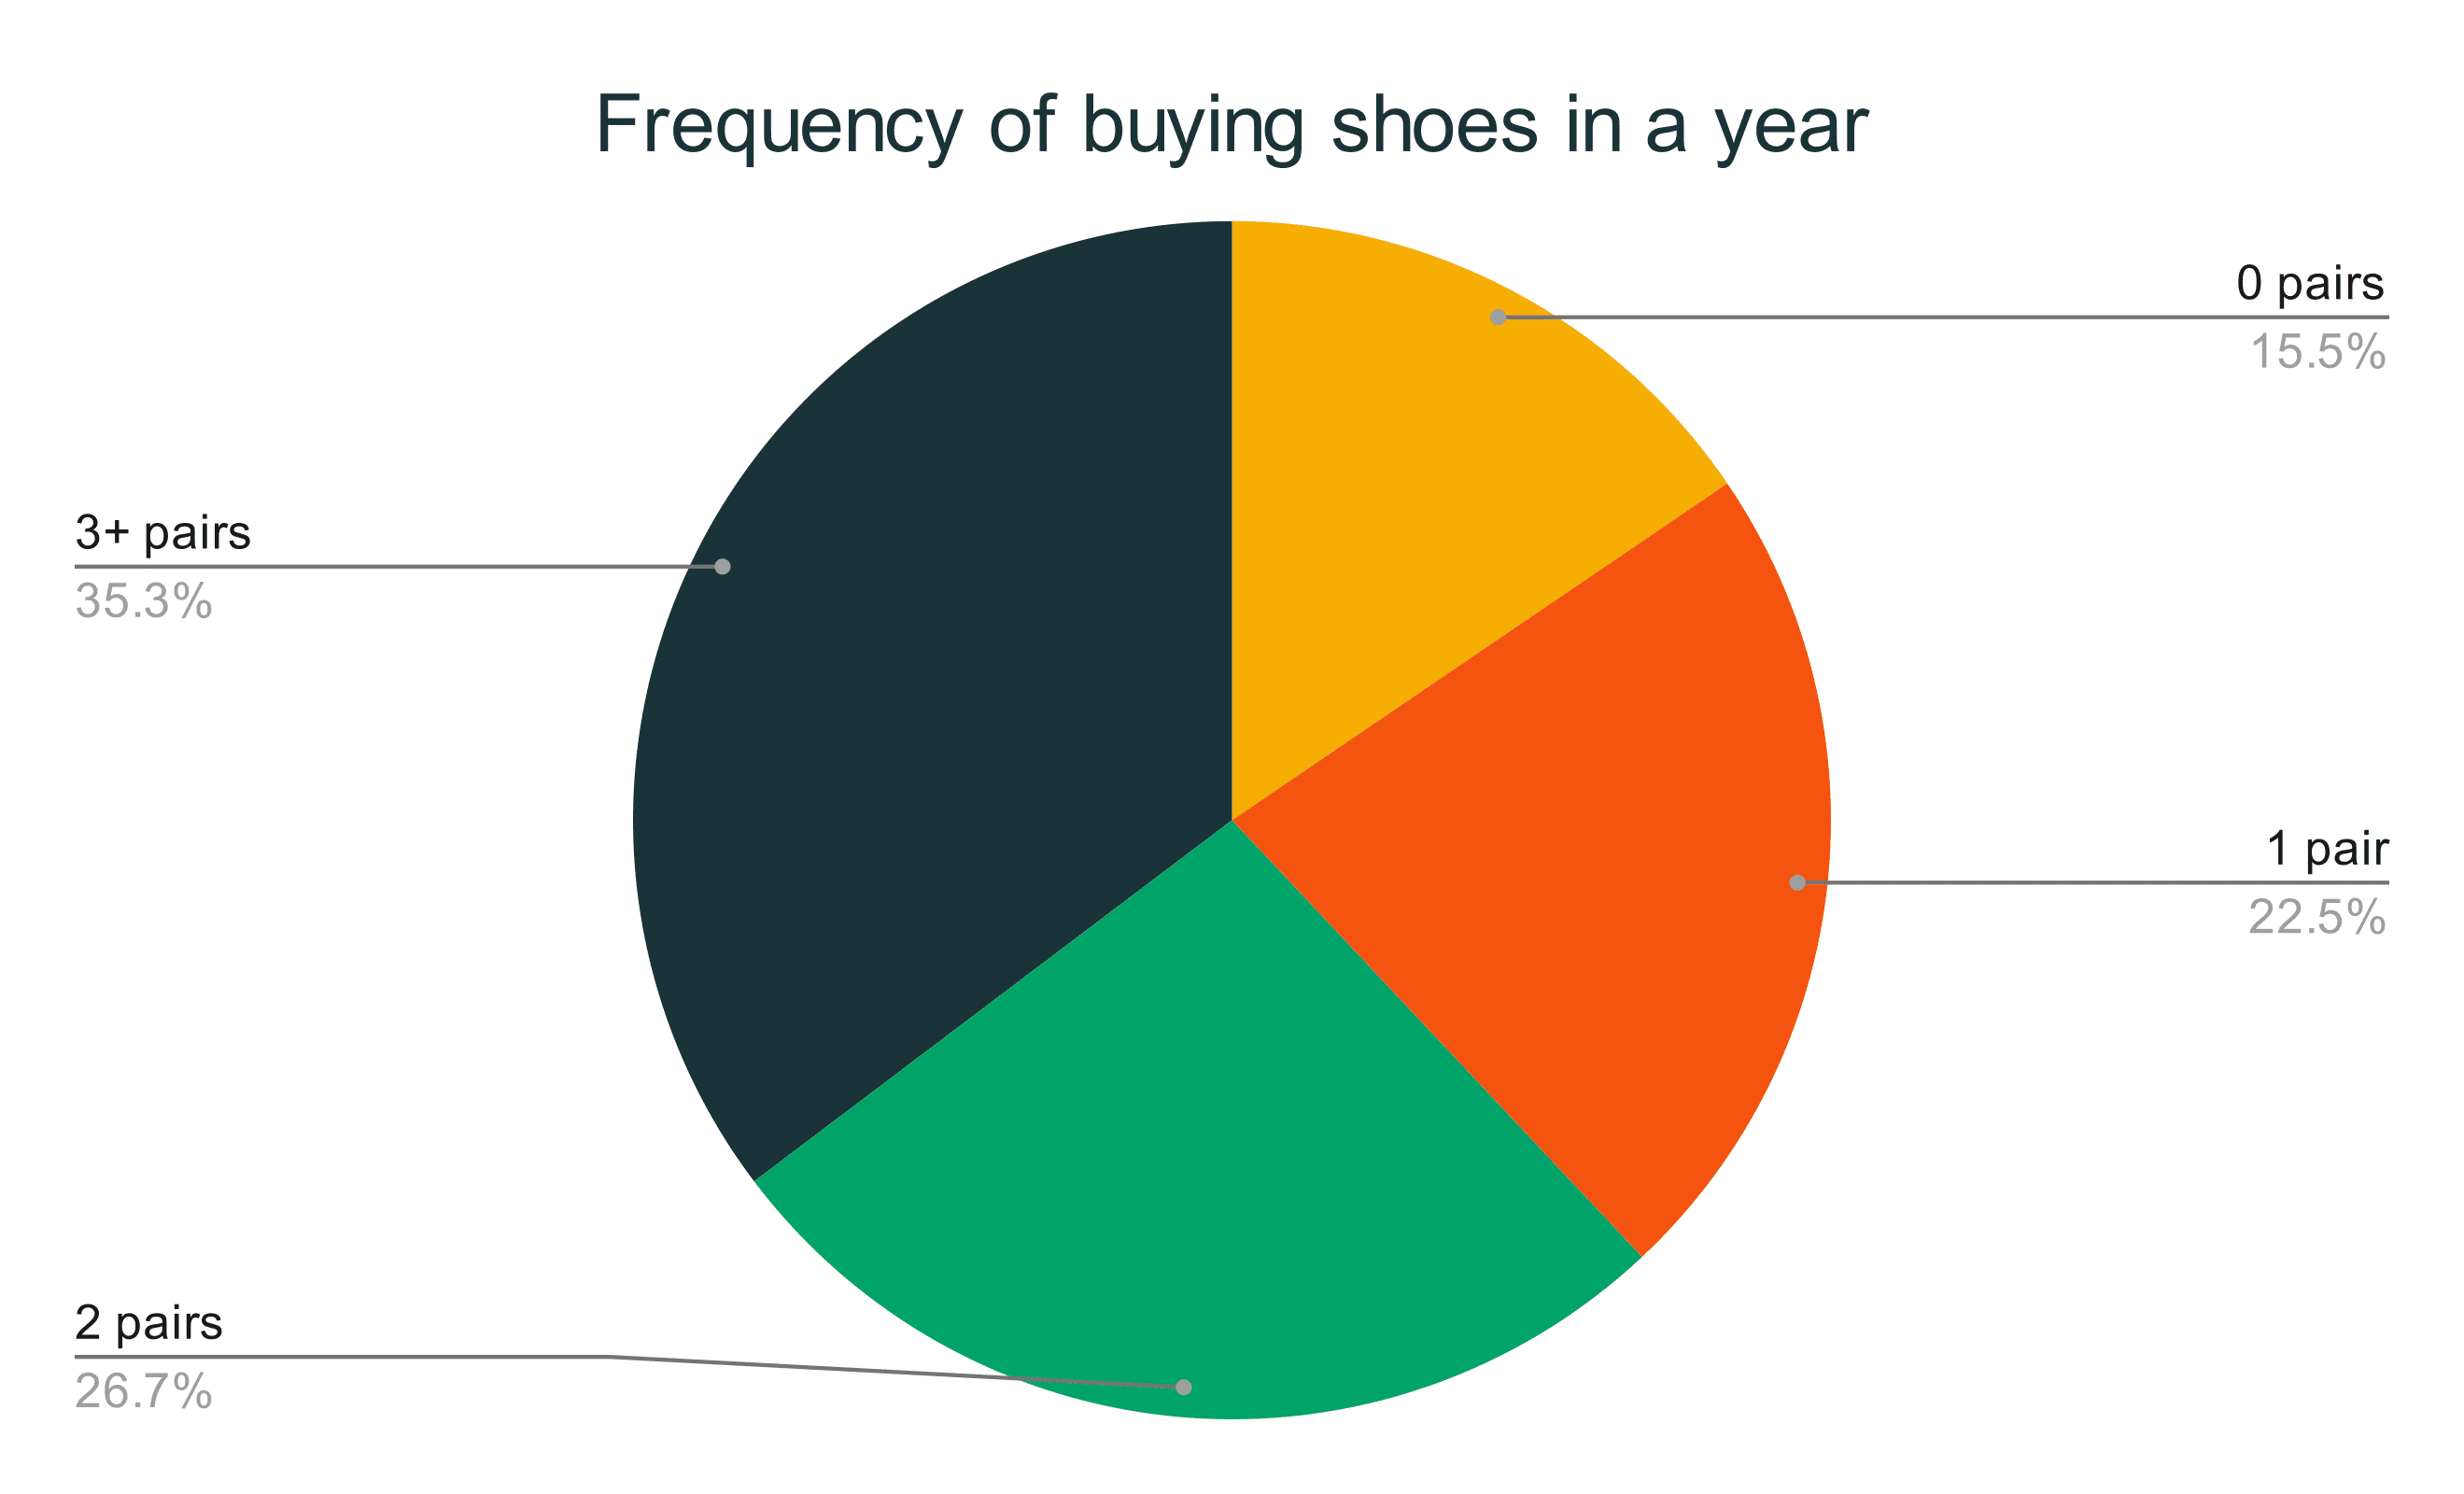
- 35.3% of shoe shoppers buy 3 or more shoes annually.
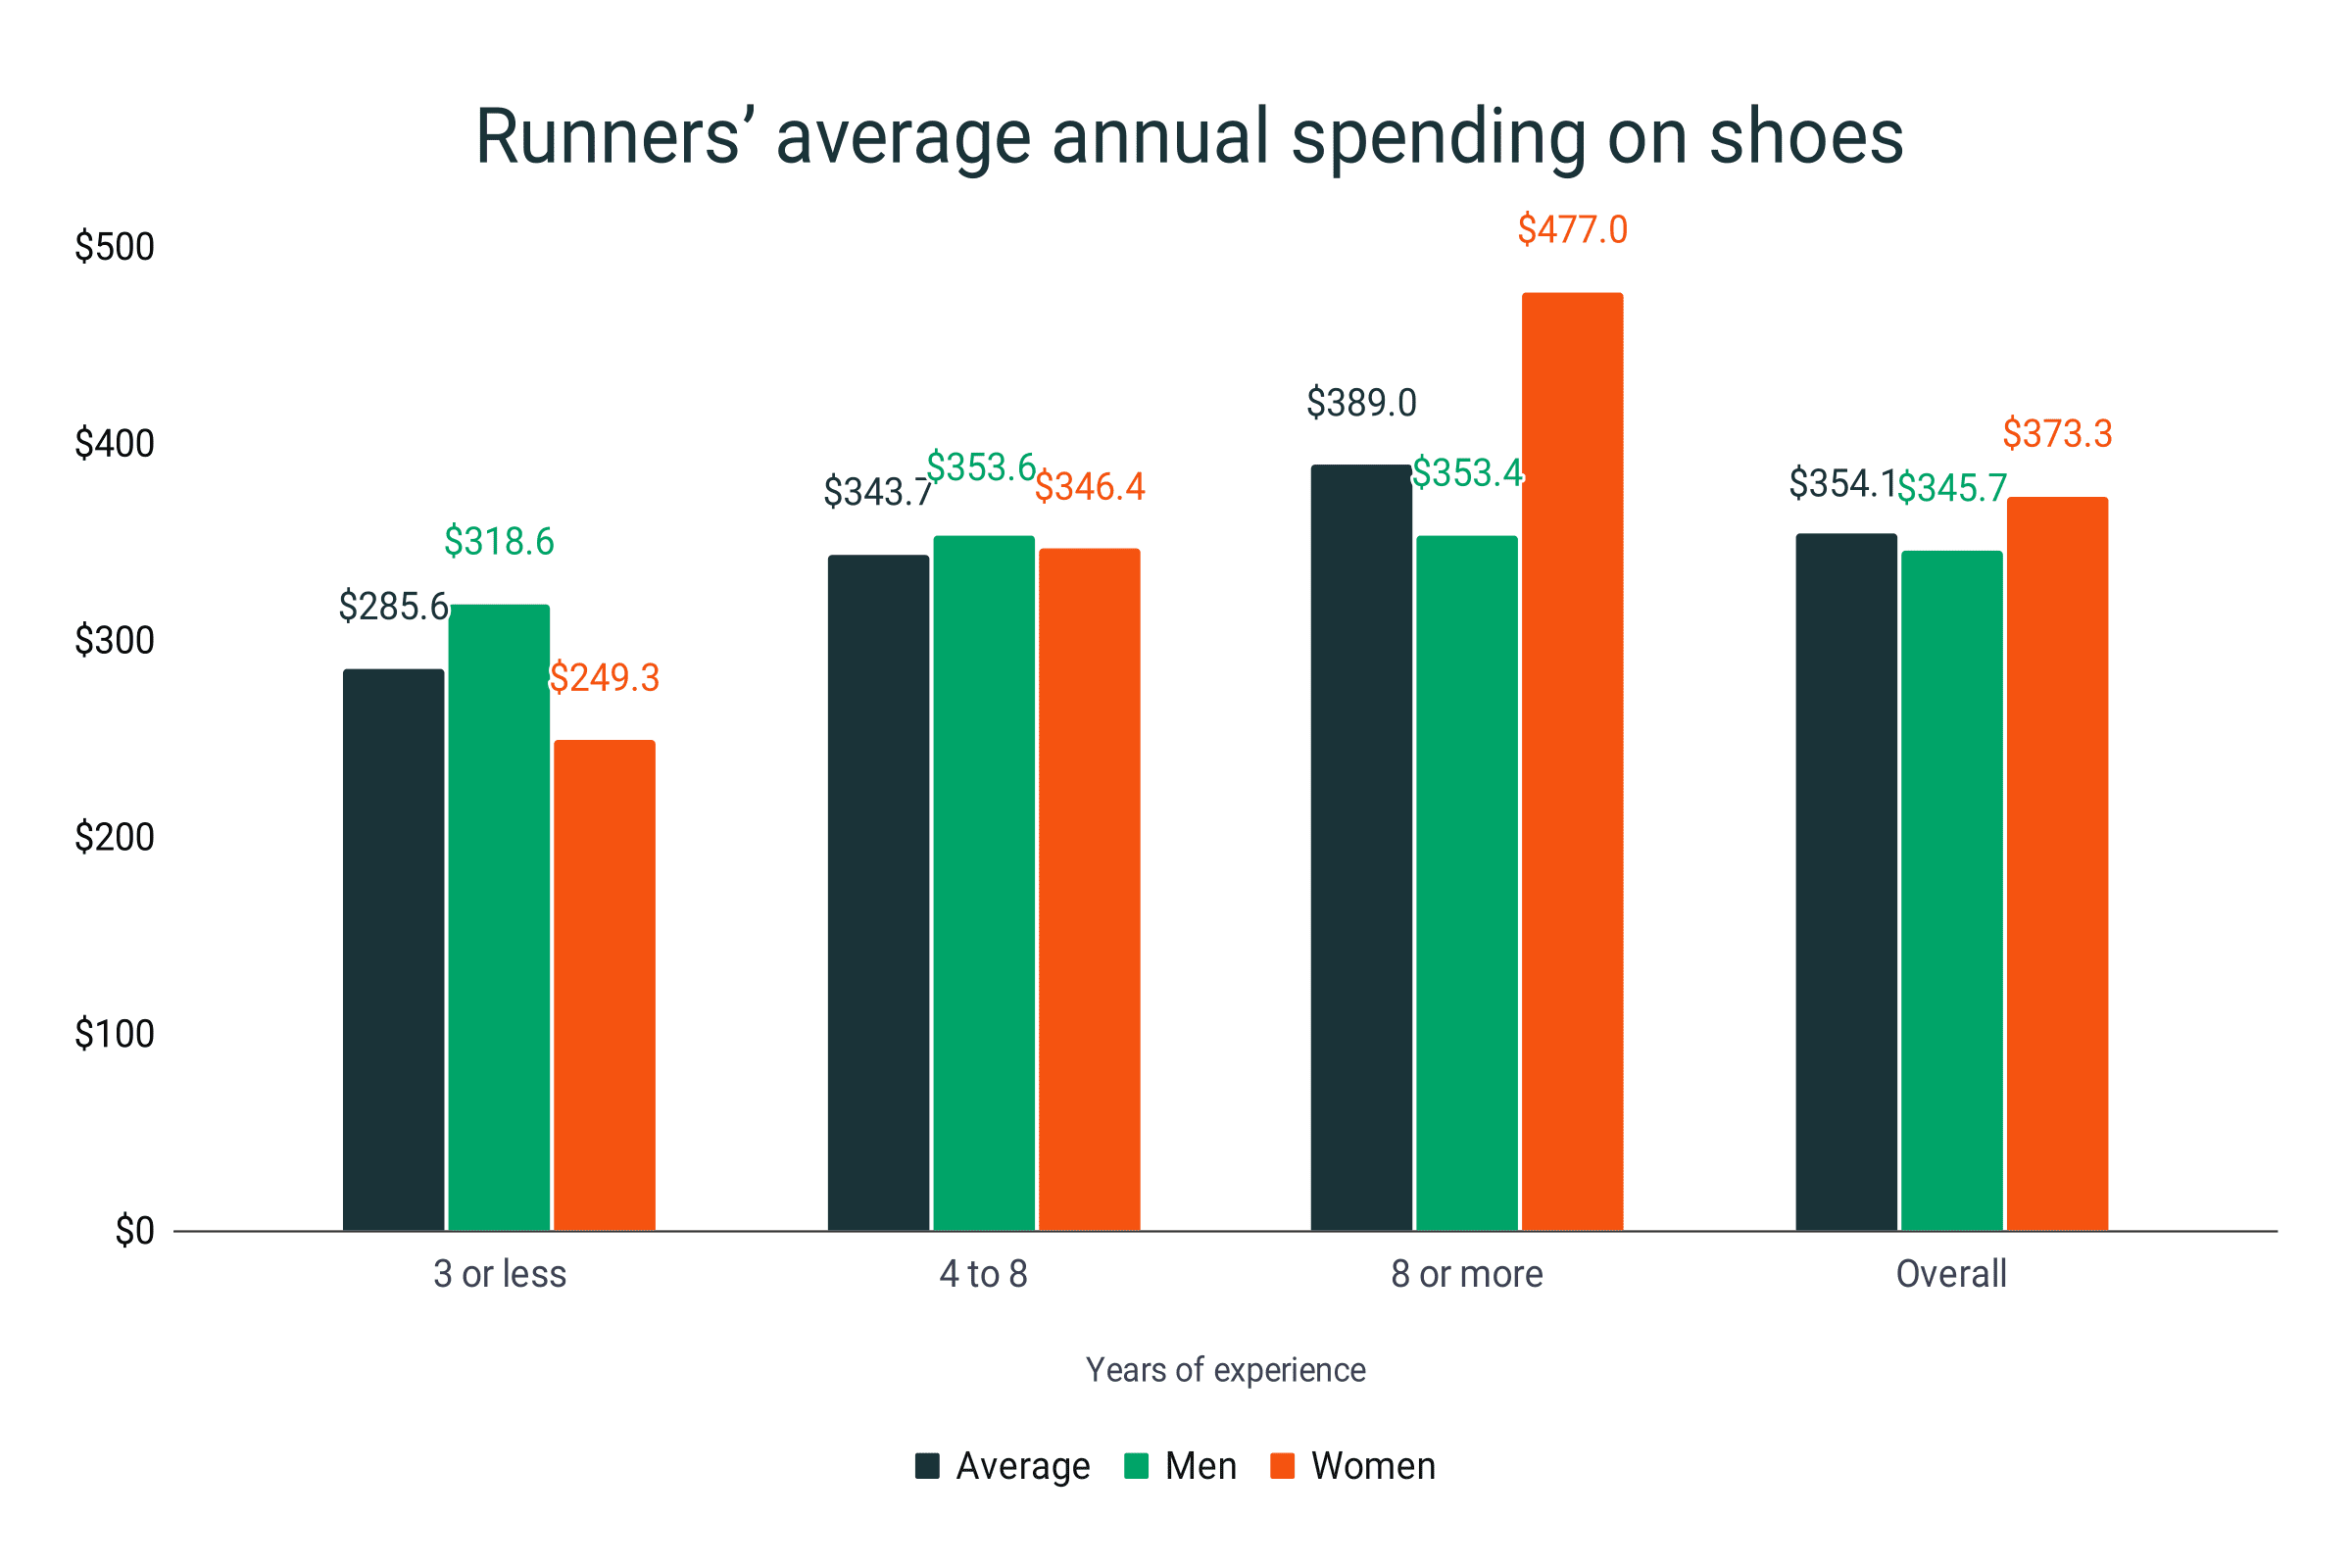
- Women runners spend $373.3 on footwear, about 8% more than the $345.7 average spending of men runners.
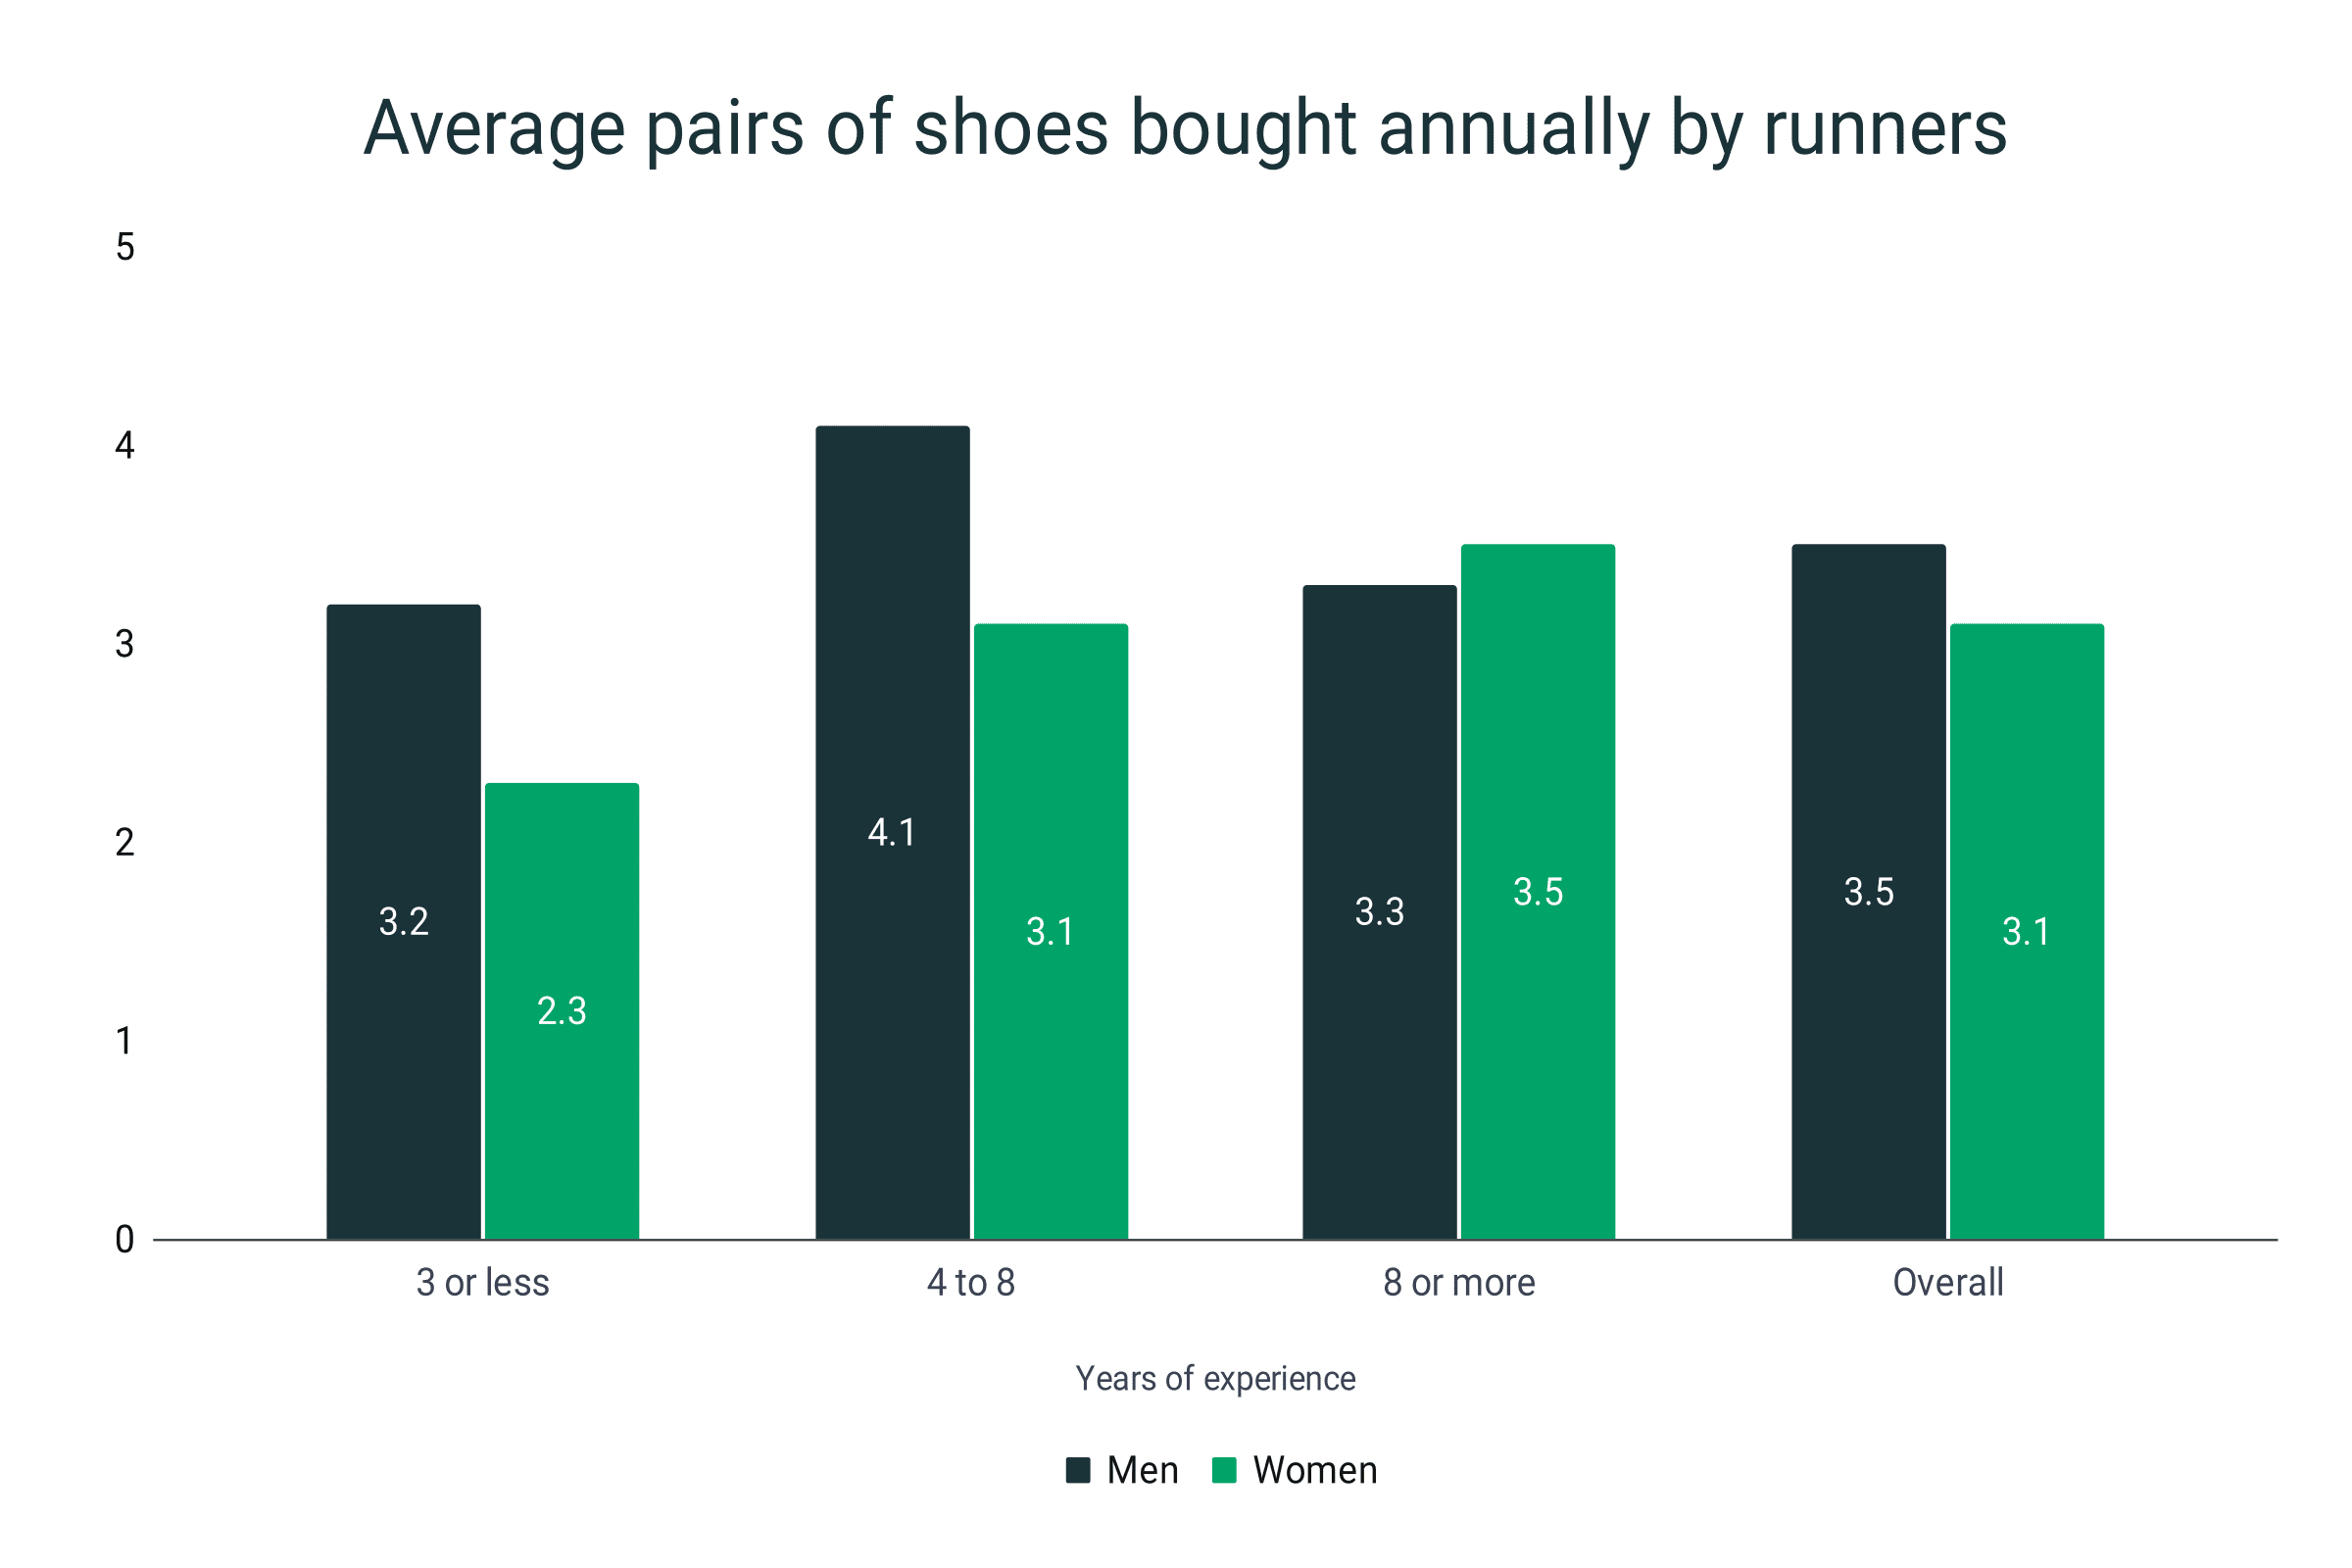
- But in terms of pairs, men runners buy 3.5 pairs of shoes every year as opposed to the 3.1 average of women runners.
- Basketball players consume about 200 pairs of shoes in a regular 82-game season of the NBA.
Shoe consumption by year
- 21.9 billion pairs of shoes were sold globally in 2022.
- This is 3.8% more than the 21.1 billion figure of 2021.
- In 2020, the world shoe consumption dropped by 0.5%. Around 18.9 billion pairs of shoes were bought worldwide during this year.
- In 2019, the global shoe consumption reached 19 billion pairs.
- From 2019 to 2022, the average shoe consumption worldwide was 20.2 billion pairs per year.
- That is roughly equal to two pairs of shoes bought by each person on the planet every year.
Global shoe consumption by year
|
Year |
Billion pairs |
Growth |
|
2019 |
19.0 |
|
|
2020 |
18.9 |
-0.5% |
|
2021 |
21.1 |
11.6% |
|
2022 |
21.9 |
3.8% |
Shoe consumption by region
- On average, each person from the Asia-Pacific region consumes 1.7 pairs of shoes annually.
- The average spending of a consumer from the Asia-Pacific region is $14.9 per pair.
- In the North American region, each shopper buys 7.4 pairs of shoes every year.
- They also spend more at $32.3 for each pair.
- Chinese shoe consumers have spent $56.5 billion in 2017.
- That amounted to a total of 3.9 billion pairs of shoes or $14.5 for each pair on average.
Shoe consumption and spending by region
|
Region |
No. of pairs per year |
Spending per pair |
|
Asia-Pacific |
1.7 |
$14.9 |
|
North America |
7.4 |
$32.3 |
Shoe consumption by country
- China was the top footwear consumer in 2022. The country took a 17.9% share of global shoe consumption during this time.
- Although China retained the top spot for four consecutive years from 2019-2022, the percentage share showed a decline. China started with an 18.7% share in 2019 and peaked at 20.8% in 2020.
- In 2021, China slowly deflated to a 20.5% share in global shoe consumption before losing another 2.9% in 2022.
- The United States snatched the second spot, overthrowing India. The US ended up with a 12.2% share versus India's 11.5%.
- Previously, India was the second-biggest shoe-consuming country with 11.6% in 2019 and 12.2% peak in 2021.
- Brazil, Indonesia, and Japan trail with 3.3%, 3.2%, and 2.8% in 2022. Indonesia was dethroned by Brazil during the same year as the third top shoe consumer.
- Back in 2021, Indonesia grabbed a 3.8% portion of the global footwear consumption. Meanwhile, Brazil had 3.4% during this year.
- Indonesia has exhibited a downward trajectory in shoe consumption since 2019. It started with a 4.4% footing and ended up giving away 1.2% of its market share in 2021.
- Japan also experienced a similar trend with 3.3% in 2019 and now down to a 2.8% share in 2022.
- The rest of the world combined amounted to 49.1% of the global shoe consumption of 2022.
- The combined percent shares of China, United States, India, Brazil, Indonesia, and Japan, constitute an average of 52.4% of the global shoe consumption.
- 63% of the annual retail value of shoes consumed around the world is concentrated in just 10 major markets in Europe, Asia, and the Americas.
- Additionally, the same 10 markets consume 69% of the total volume of shoes consumed every year.
- However, there is an estimated 300 million people in the world that can’t afford to buy one pair of shoes.
Shoe consumption percent share by country
|
Year |
China |
United States |
India |
Brazil |
Indonesia |
Japan |
Others |
|
2019 |
18.7% |
10.9% |
11.6% |
3.7% |
4.4% |
3.3% |
47.4% |
|
2020 |
20.8% |
9.6% |
10.6% |
3.6% |
4.3% |
3.1% |
48.0% |
|
2021 |
20.5% |
11.3% |
12.2% |
3.4% |
3.8% |
2.8% |
46.0% |
|
2022 |
17.9% |
12.2% |
11.5% |
3.3% |
3.2% |
2.8% |
49.1% |
Shoe consumption in the United States
- The shoe consumption in the United States saw a 12.7% growth in 2022.
- From 2.38 billion pairs bought in 2021, the American population purchased a total of 2.68 billion pairs of shoes by the end of 2022.
- However, the biggest growth in shoe consumption behavior in the US happened right after the pandemic. The number of shoes consumed in the country rose by 27.3% between 2020 and 2021.
- Back in 2017, the American consumer population consumed 2.5 billion pairs of shoes.
- In monetary value, that is equivalent to $74.1 billion in shoes.
- From 2017 to 2020, shoe consumption in the United States experienced a 25.2% decline.
- But comparing the figures from 2017 to 2022, there is a 7.2% overall increase.
- On average, an American consumer spends $735 annually on shoes.
Shoe consumption in the US
|
Year |
Billion pairs |
Growth |
|
2017 |
2.50 |
|
|
2020 |
1.87 |
-25.2% |
|
2021 |
2.38 |
27.3% |
|
2022 |
2.68 |
12.7% |
Shoe consumption by channel
- Based on estimates the number of people who bought shoes online by the end of 2023 will be over 2 billion.
- On the other hand, approximately 70% or 7 out of every 10 people worldwide buy shoes in stores.
- Meaning, about 4.6 billion people still prefer buying shoes in physical stores.
- As of 2021, 37% of online shoe shoppers buy from department store sites.
- Physical department stores also lead the in-store pack with a 33% share in the choice of shopping channel among customers.
- 20% of online shoe buyers go to specialty footwear websites while 18% purchase from online outlets.
- Additionally, 16% buy their shoes online from branded stores.
- In terms of in-store shopping, 20% visit specialty footwear stores when buying shoes.
- 15% procure shoes from outlets while 8% seek branded stores.
- However, for in-store shoe shopping, 24% buy their shoes from other channels such as local stores and boutiques.
Post-pandemic shoe channel distribution
|
Channel |
Online |
In-Store |
|
Department stores |
37% |
33% |
|
Specialty Footwear |
20% |
20% |
|
Outlets |
18% |
15% |
|
Branded stores |
16% |
8% |
|
Other |
9% |
24% |
- According to estimates, 75% of footwear shopping over the next few years will be through online transactions.
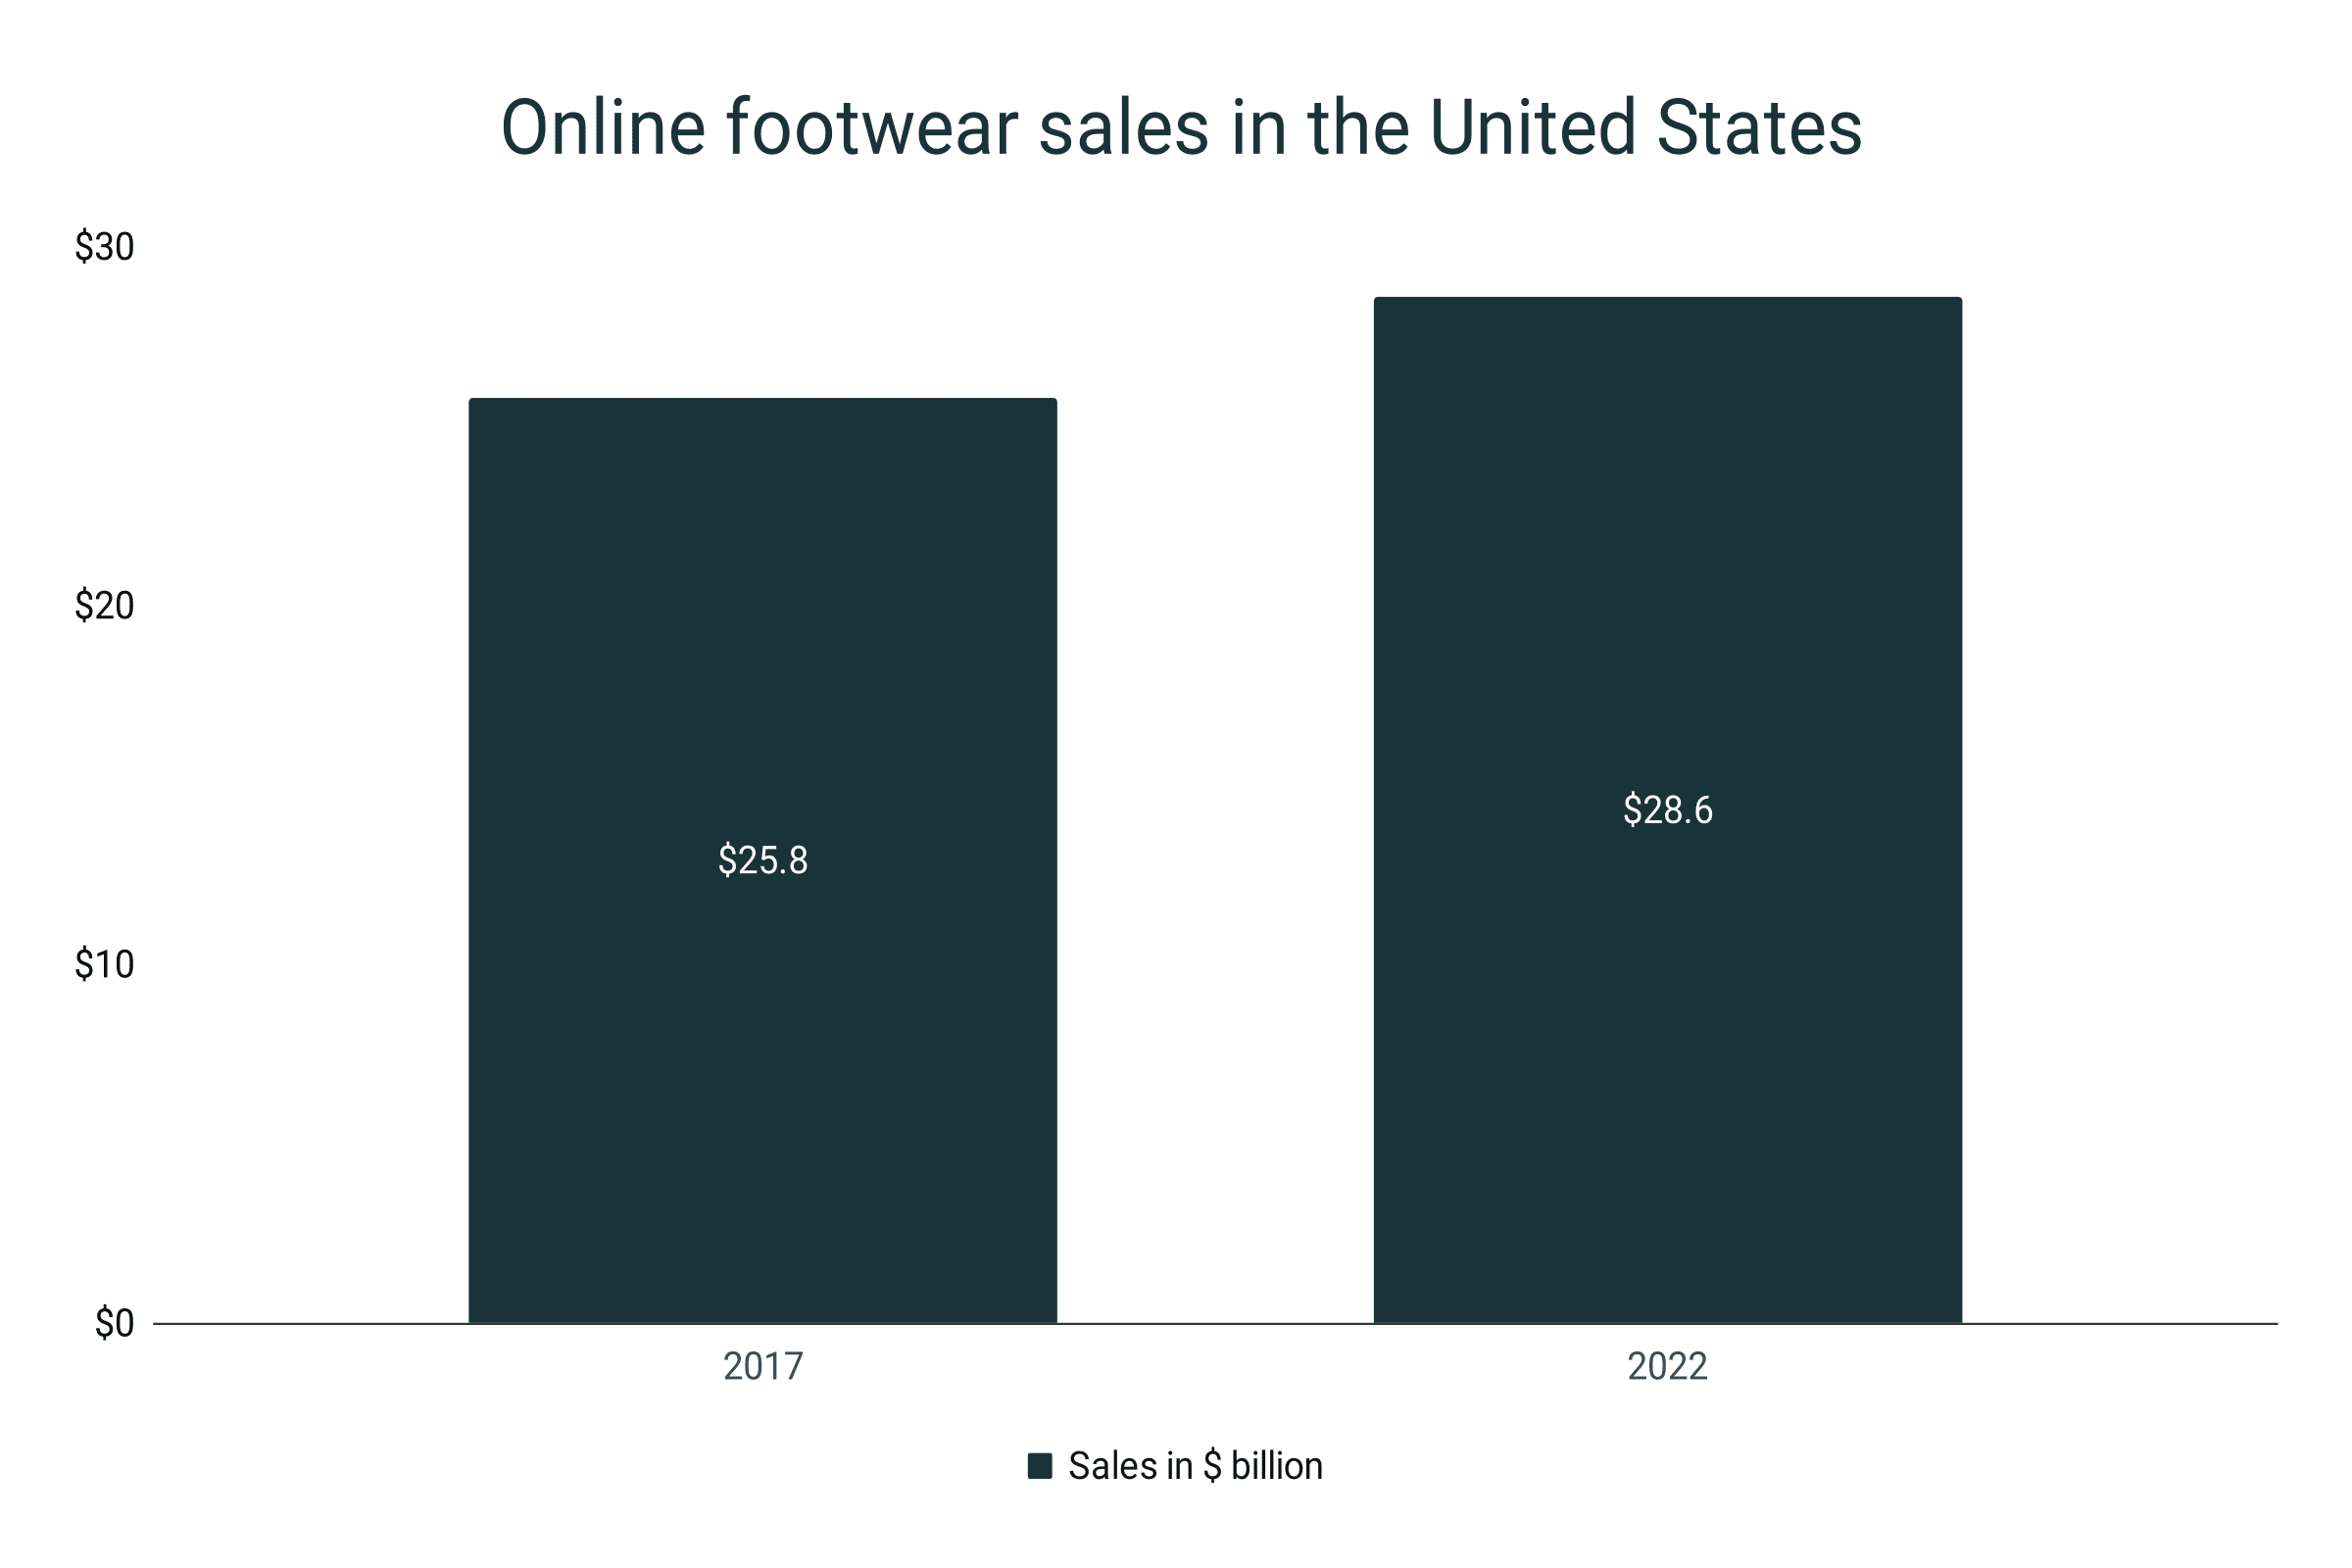
- In the United States, online footwear sales have increased by 10.7% from 2017-2022.
- As of 2022, the American population spent $28.6 billion on footwear done through online transactions.
- Back in 2017, the online spending was $25.8 billion.
Online footwear sales in the United States
|
Year |
Sales in $ billion |
Growth |
|
2017 |
$25.8 |
|
|
2022 |
$28.6 |
10.7% |
Shoe consumption by gender
- As of 2020, the average spending of the American shoe consumer population on women’s shoes is $155.
- Meanwhile, A typical US family, which is composed of 3 people, spends $107 on men’s shoes.
- On average, 25% of the shoes bought by women are only worn once.
- 6 out of 10 women say that they regret at least 1 of their shoe purchases.
- Men buy new shoes every 2 months.
- 74% or 7 out of every 10 women confess that they to try the shoes on before buying them.
- Meaning, the remaining 3 women just buy shoes without even trying them on.
- 81% of women say heels are the most uncomfortable shoes.
- 24% of men say flip-flops and sandals are the most uncomfortable shoes.
Shoe consumption by frequency
- Currently, 35.3% of the global population buys shoes more than 3 times every year.
- 26.7% buy 2 shoes annually. Meanwhile, 22.5% buy only one pair of shoes annually.
- About 15.5% of the world population does not buy at least 1 pair of shoes every year.
- 73% of the adult population buy shoes every 6 months.
- On the other hand, 48% of the adults admitted to buying their children new shoes once or twice a month.
Frequency of buying shoes in a year
|
Frequency |
Percentage |
|
0 |
15.5% |
|
1 |
22.5% |
|
2 |
26.7% |
|
3+ |
35.3% |
Shoe consumption by runners
- Overall, runners invest $354.1 on footwear each year.
- Runners who have 8+ years of experience tend to spend more every year on shoes. On average, they allocate $389 on shoes alone.
- Meanwhile, $343.7 and $285.6 are the average yearly spending of runners with 4-8 and 3 or less years of experience.
- Runners with 4 to 8 years of experience are the top spenders among men. They spend around $353.6 on their shoes.
- Meanwhile, women with 8+ years of running experience have a yearly budget of $477 for their footwear.
Runners’ average annual spending on shoes
|
Years of experience |
Average |
Men |
Women |
|
3 or less |
$285.6 |
$318.6 |
$249.3 |
|
4 to 8 |
$343.7 |
$353.6 |
$346.4 |
|
8 or more |
$389.0 |
$353.4 |
$477.0 |
|
Overall |
$354.1 |
$345.7 |
$373.3 |
- Every year, men who have been running for 4-8 years buy 4.1 pairs of shoes on average.
- On the other hand, male runners buy about 3.5 pairs of shoes each year.
- For women runners, the average is 3.1 pairs annually.
- Women runners with 8+ years of experience consume 3.5 pairs of shoes every year.
Average pairs of shoes bought annually by runners
|
Years of experience |
Men |
Women |
|
3 or less |
3.2 |
2.3 |
|
4 to 8 |
4.1 |
3.1 |
|
8 or more |
3.3 |
3.5 |
|
Overall |
3.5 |
3.1 |
Shoe consumption by basketball players
- Basketball players consume a total of about 200 pairs of shoes in a regular 82-game season.
- NBA players reportedly use one pair of basketball shoes every 4 games.
- Equivalently, one player consumes one pair of shoes every week.
- For a 66-game season, basketball players change shoes in 2-3 days.
Sources
https://www.shaneco.com/theloupe/articles-and-news/fashion/which-state-owns-the-most-shoes/
https://www.statista.com/topics/4704/us-footwear-market/#topicOverview
https://www.investopedia.com/articles/investing/030716/economics-behind-sneakers-nke-addyy.asp https://www.statista.com/statistics/1077289/country-ranking-by-per-capita-shoe-consumption/
https://www.worldfootwear.com/yearbook.html
https://www.themostlysimplelife.com/simple-home/how-many-pairs-of-shoes-does-average-woman-own/
https://www.reuters.com/article/us-shoes-idUSN0632859720070910
https://www.statista.com/statistics/232244/overview-of-the-us-footwear-industry/
https://www.worldfootwear.com/news/americans-buy-75-pairs-of-shoes-per-year/708.html
https://www.commonobjective.co/article/the-size-of-the-global-footwear-market
https://www.powerreviews.com/research/apparel-footwear-shopping-survey-2022/
https://footwearnews.com/shoes/sneaker-news/how-many-shoes-does-average-american-own-1203246486/
https://www.cnbc.com/2021/04/22/department-stores-are-still-americans-top-place-to-buy-shoes.html
https://www.powerreviews.com/research/apparel-footwear-shopping-survey-2022/
https://www.cnbc.com/2021/04/22/department-stores-are-still-americans-top-place-to-buy-shoes.html
https://www.askandyaboutclothes.com/threads/how-often-does-someone-really-buy-shoes.123080/
https://www.runningshoesguru.com/content/male-runners-spend-937-a-year-female-runners-21-more/
