Running Shoes Statistics
This page showcases the latest numbers on the running shoe industry, including revenues, average prices, average weight, as well as numbers on shoe anatomy and lifespan.
Top running shoe statistics
- The global running shoe market was worth $15.44 billion in 2022.
- In 2021, the value of the running shoe market was $15 billion.
- It is estimated that the running shoe market will grow from 2022 to 2030 at a CAGR of 4%, reaching a value of $19 billion.
- Brooks was #1 running shoe brand in the adult performance running category in the US in 2022. It took 22% of the market share.
- The trail running shoe market was estimated at $7.3 billion in 2022.
- During the 2022-2030 period, it is expected that the trail running shoe market will grow at a CAGR of 7.9%, reaching a value of $13.4 billion.
- Women’s running shoe sales, reaching $1.6 billion, took 49% of the adult running shoe market in May 2022 in the US.
- In 202, the annual market size of the running specialty market was worth $1.3 billion. Half of the sales at running specialty are represented by Hoka and Brooks.
- Men’s running shoes weigh 9.8 oz on average, while women’s running shoes weigh 8.4 oz on average. Women’s shoes are 15% lighter on average.
- In 2023, the average MSRP of running shoes is $132.9.
- 18.7% of running shoes shoes have an MSRP lower than $100.
- The most expensive running shoes are carbon-plated road shoes, which retail at $205 on average, and carbon-plated trail shoes, which retail at $208.3 on average.
- Road daily running shoes, with an average MSRP of $124.3, are the cheapest running shoes.
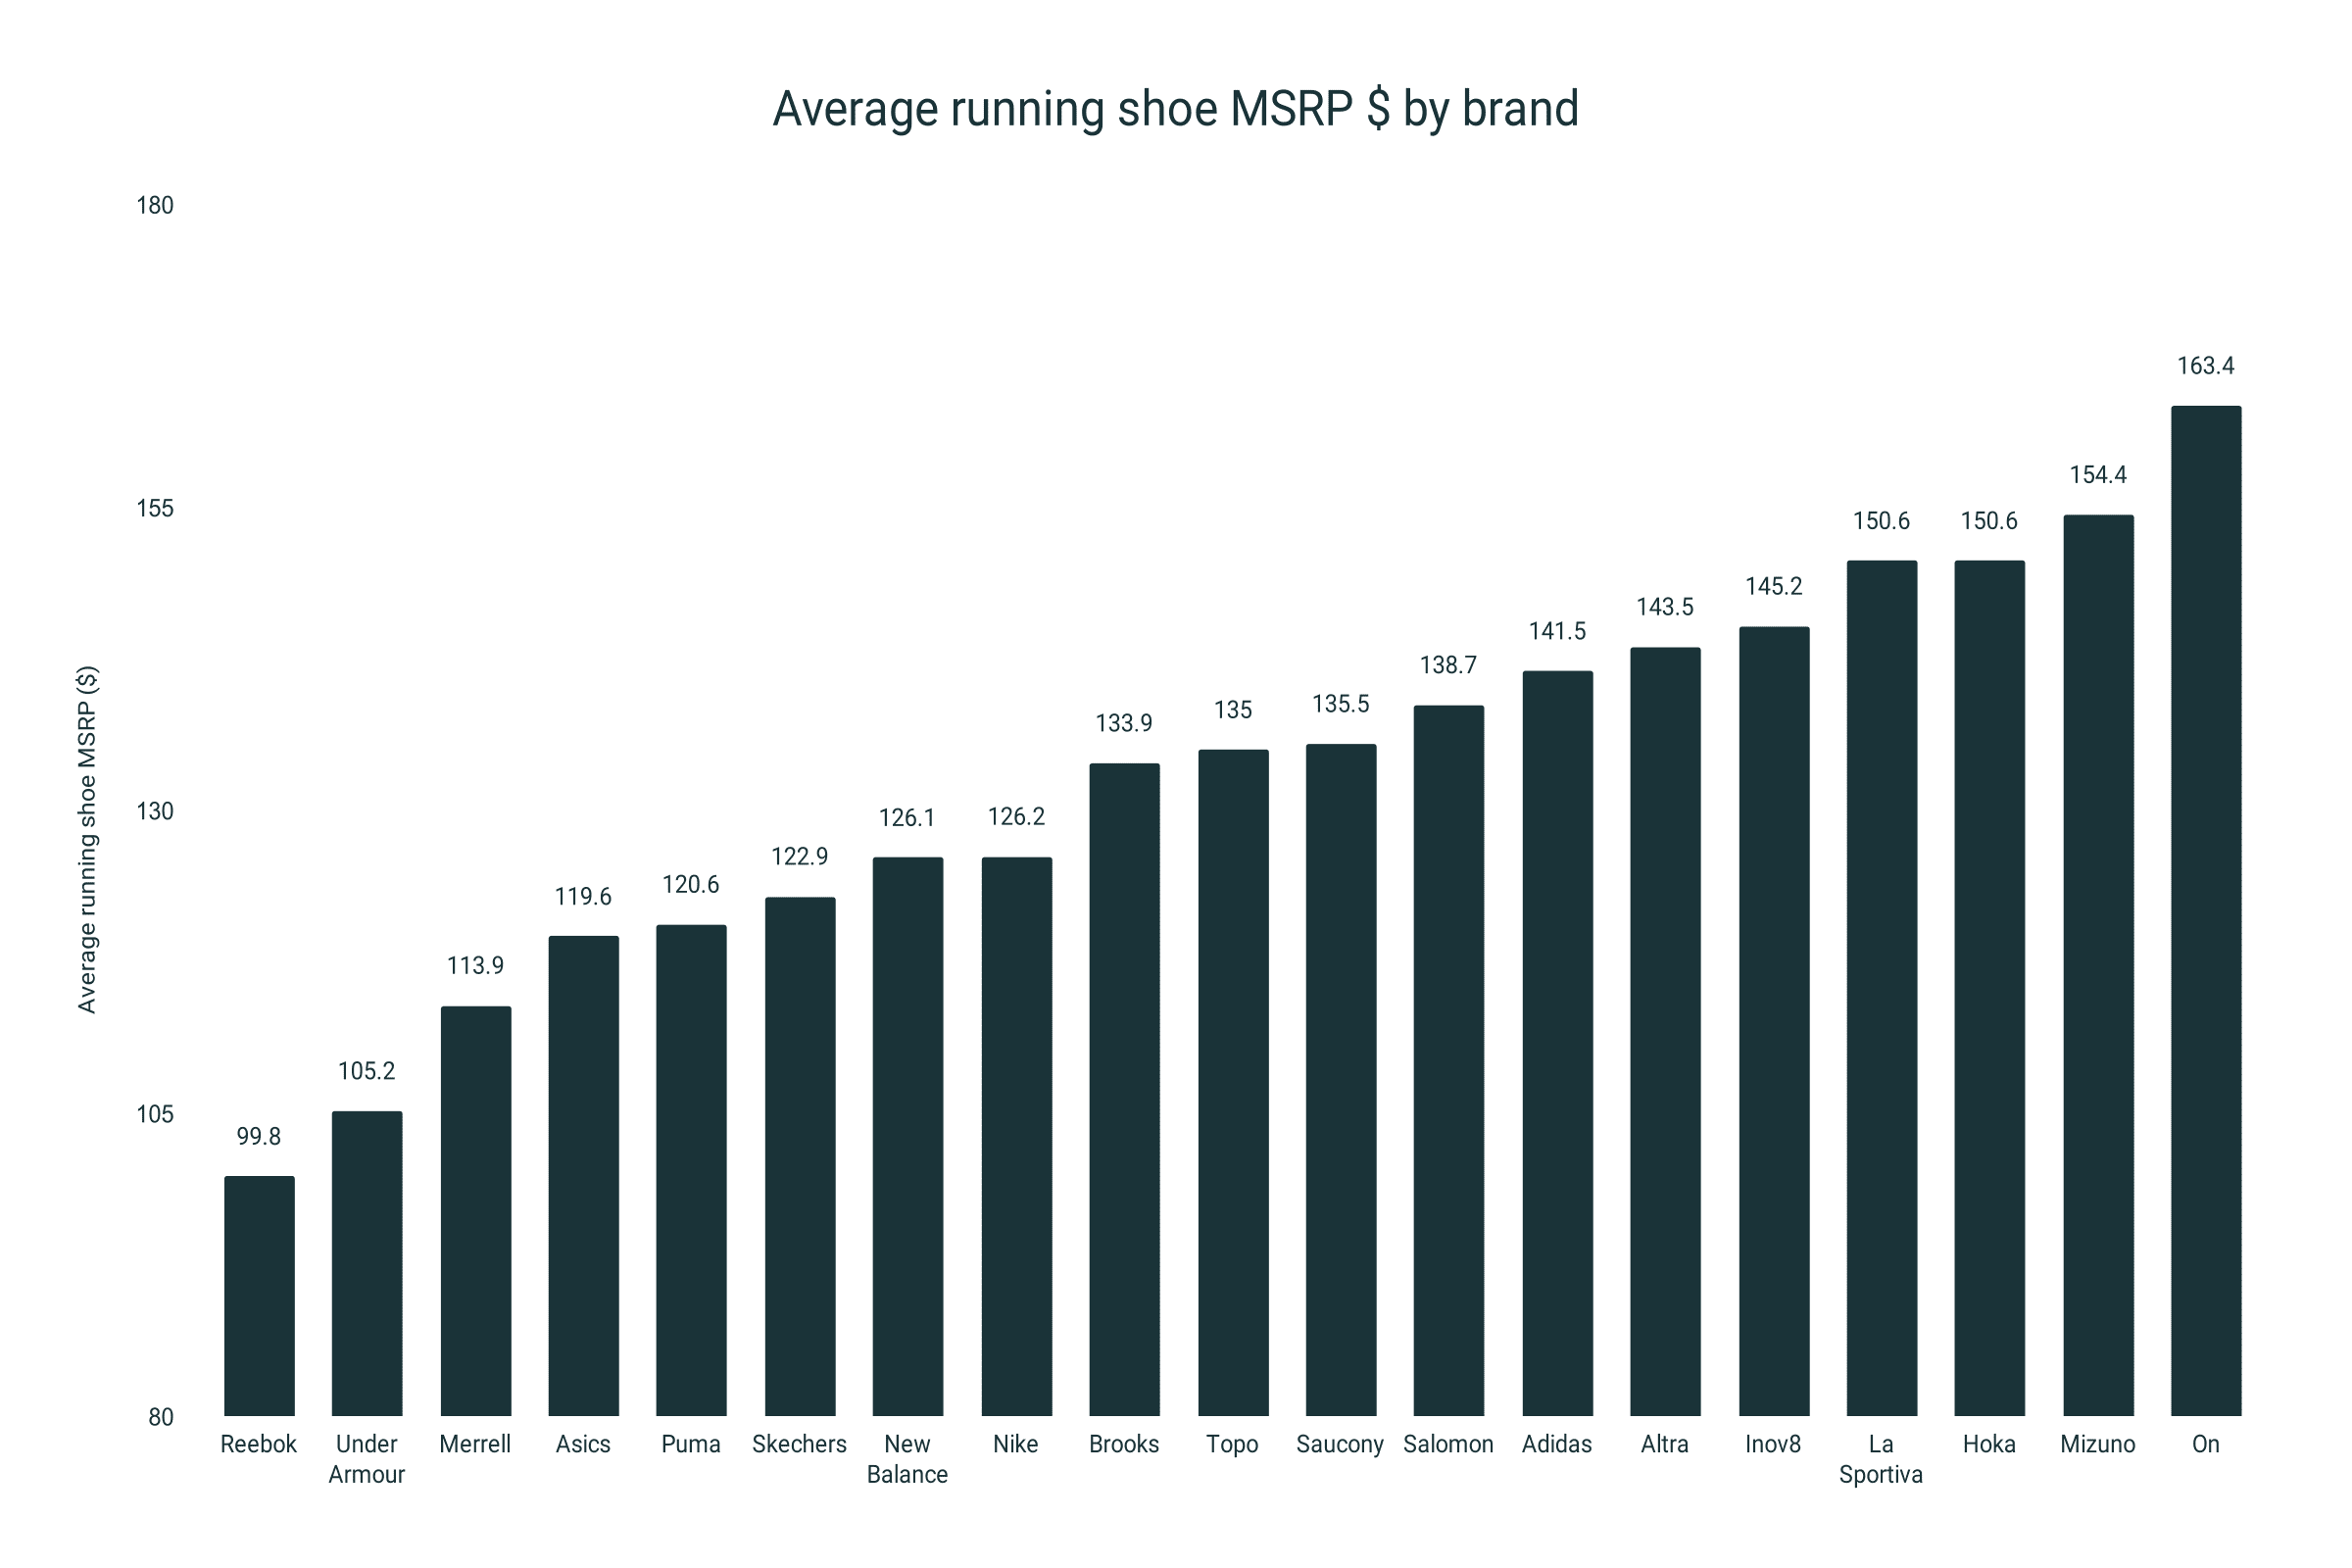
- The brand that makes the cheapest running shoes is Reebok, with an average MSRP of $99.8. This makes Reebok shoes 33% cheaper than the average.
- Reebok is the only brand that makes running shoes that retail at an average price lower than $100.
- The most expensive running shoes retail at $163.4 on average and are made by On. They are 19% more expensive than the average.
Running shoe market revenue
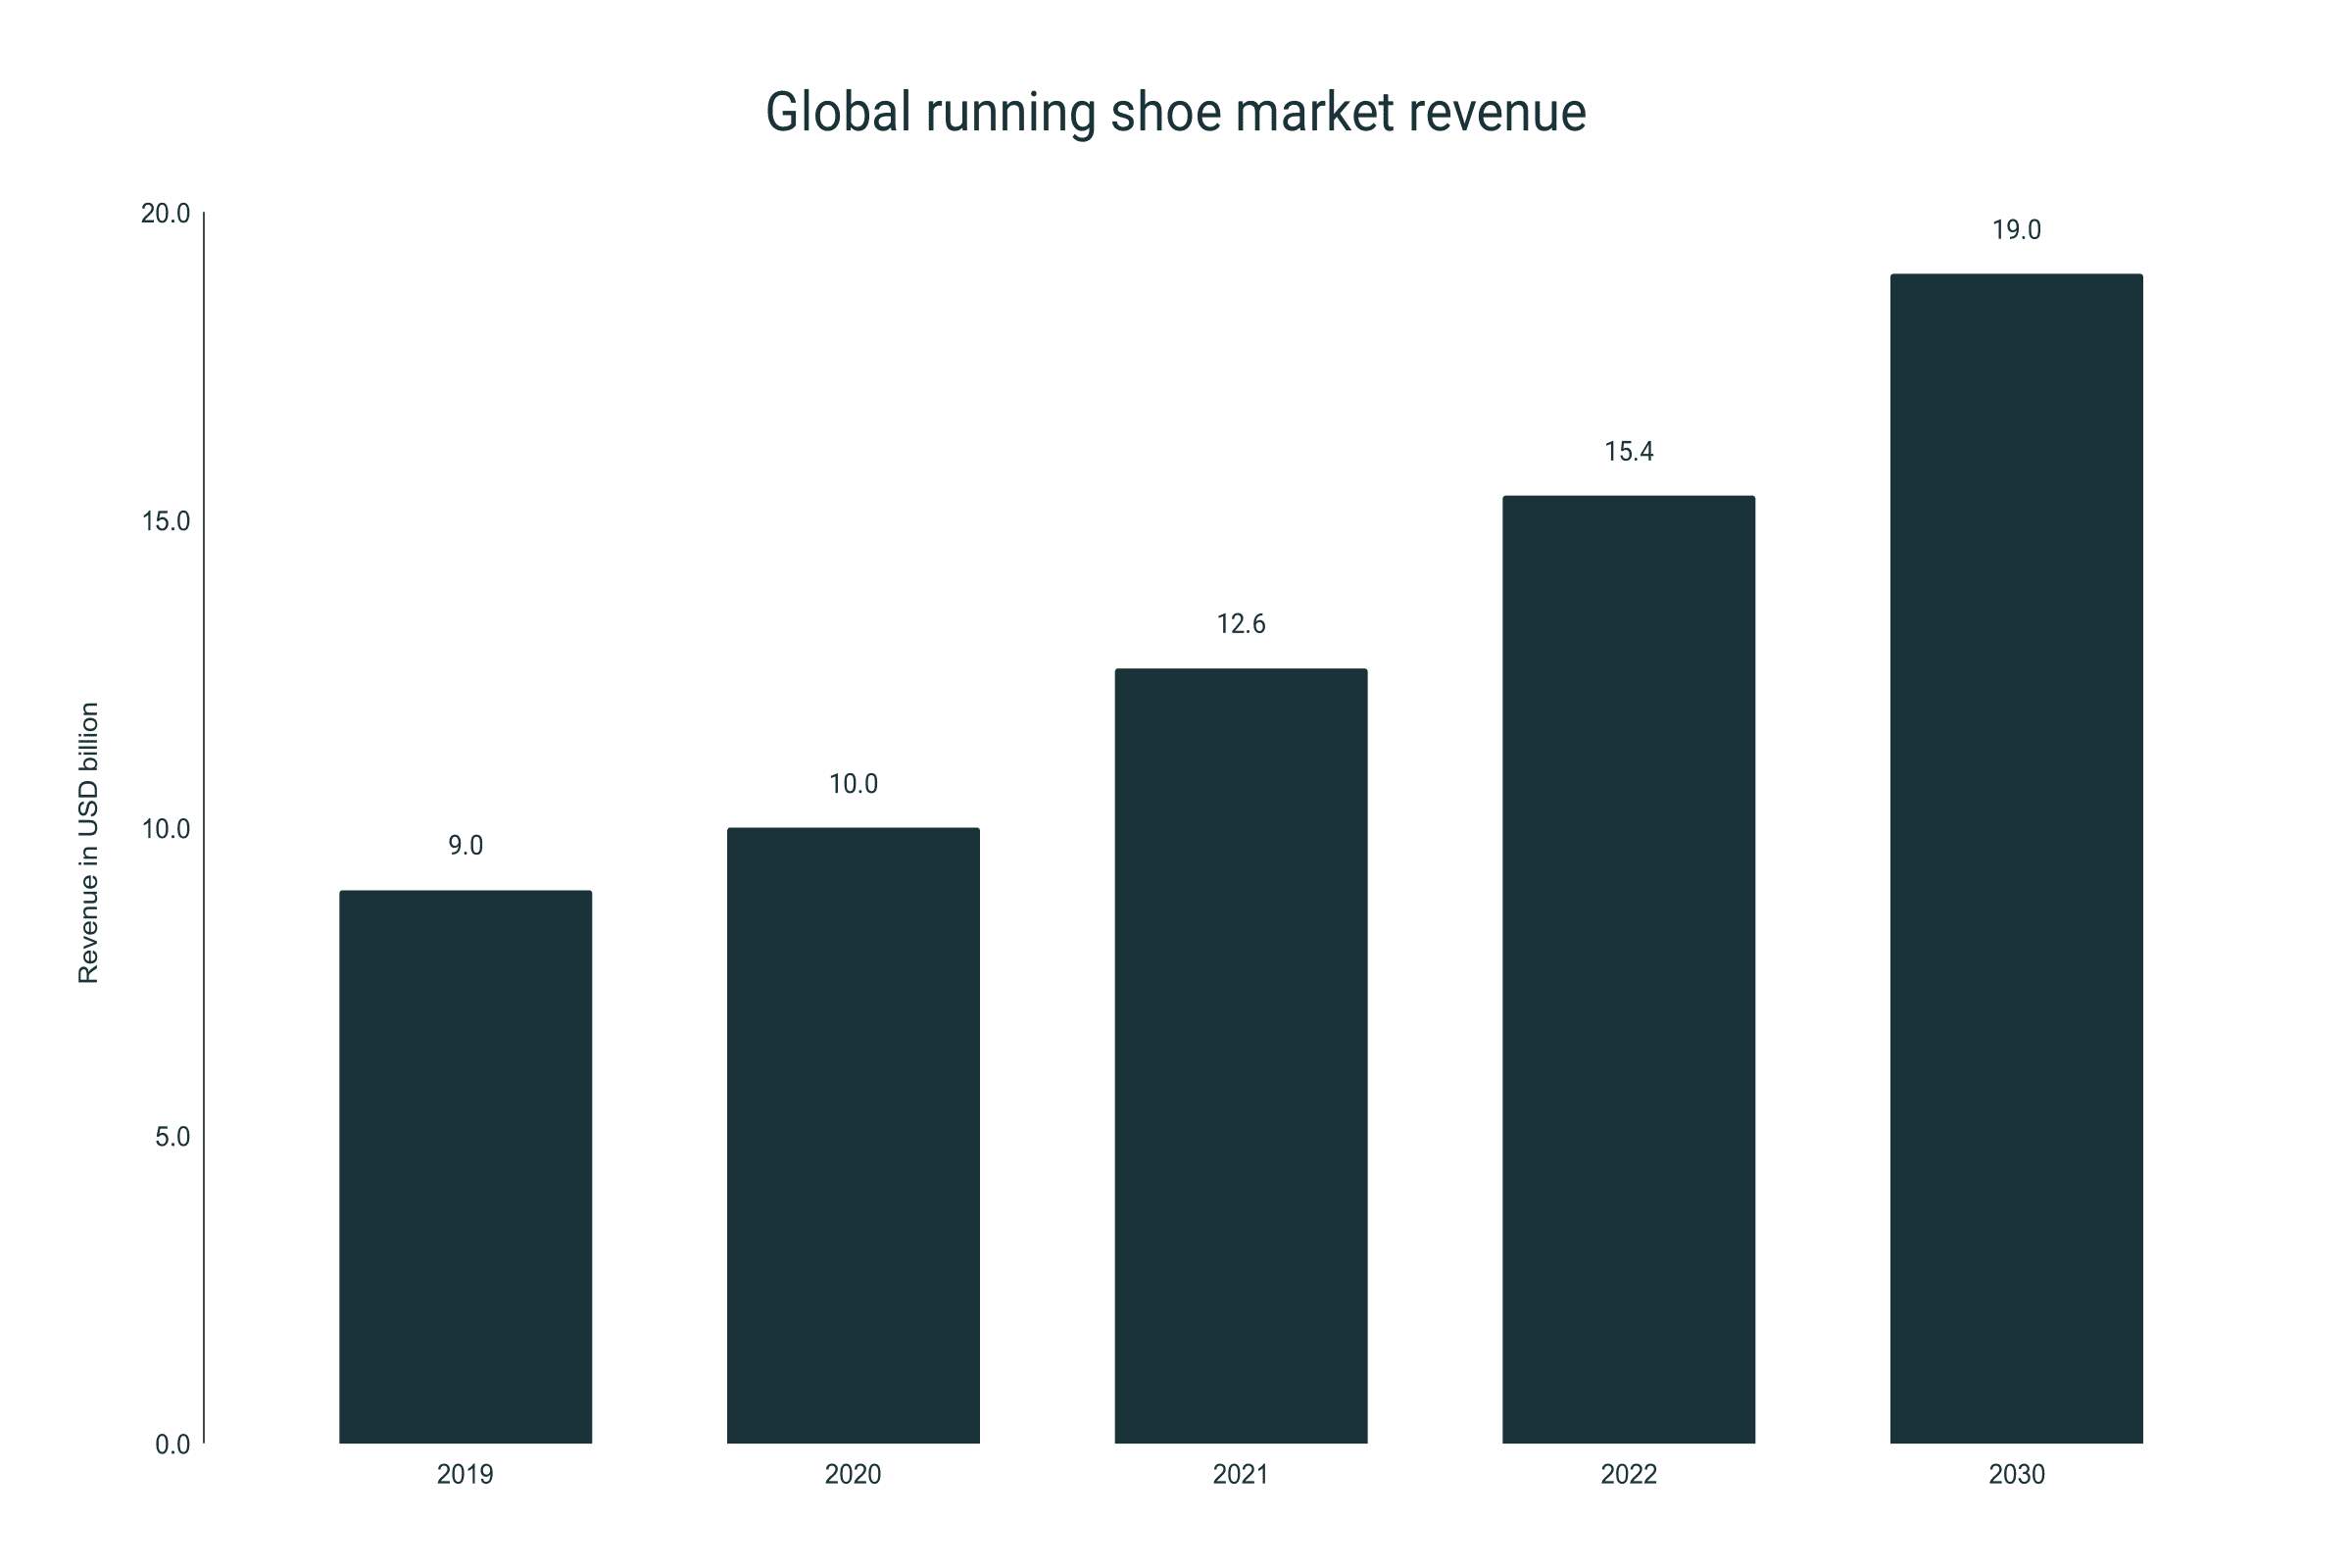
- The global running shoe market value in 2022 was $15.44 billion.
- In 2021, the running shoe market reached $15 billion.
- Compared to 2020, the running shoe market revenue grew 19% in 2021.
- From 2019 to 2020, this market has seen a growth of 26% and went from $9.0 billion to the $10 billion.
- The global running shoe market is expected to grow at a CAGR of 4% between 2022 and 2030.
- In 2030, the projected value sits around $19B.
- In 2022, Brooks ranked #1 in the adult performance running category in the US with its 22% market share.
- Although it saw a 10% growth for the running footwear business in 2022, Nike is no longer #1 in running shoes and it lost that place to smaller brands Hoka, Brooks, On.
- In the first half of 2022, more than 40 percent of all running shoes were sold on sale, down from 56 percent in 2020. In 2022, sales remained above pre-pandemic levels in 2019.
- Asia Pacific, with a revenue share of about 35%, dominated the running shoe market in 2021.
- In 2022, it’s been predicted that performance running shoes will return as streetwear. This wasn’t the case since 2013. The prediction is that Puma and On will be the leaders of that shift. The growth of the running category, along with walking and hiking, is predicted to outperform the rest of the footwear market.
- In 2023, the fastest-growing category in Q2 was performance footwear: sales were up 5% year-over-year to $1.9 billion. Running footwear was responsible for 40% of that growth.
|
Year |
Revenue in USD billion |
Percent change |
|
2019 |
9.0 |
|
|
2020 |
10.0 |
+26% |
|
2021 |
12.6 |
+19% |
|
2022 |
15.4 |
+22% |
|
2030 |
Projected: 19.0 |
+23% |
Trail running shoe market revenue
- The global trail running shoe market was estimated at $7.3 billion in 2022.
- By 2030, it is projected to reach $13.4 billion, growing at a CAGR of 7.9% over the 2022-2030 period.
- The light running shoe market (shoes for fire roads, gravel paths, and rolling hills) is projected to grow at a 7.6% CAGR and reach $5.9 billion in 2030.
- The rugged trail running shoe market (shoes for running on hiking trails) is projected to grow at an 8.5% CAGR until 2030.
- The off-trail running shoe market (shoes for running on difficult terrain) is projected to grow at a CAGR of at least 6% until 2029.
- During the 2022-2030 period, China’s running shoe market is expected to grow at a CAGR of 12.0%.
- Japan, Canada and Germany are projected to increase their running shoe markets at a CAGR of 4.1%, 6.3% and 5.4%, respectively.
Trail running shoe market value: projected growth 2022-2030
|
Year |
Projected market growth in $ Billion |
|
2022 |
7.3 |
|
2023 |
7.9 |
|
2024 |
8.5 |
|
2025 |
9.2 |
|
2026 |
9.9 |
|
2027 |
10.7 |
|
2028 |
11.5 |
|
2029 |
12.4 |
|
2030 |
13.4 |
Women’s running shoe market growth
- Women’s running shoe sales accounted for 49% of the adult running shoe market, reaching $1.6 billion in the US as of May 2022.
- Comparing this 2022 data to the pre-pandemic one, the women’s running shoe market has grown 28% and men’s 17%.
- In the first half of 2021, the distribution of running shoe sales was 46% for men and 41% for women. Running is an athletic category with the smallest difference when looking at the ratio of men’s shoes vs. women’s shoe sales.
Running specialty industry market revenue
- The annual market size of the running specialty market was worth $1.3 billion as of 2022.
- Running specialty market was comprised of almost 1,100 specialty shops in 2022.
- 72% of retailers managed only 1 retail location.
- 4 out of 560 retailers managed 9 or more locations.
- Hoka and Brooks represented half of the sales at running specialty.
Nike running shoe revenue
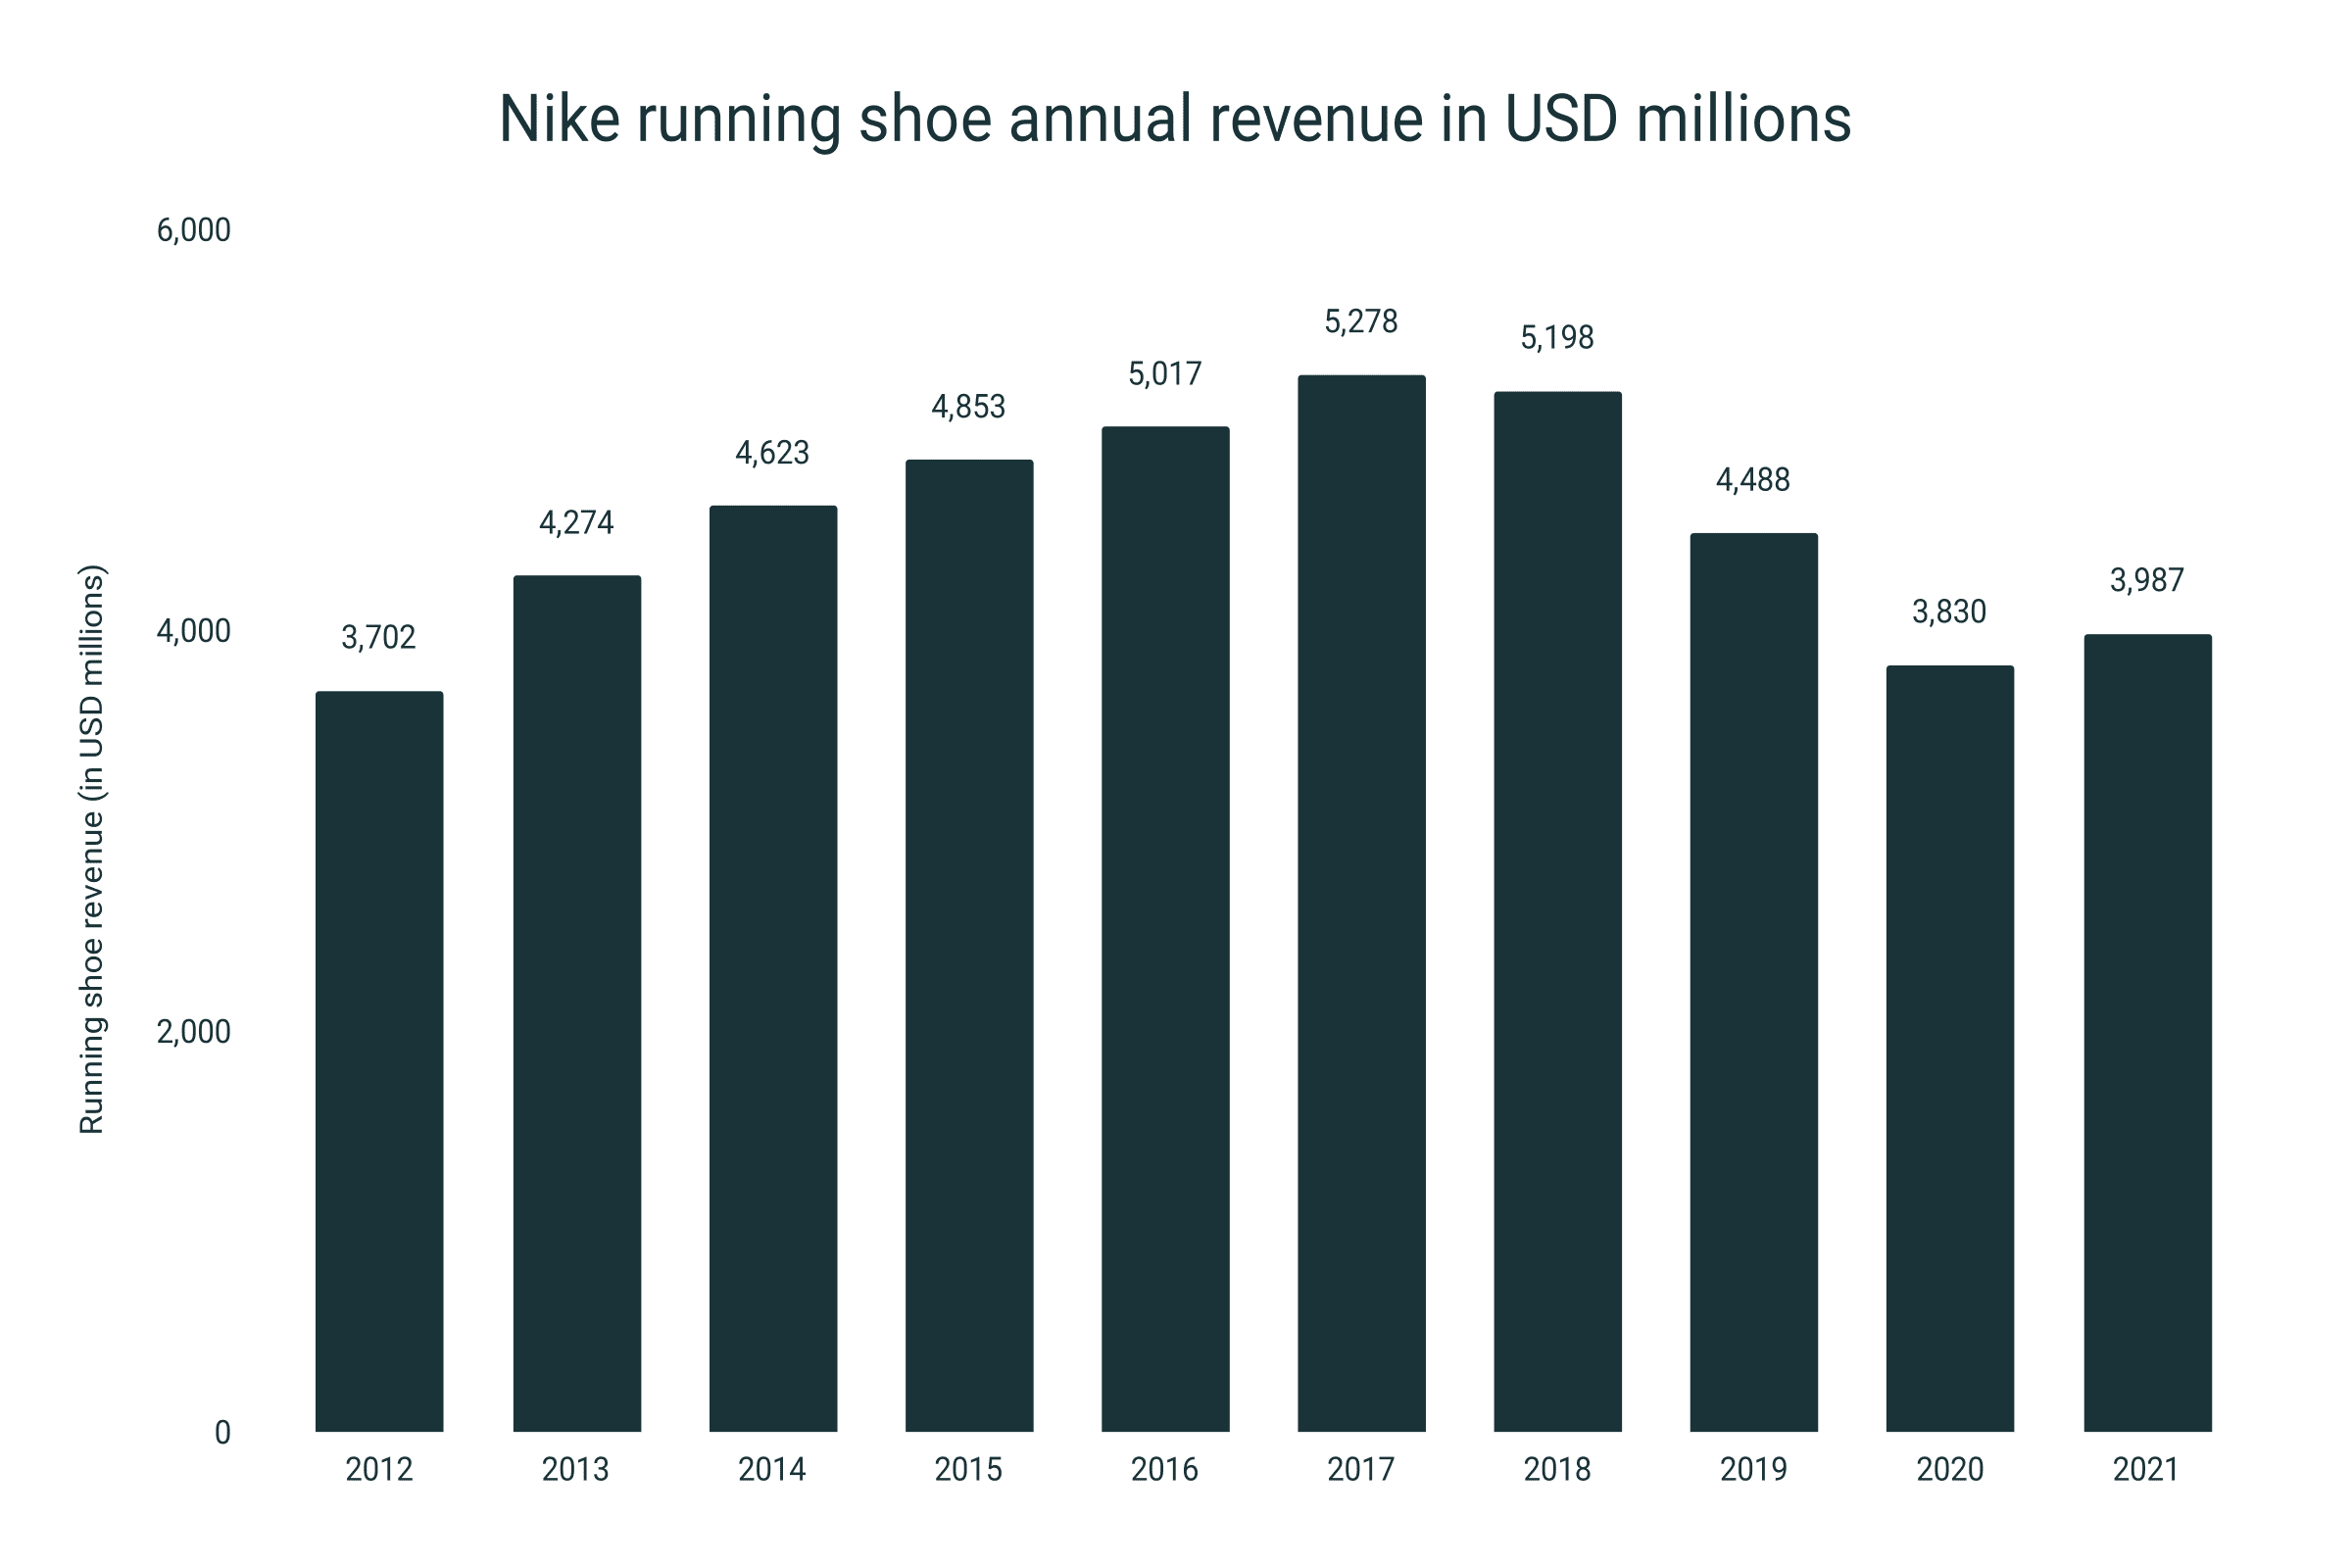
- In 2022, Nike had a running shoe revenue of $3,702 million. In 2021, the revenue sat at $3,987 million.
- From 2012 to 2021, the revenue of Nike running shoes grew 7.7%.
- The highest revenue from running shoes Nike reported in 2017 with $5,278 million.
Nike annual revenue (in USD millions) for footwear and running shoes
|
Year |
Footwear |
Running shoes |
|
2021 |
28,021 |
3,987 |
|
2020 |
23,305 |
3,830 |
|
2019 |
24,222 |
4,488 |
|
2018 |
22,268 |
5,198 |
|
2017 |
21,081 |
5,278 |
|
2016 |
19,871 |
5,017 |
|
2015 |
18,318 |
4,853 |
|
2014 |
16,208 |
4,623 |
|
2013 |
14,539 |
4,274 |
|
2012 |
13,426 |
3,702 |
Brooks running shoe revenue
- 2022 was a record-breaking year for Brooks, with an annual revenue of $1.2 billion. This is a 6% increase compared to the 2021.
- Brooks Running’s revenue in 2021 was $1.11 billion.
- Brooks estimated that they added 1.6 million runners by the end of 2020.
- In 2022, Brooks had a 22% market share in US retail adult performance running footwear. This put them at #1 place.
- Brooks was named the top running brand in Canada by independent running retailers in 4 of 5 categories when surveyed by the IRRC (Independent Running Retailers of Canada).
- In Q1 2022, the Brooks Ghost and Brooks Adrenaline running shoes were the 2 top-selling franchise lines in the adult performance running market.
- Brooks Ghost and Brooks Adrenaline lines have accounted for 14% of U.S. sales in Q1 2022.
Running shoe weight statistics
- The average weight of men’s running shoes is 9.8 oz, while the average weight of women’s running shoes is 8.4 oz.
- Women’s running shoes are 15% lighter than men’s running shoes on average.
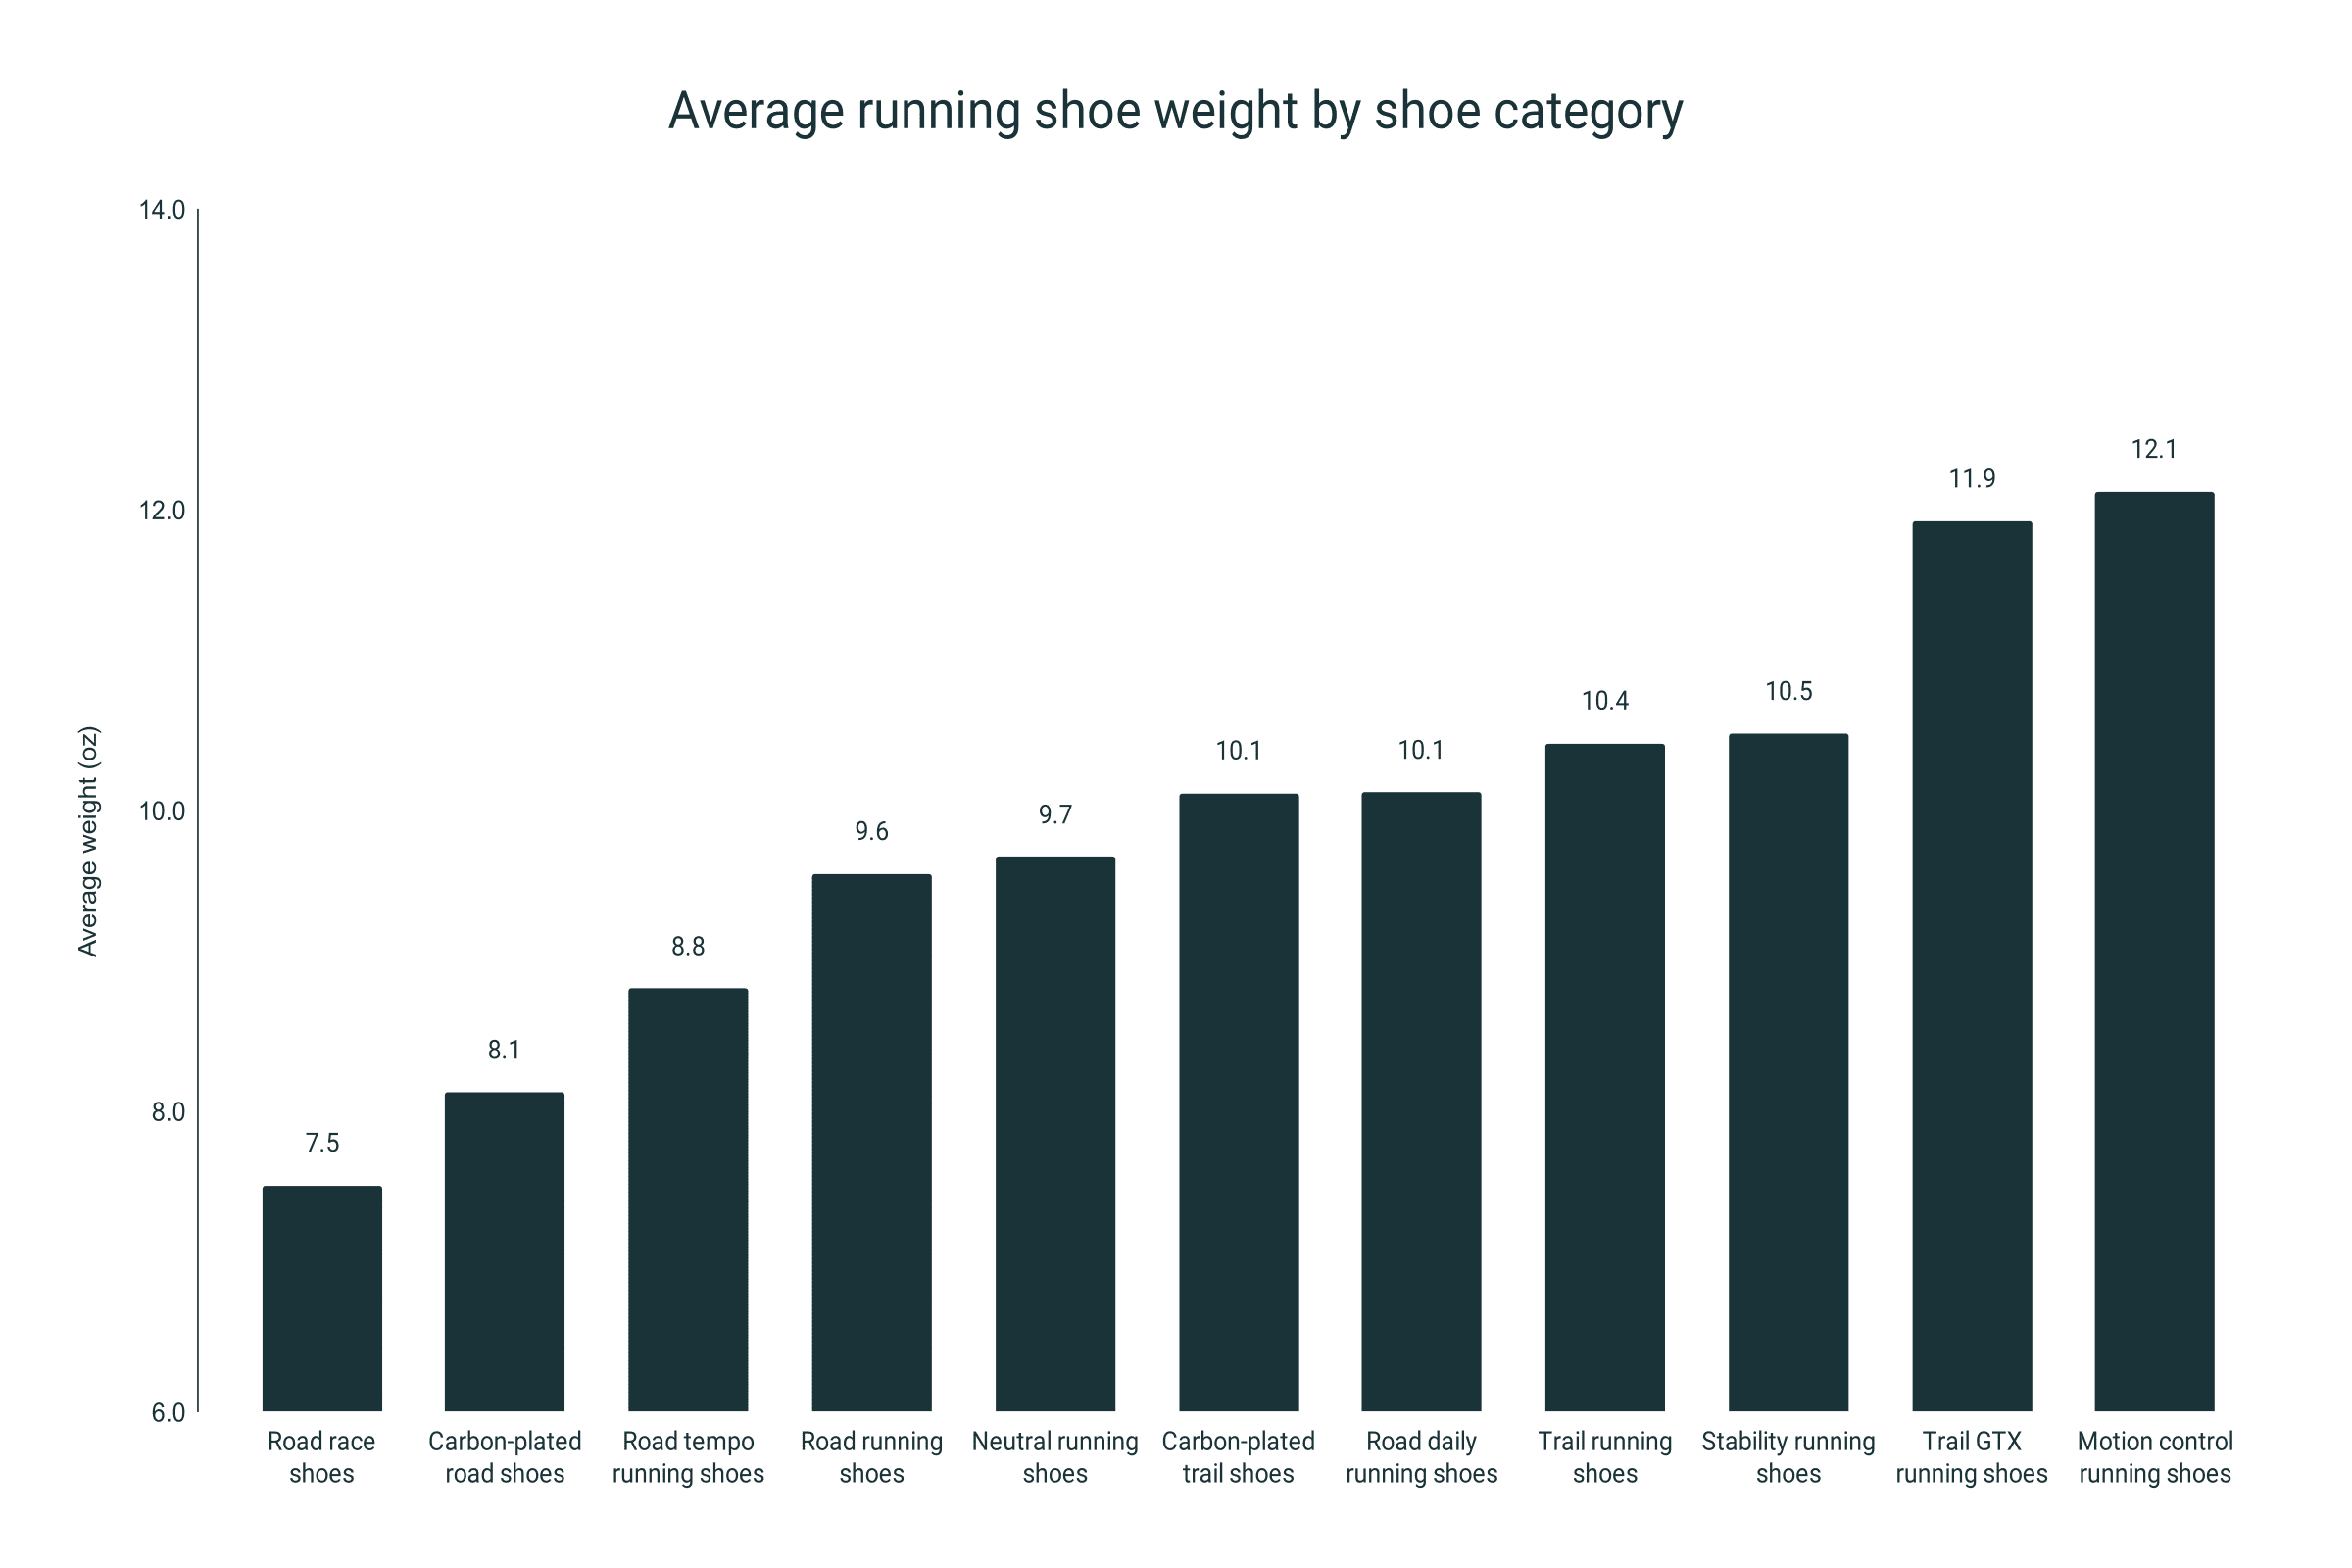
- Road running shoes, on average, weigh 9.7 oz, while trail running shoes weigh 10.4 oz. This makes trail running shoes 7% heavier.
- The heaviest running shoes are motion-control running shoes with a weight of 12.1 oz. They are 19% heavier than the average.
- Road race running shoes, with an average weight of 7.5 oz, are 31% lighter than the average running shoe.
Average running shoe weight (for men’s size 9) for different running shoe categories
|
Running shoe category |
Average weight (g) |
Average weight (oz) |
|
Road race shoes |
212.7 |
7.5 |
|
Carbon-plated road shoes |
230.2 |
8.1 |
|
Road tempo running shoes |
249.7 |
8.8 |
|
Road running shoes |
271.4 |
9.6 |
|
Neutral running shoes |
274.5 |
9.7 |
|
Carbon-plated trail shoes |
286.6 |
10.1 |
|
Road daily running shoes |
286.7 |
10.1 |
|
Trail running shoes |
296 |
10.4 |
|
Stability running shoes |
297.8 |
10.5 |
|
Trail GTX running shoes |
337.8 |
11.9 |
|
Motion control running shoes |
343.4 |
12.1 |
Average running shoe price (MSRP) in 2023
- The average MSRP of running shoes in 2023 is $132.9.
- 18.7% of running shoes shoes have an MSRP lower than $100.
- 7.2% of running shoes have an MSRP of $200 or higher.
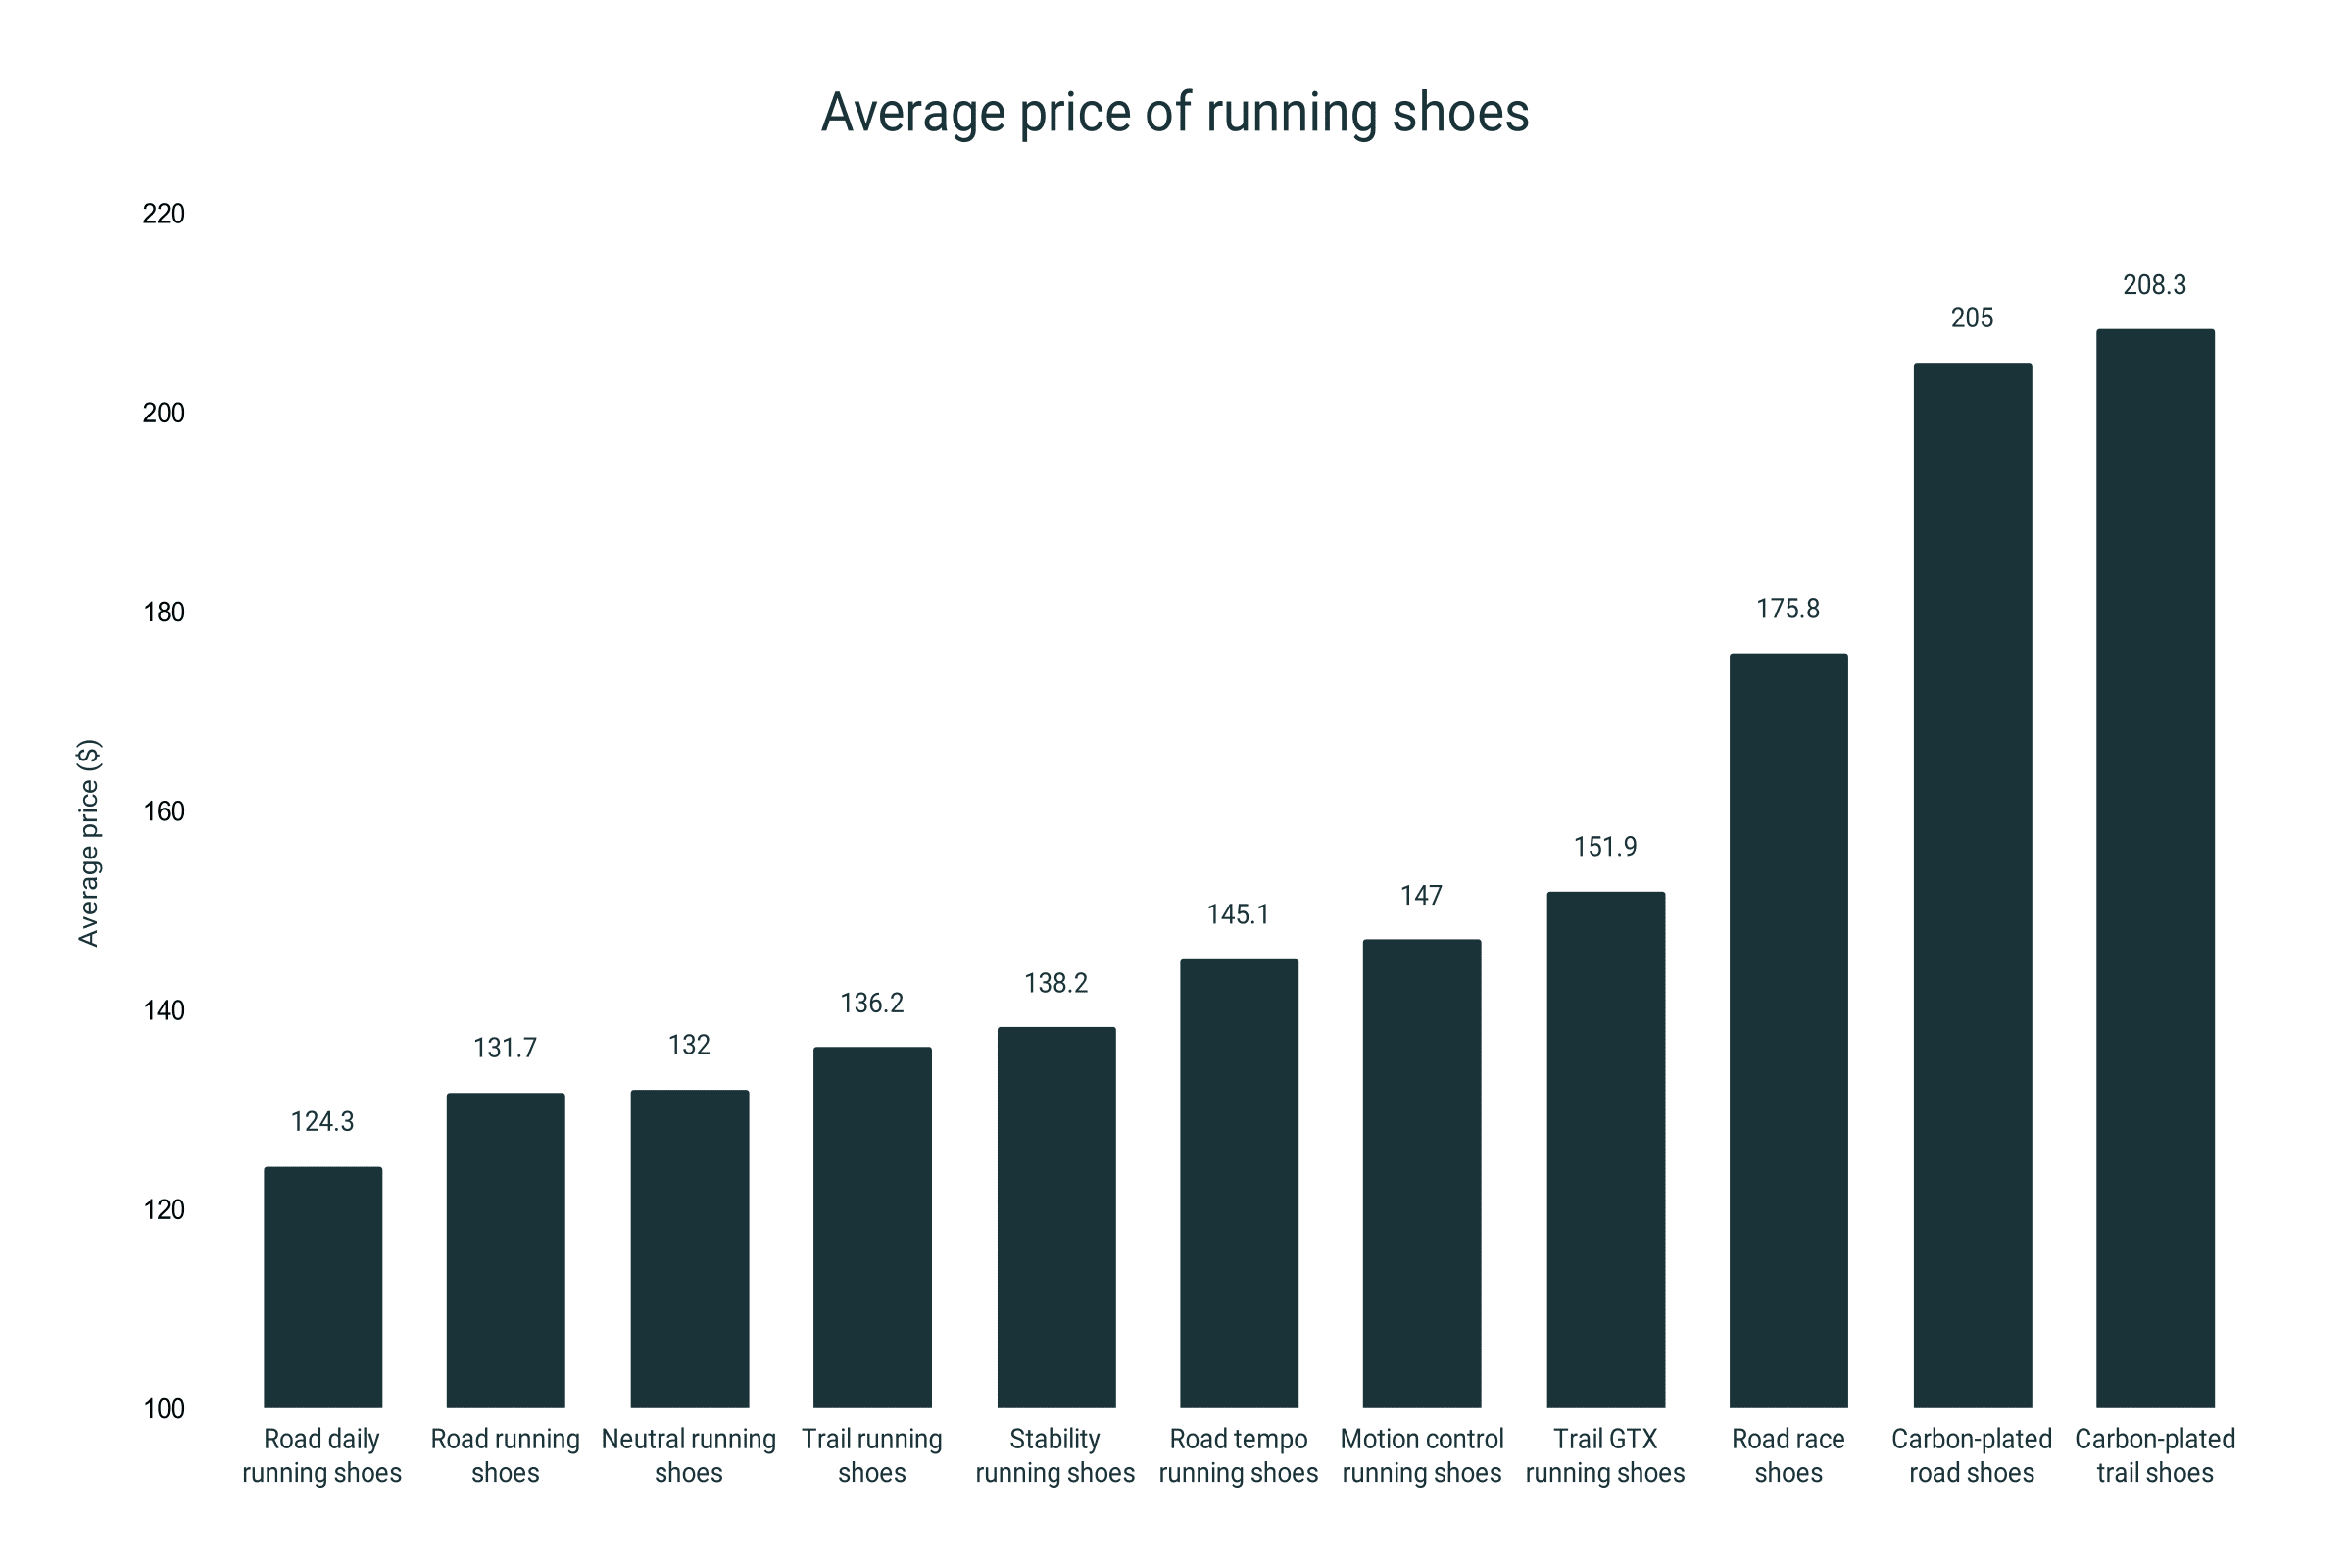
- The average price for a road running shoe is $131.7, while the average price for a trail running shoe is $136.2.
- On average, trail running shoes are 3.3% more expensive than road shoes.
- The most expensive shoes are carbon-plated ones, both in the road ($205) and trail ($208.3) category.
- The cheapest running shoes, on average, are road daily running shoes with an average MSRP of $124.3.
Average price of running shoes for different categories in 2023
|
Running shoe category |
Average price ($) |
|
Road daily running shoes |
124.3 |
|
Road running shoes |
131.7 |
|
Neutral running shoes |
132.0 |
|
Trail running shoes |
136.2 |
|
Stability running shoes |
138.2 |
|
Road tempo running shoes |
145.1 |
|
Motion control running shoes |
147.0 |
|
Trail GTX running shoes |
151.9 |
|
Road race shoes |
175.8 |
|
Carbon-plated road shoes |
205.0 |
|
Carbon-plated trail shoes |
208.3 |
Trail running shoe prices 2010-2023
- Looking at prices from 2010 up until 2023, trail shoes cost $4.5 more than they used to.
- The average price of a pair of trail running shoes bought in the 2010-2023 period is $158.6 after indexing for inflation.
- The average price of trail shoes bought in the 2010-2017 period was $155.7. That average has climbed to $160.2 since 2018.
- Shoes that have Gore-Tex membrane are more expensive: on average, they cost $30 more.
- Even expensive trail shoes got more expensive. In 2011, the most expensive pair of trail running shoes cost $169. In 2022, it cost $375. When adjusted for inflation, the same shoe would cost $405 in 2023.
Average running shoe price by brand in 2023
- The lowest average MSRP by brand comes from Reebok, with $99.8. This makes Reebok running shoes 33% cheaper than the average for all running shoes ($132.9).
- Reebok is the only shoe brand whose running shoes have an average price lower than $100.
- The most expensive running shoes are made by On, with an average MSRP of $163.4. This makes On running shoes 19% more expensive than the average.
|
Brand |
Average running shoe MSRP ($) |
|
Reebok |
99.8 |
|
Under Armour |
105.2 |
|
Merrell |
113.9 |
|
Asics |
119.6 |
|
Puma |
120.6 |
|
Skechers |
122.9 |
|
New Balance |
126.1 |
|
Nike |
126.2 |
|
Brooks |
133.9 |
|
Topo |
135.0 |
|
Saucony |
135.5 |
|
Salomon |
138.7 |
|
Adidas |
141.5 |
|
Altra |
143.5 |
|
Inov8 |
145.2 |
|
La Sportiva |
150.6 |
|
Hoka |
150.6 |
|
Mizuno |
154.4 |
|
On |
163.4 |
Running shoe anatomy statistics as of 2023
- The average heel to toe drop in road running shoes is 8.4 mm, while the average drop found in trail running shoes is 7.0 mm.
- The average heel stack height for road running shoes is 28.7 mm, while the average height of the heel in trail shoes sits at 26.9 mm.
- In road running shoes, the forefoot is 20.8 mm high on average, while trail shoes rest at 20.9 mm at the forefoot on average.
- 5.8% of running shoes have a carbon plate, while 3.2% of shoes have a Gore-Tex membrane.
- 3.8% of running shoes are slip-ons.
Running shoe lifespan statistics
- The typical lifespan of running shoes is 300-1000 km.
- After 750 km, wrinkling and holes can occur in the foam.
- After 480 km, a 16-33% reduction of cushioning in the heel region was reported. However, even after running 640 km in the same shoes, runners were not able to feel the difference.
- Shoes that get rest time recover faster and are able to absorb more energy than unrested shoes when testing restarts. This research suggests 22h rest time for every 20km.
Sources
https://www.mdpi.com/2504-3900/49/1/138
https://sgbonline.com/ria-report-running-specialty-sees-solid-gains-in-2022/
https://s28.q4cdn.com/811960755/files/doc_financials/2022/q4/2022-Annual-Report.pdf
https://www.businessoffashion.com/news/retail/on-returns-to-profit-surpasses-1-billion-in-re
https://www.brooksrunning.com/en_us/04-26-2022/
https://s1.q4cdn.com/806093406/files/doc_financials/2022/NikeInc_2022_Annual_Report.pdf
https://s1.q4cdn.com/806093406/files/doc_financials/2021/ar/386273(1)_20_Nike-Inc_Combo_WR.pdf
https://s1.q4cdn.com/806093406/files/doc_financials/2020/ar/363224(1)_16_Nike-Inc_Combo_WR_R2.pdf
https://s1.q4cdn.com/806093406/files/doc_financials/2019/ar/354352(1)_76_Nike-Inc_COMBO_WR_R1.pdf
https://s1.q4cdn.com/806093406/files/doc_financials/2018/ar/docs/nike-2018-form-10K.pdf
https://s1.q4cdn.com/806093406/files/doc_financials/2017/ar/docs/nike-2017-form-10K.pdf
https://s1.q4cdn.com/806093406/files/doc_financials/2016/ar/docs/nike-2016-form-10K.pdf
https://s1.q4cdn.com/806093406/files/doc_financials/2015/ar/docs/nike-2015-form-10K.pdf
https://s1.q4cdn.com/806093406/files/doc_financials/2013/docs/nike-2013-form-10K.pdf
https://s1.q4cdn.com/806093406/files/doc_financials/2012/docs/nike-2012-form-10K.pdf
https://www.npd.com/news/blog/2022/sneakernomics-trends-in-sports-retail-for-2022/
https://footwearnews.com/business/business-news/nike-running-comeback-analysts-details-1203487254/
https://www.npd.com/news/blog/2022/sneakernomics-trends-in-sports-retail-for-2022/
https://www.tandfonline.com/doi/full/10.1080/02640414.2014.886127
https://pubmed.ncbi.nlm.nih.gov/32151033/https://pubmed.ncbi.nlm.nih.gov/32151033/
https://pubmed.ncbi.nlm.nih.gov/15275845/
https://pubmed.ncbi.nlm.nih.gov/28900568/
https://www.factmr.com/report/4521/trail-running-shoes-market
https://www.researchandmarkets.com/report/trail-running-shoes
https://footwearnews.com/business/retail/rei-co-op-grows-running-shoe-business-1203274136/
https://www.retaildive.com/news/running-brands-making-womens-shoes/627733/
https://www.runningshoesguru.com/content/how-long-do-running-shoes-last-and-is-it-time-for-a-new-pair/#:~:text=More%20studies%20(yes%20we're,(200%2D600%20miles)
https://www.retaildive.com/news/brooks-running-posts-20-revenue-increase-in-q1/649547/
