Jordan Shoes Statistics
The Jordan brand is one of the biggest subsidiaries of Nike. It was even recognized in the 2022 FN Achievement Awards as Brand of the Year. Dive into this page to know more about the depths, the heights, the statistics, and the journey of the Jordan shoe brand to where it is now—and where it’s headed in the future.
Top Jordan shoe statistics
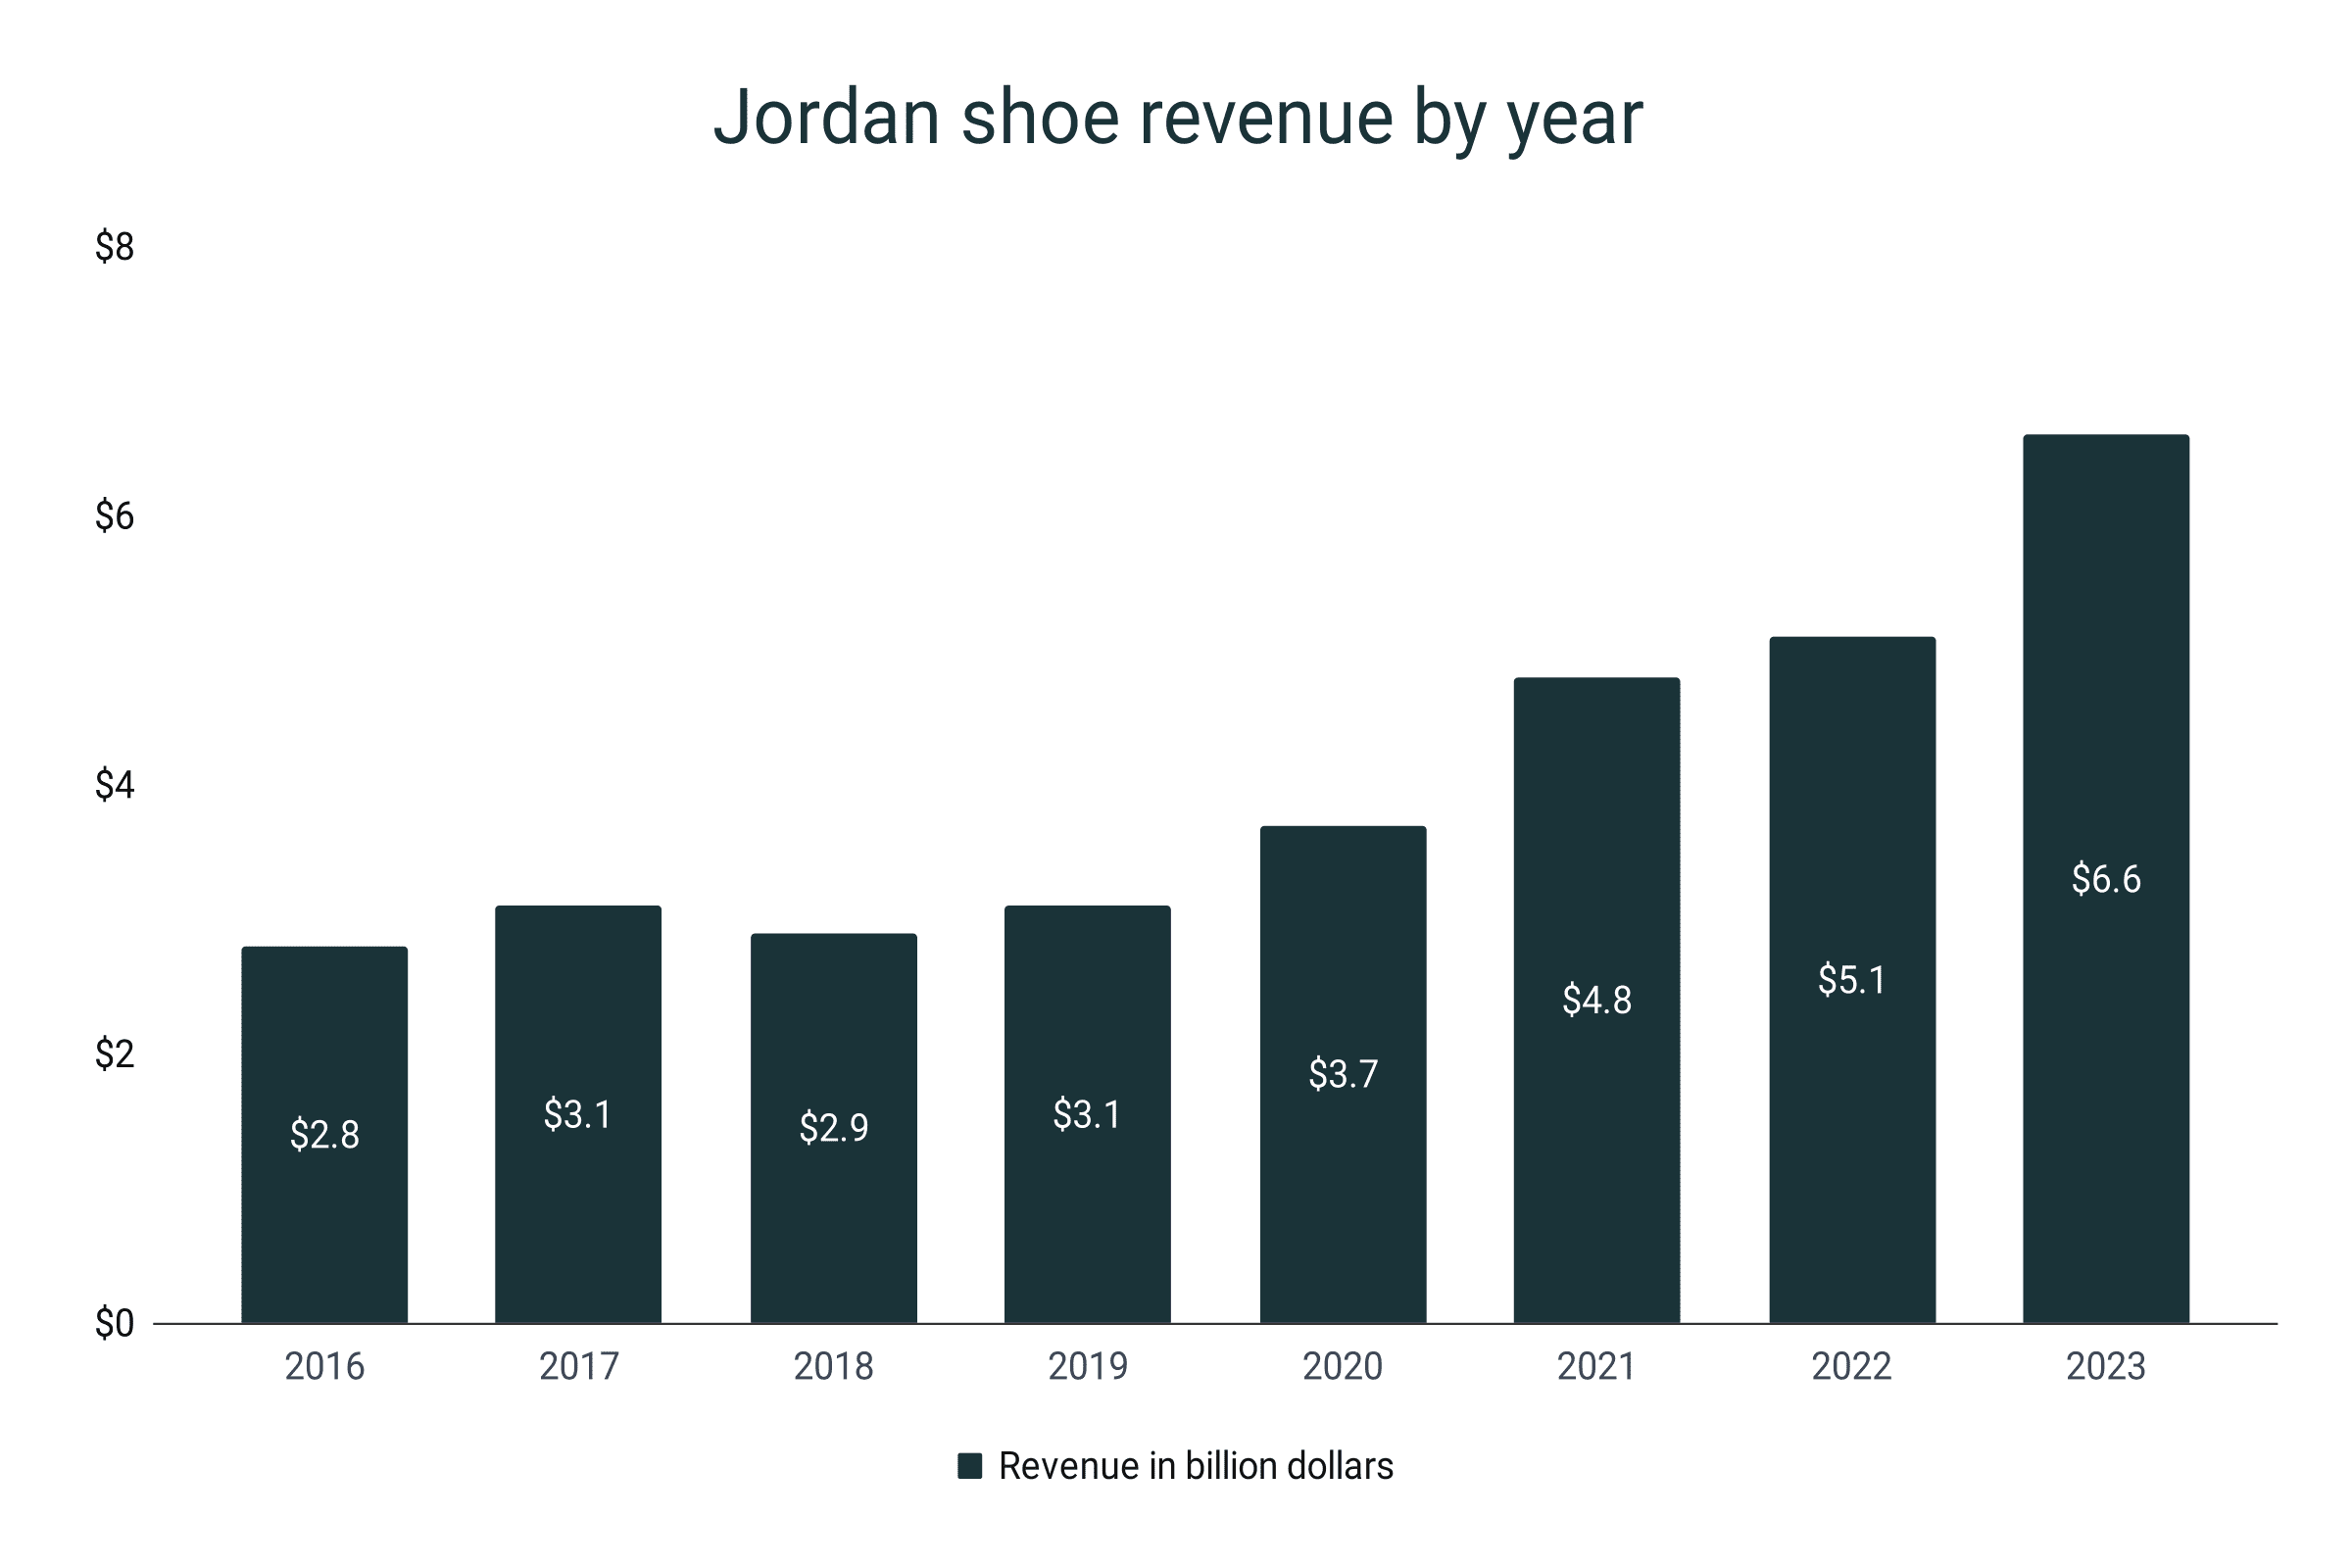
- Jordan ended its 2023 fiscal year last May with a $6.6 billion total revenue.
- During the pandemic, Jordan enjoyed a 19.4% sales increase in 2019-2020 and a record-high 29.7% growth in 2020-2021.
- In 2023, Jordan accounted for 16.4% of Nike’s total revenue. ‘
- Between 2016-2023, the Jordan shoe revenue takes up an average of 12.2% of the global revenue of Nike.
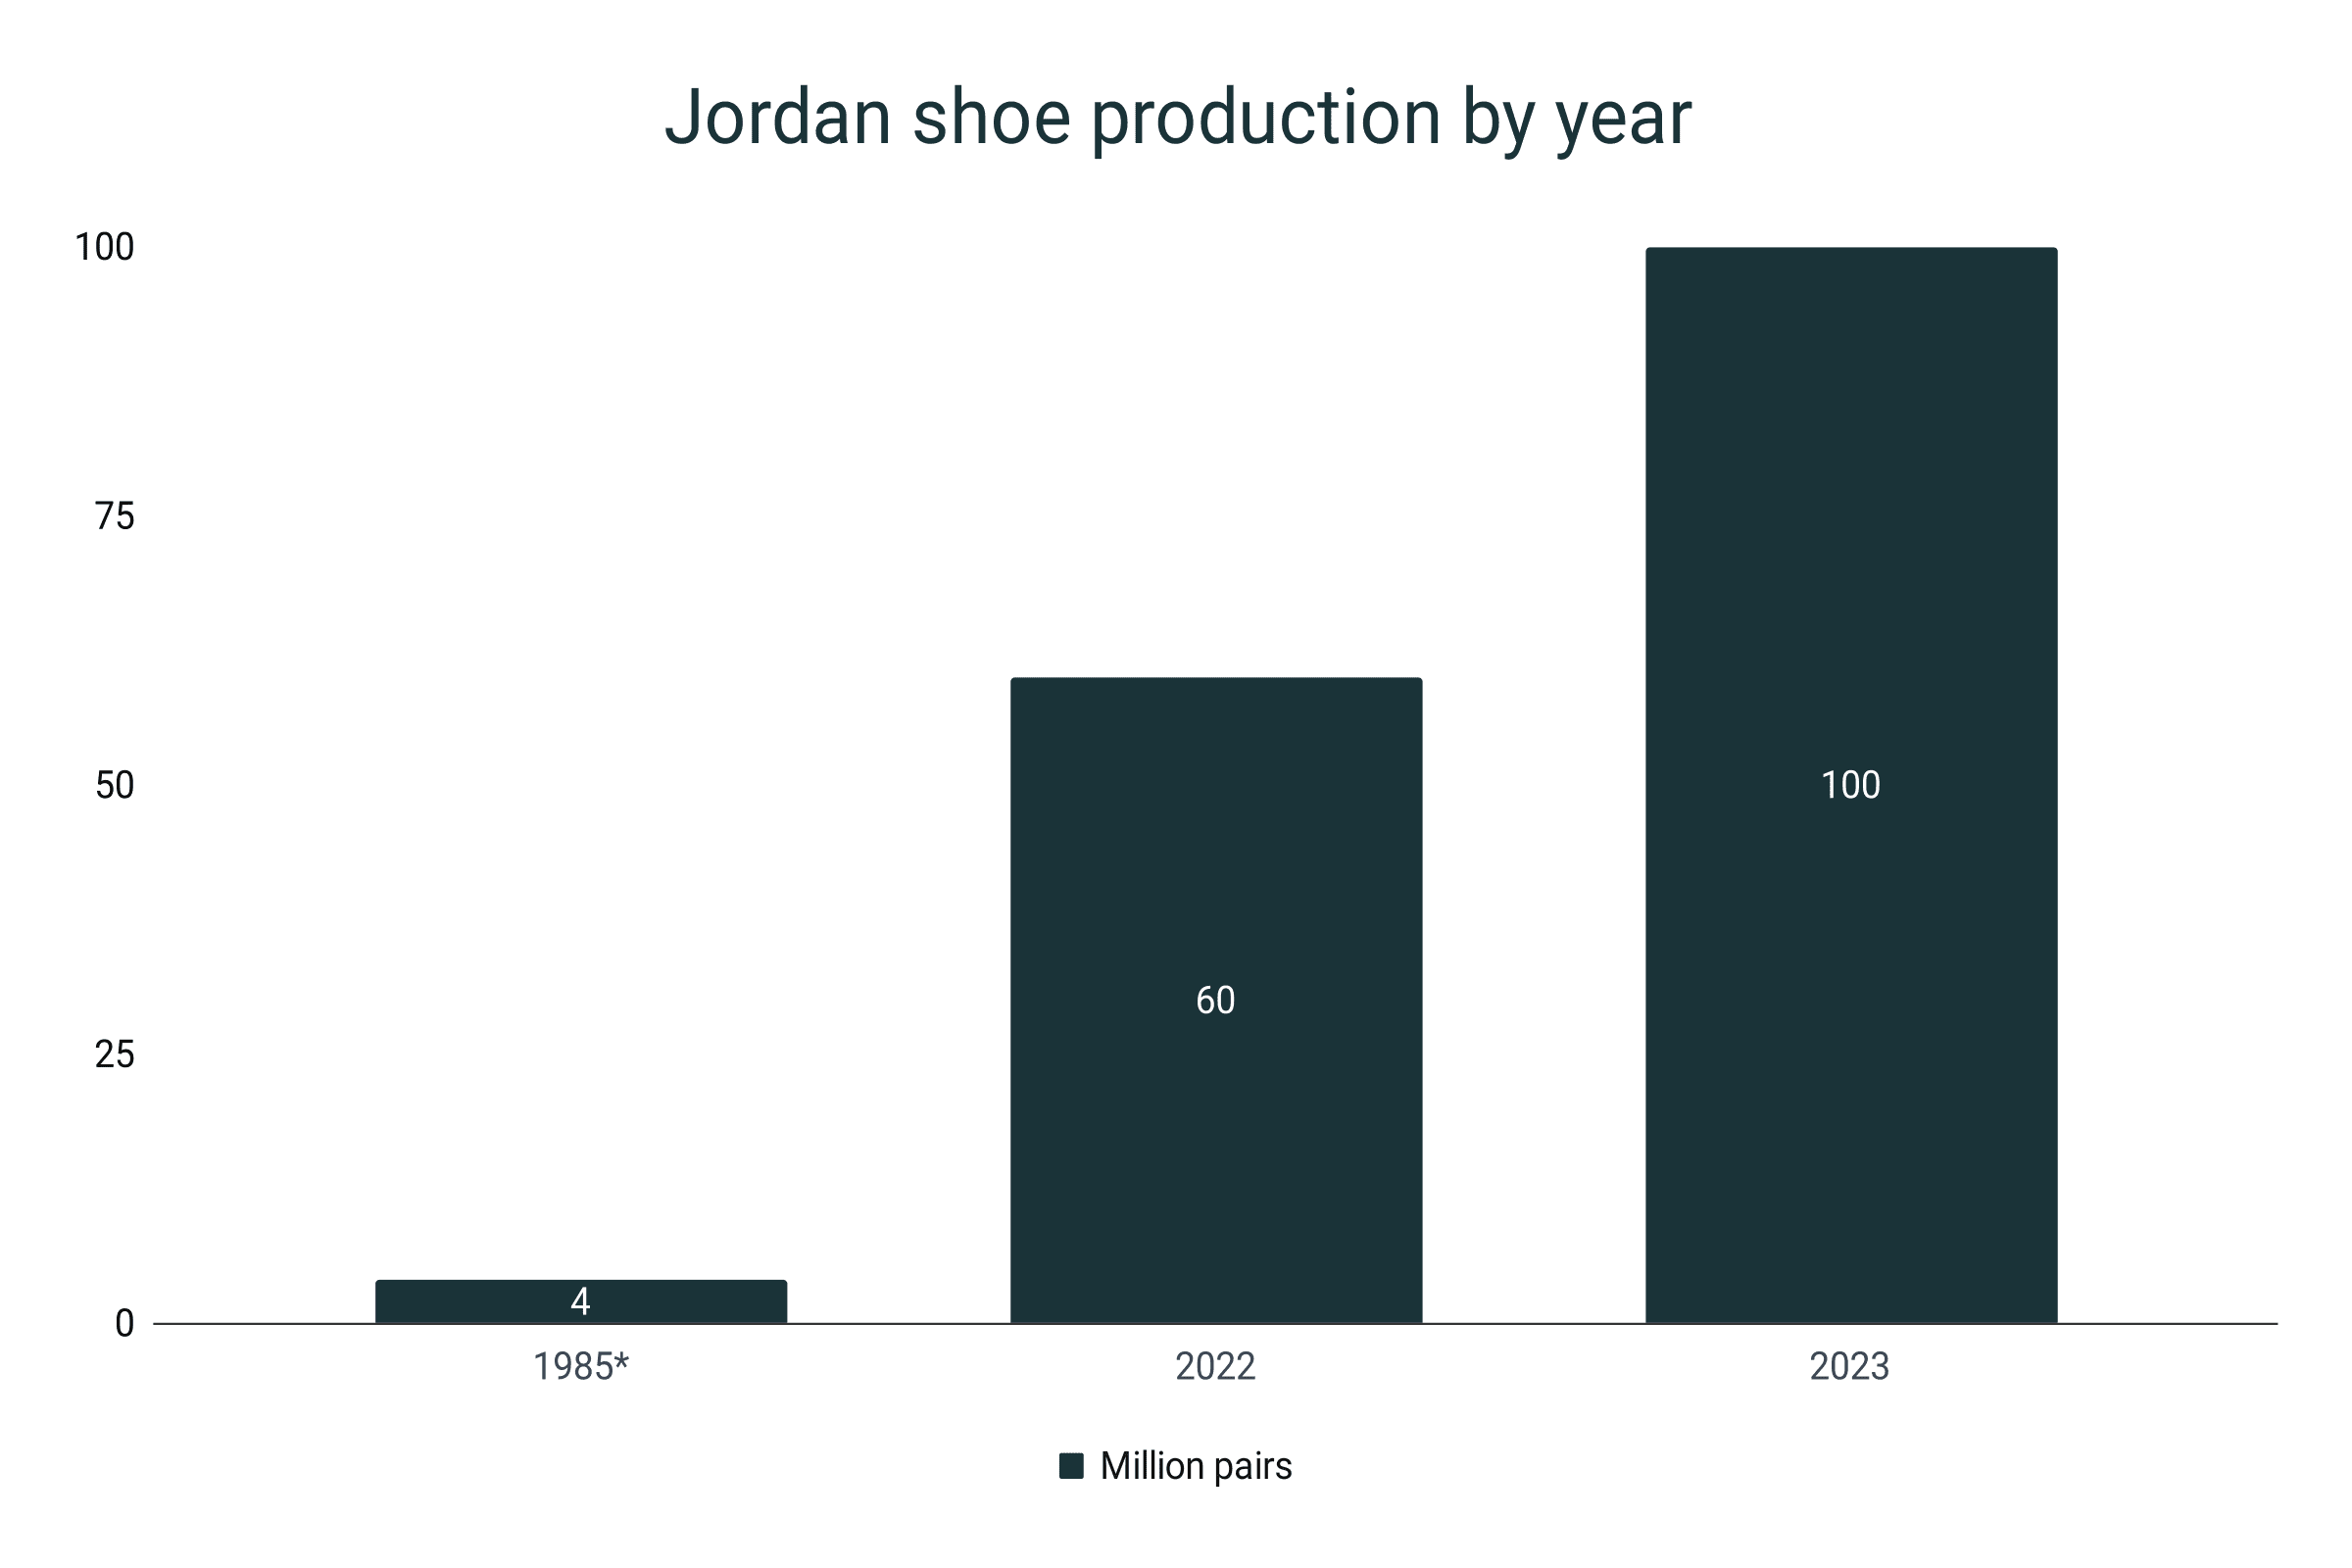
- Approximately 60 million pairs of Jordan shoes were produced in 2022.
- Compared to its debut in 1985, where the company tallied 4 million sold pairs, Jordan was able to increase its manufacturing by 1400% by 2022.
- As of 2020, the average price of a pair of Jordan shoes is $200, almost three times the original price tag of Air Jordan 1 which was sold for $64.99 in 1985.
- Air Jordan is the biggest secondary shoe market shareholder at 28%.
- The Air Jordan 13 ‘The Last Dance’ is currently the most expensive sneaker ever to be auctioned. It pitched $2.2 million in a New York Sotheby auction last April 2023.
- In terms of resale premium, the average is at 59% as of 2022.
- Eighty-nine percent of the US population is aware of the Jordan shoe brand. The figure is 76% in the United Kingdom.
- About 10% of NBA players are wearing Air Jordan shoes. Of WNBA players, 8.4% are using the brand.
Jordan shoe revenue
- When the 2023 Nike fiscal year ended in May, Jordan accumulated $6.6 billion in revenue.
- This is its highest total revenue to date. It also signifies a staggering 29.4% increase from the $5.1 billion mark the recent year.
- Compared to its revenue in the 2016 fiscal year, which tallied $2.8 billion, the Jordan brand has grown by over 135%.
- Surprisingly, while most brands suffered losses during the pandemic in 2020, the Jordan footwear brand raked in $4.8 billion and enjoyed a 29.7% growth—the brand’s highest jump since 2016.
- Even in 2021, Jordan’s revenue showed steady gains with a 6.3% increase, totaling $4.8 billion by the end of the fiscal year.
- The only time the revenues plummeted for the past seven years was recorded in 2018 when the Jordan brand scored $2.9 billion, 6.5% lower than the $3.1 billion total sales in 2017.
Jordan shoe revenue by year
|
Fiscal Year |
Revenue in billion dollars |
YoY Growth |
|
2016 |
$2.8 |
|
|
2017 |
$3.1 |
10.7% |
|
2018 |
$2.9 |
-6.5% |
|
2019 |
$3.1 |
6.9% |
|
2020 |
$3.7 |
19.4% |
|
2021 |
$4.8 |
29.7% |
|
2022 |
$5.1 |
6.3% |
|
2023 |
$6.6 |
29.4% |
Jordan shoe market share
- As of 2021, Jordan shoes account for 55% of all retro basketball shoes in the market.
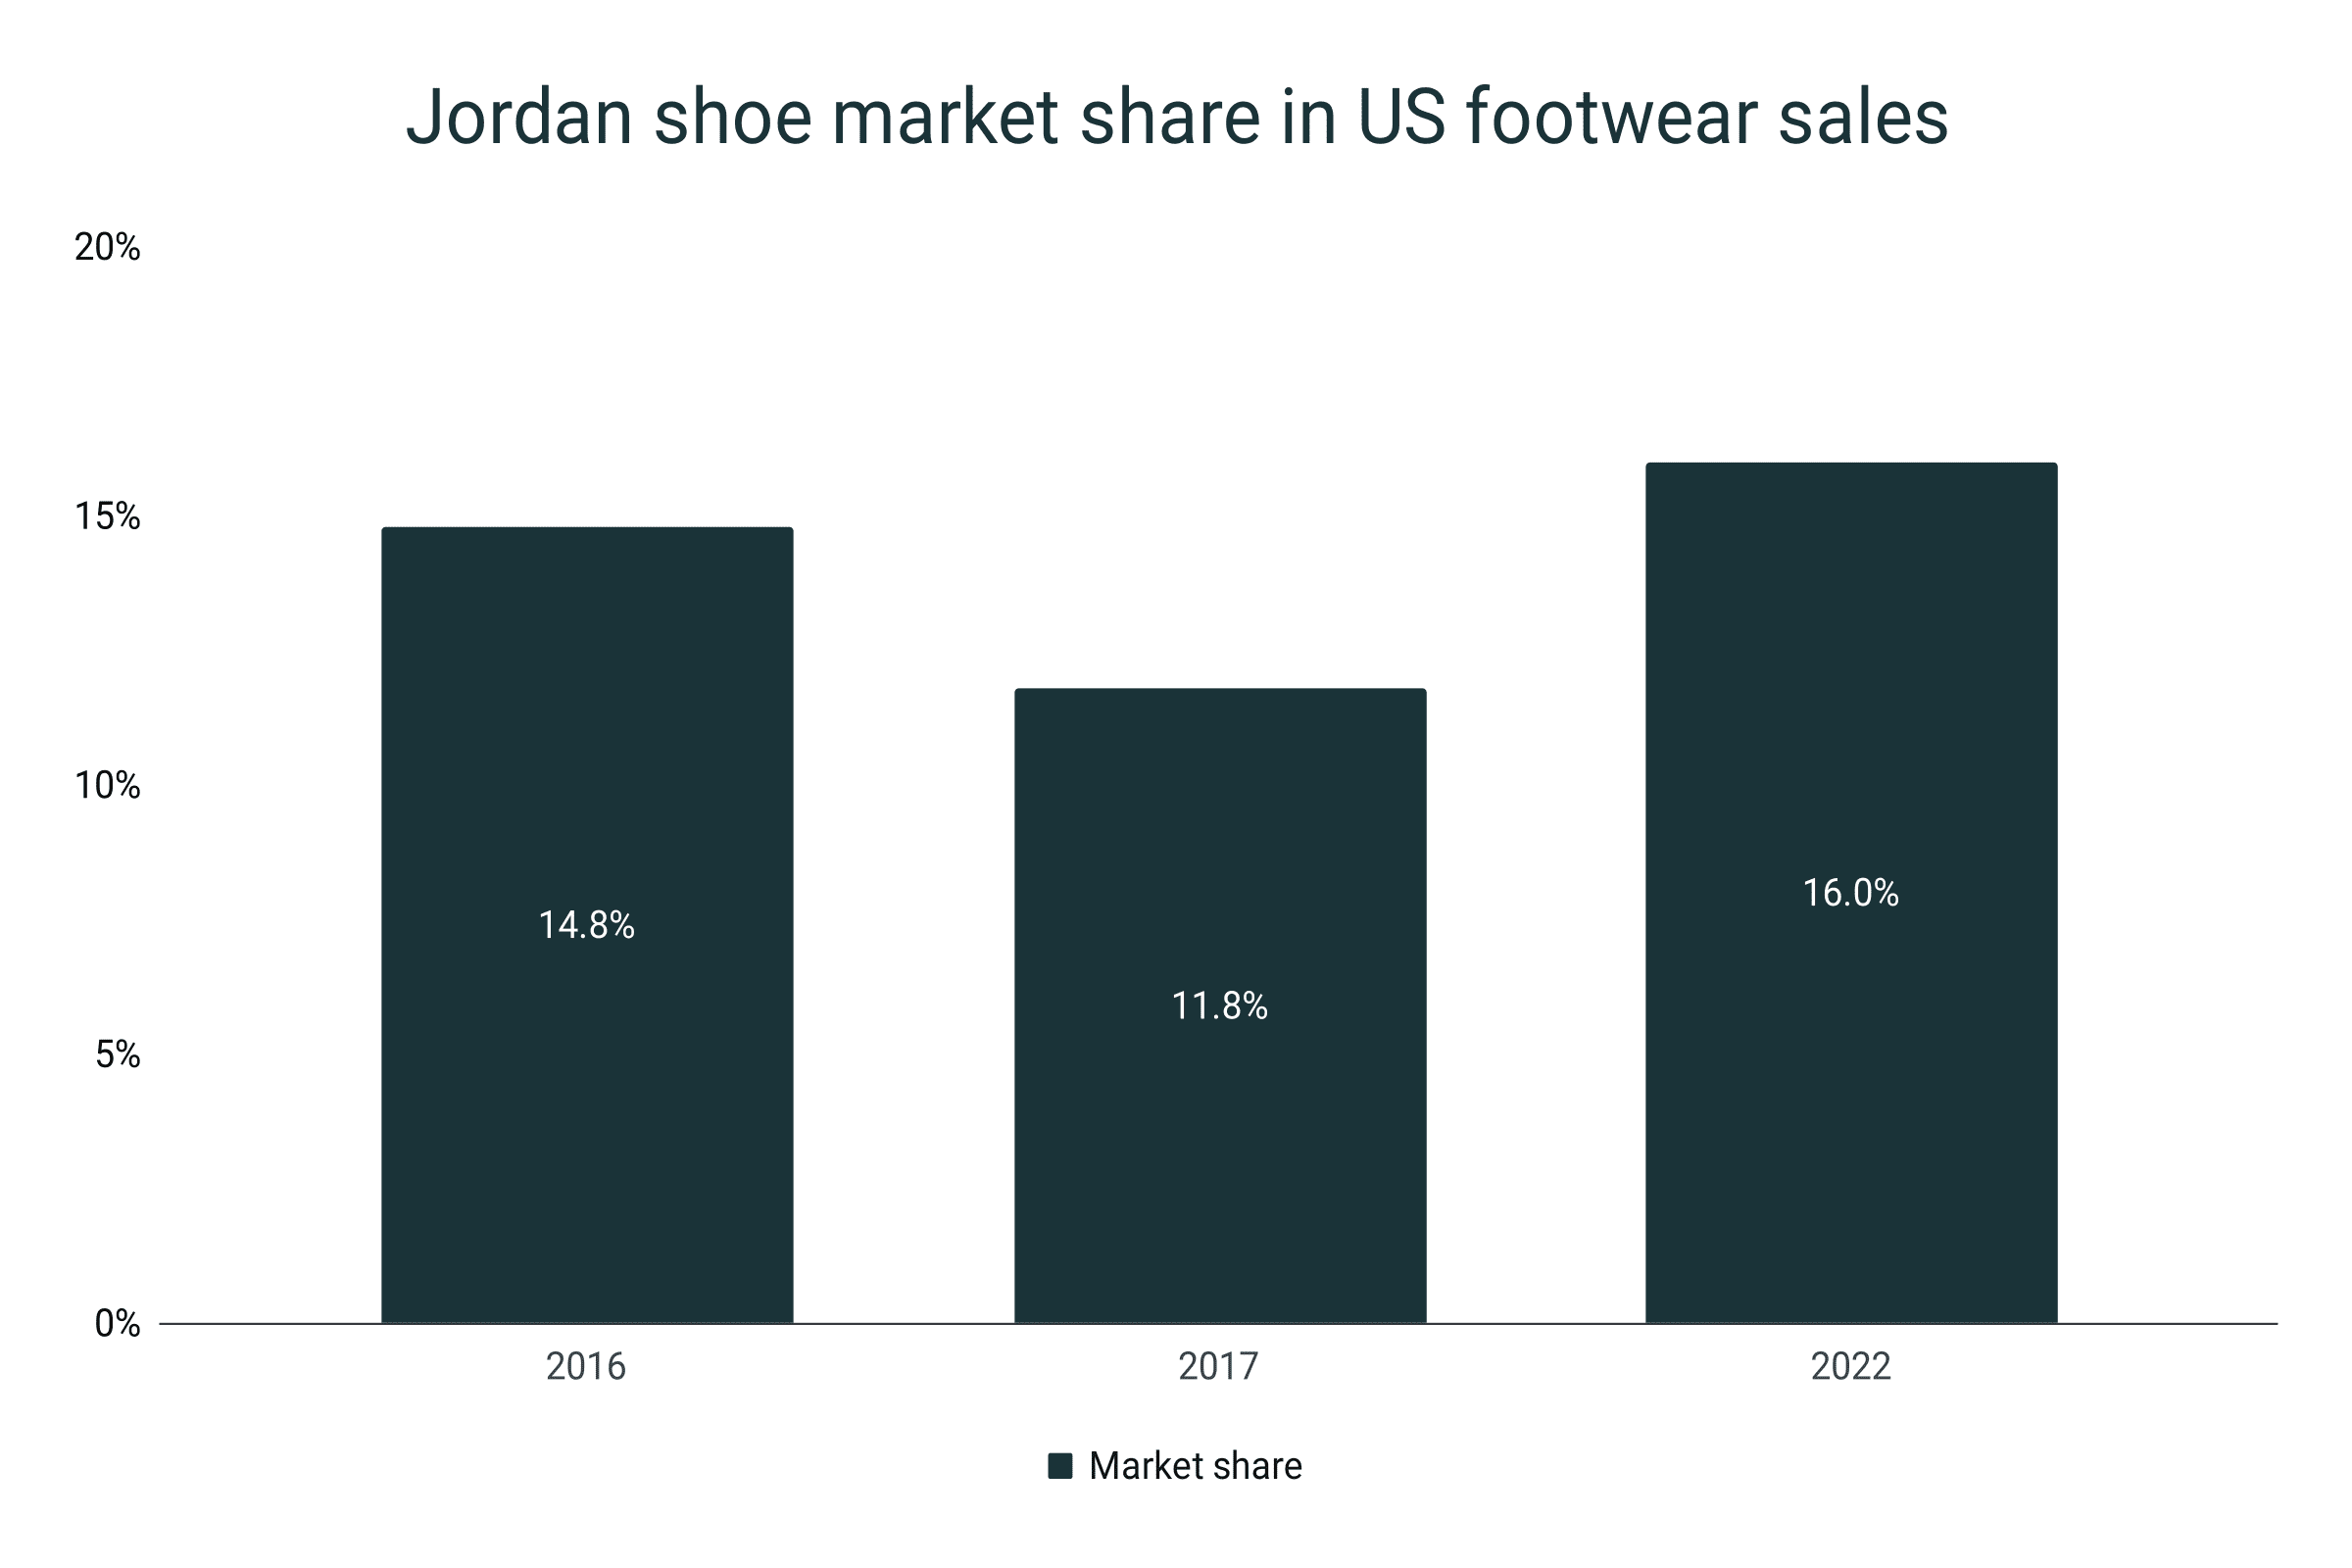
- In the United States, the Jordan shoe brand is 16% of its entire athletic footwear sales.
- Data from 2017 reports that the brand’s market share by then was only 11.8%.
- Meaning, from 2017 to 2022, the Jordan brand experienced a 35.6% change.
- In 2016, Jordan held a 14.8% portion of the US athletic shoe market.
Jordan shoe market in the US athletic footwear segment
|
Year |
Market share |
|
2016 |
14.8% |
|
2017 |
11.8% |
|
2022 |
16% |
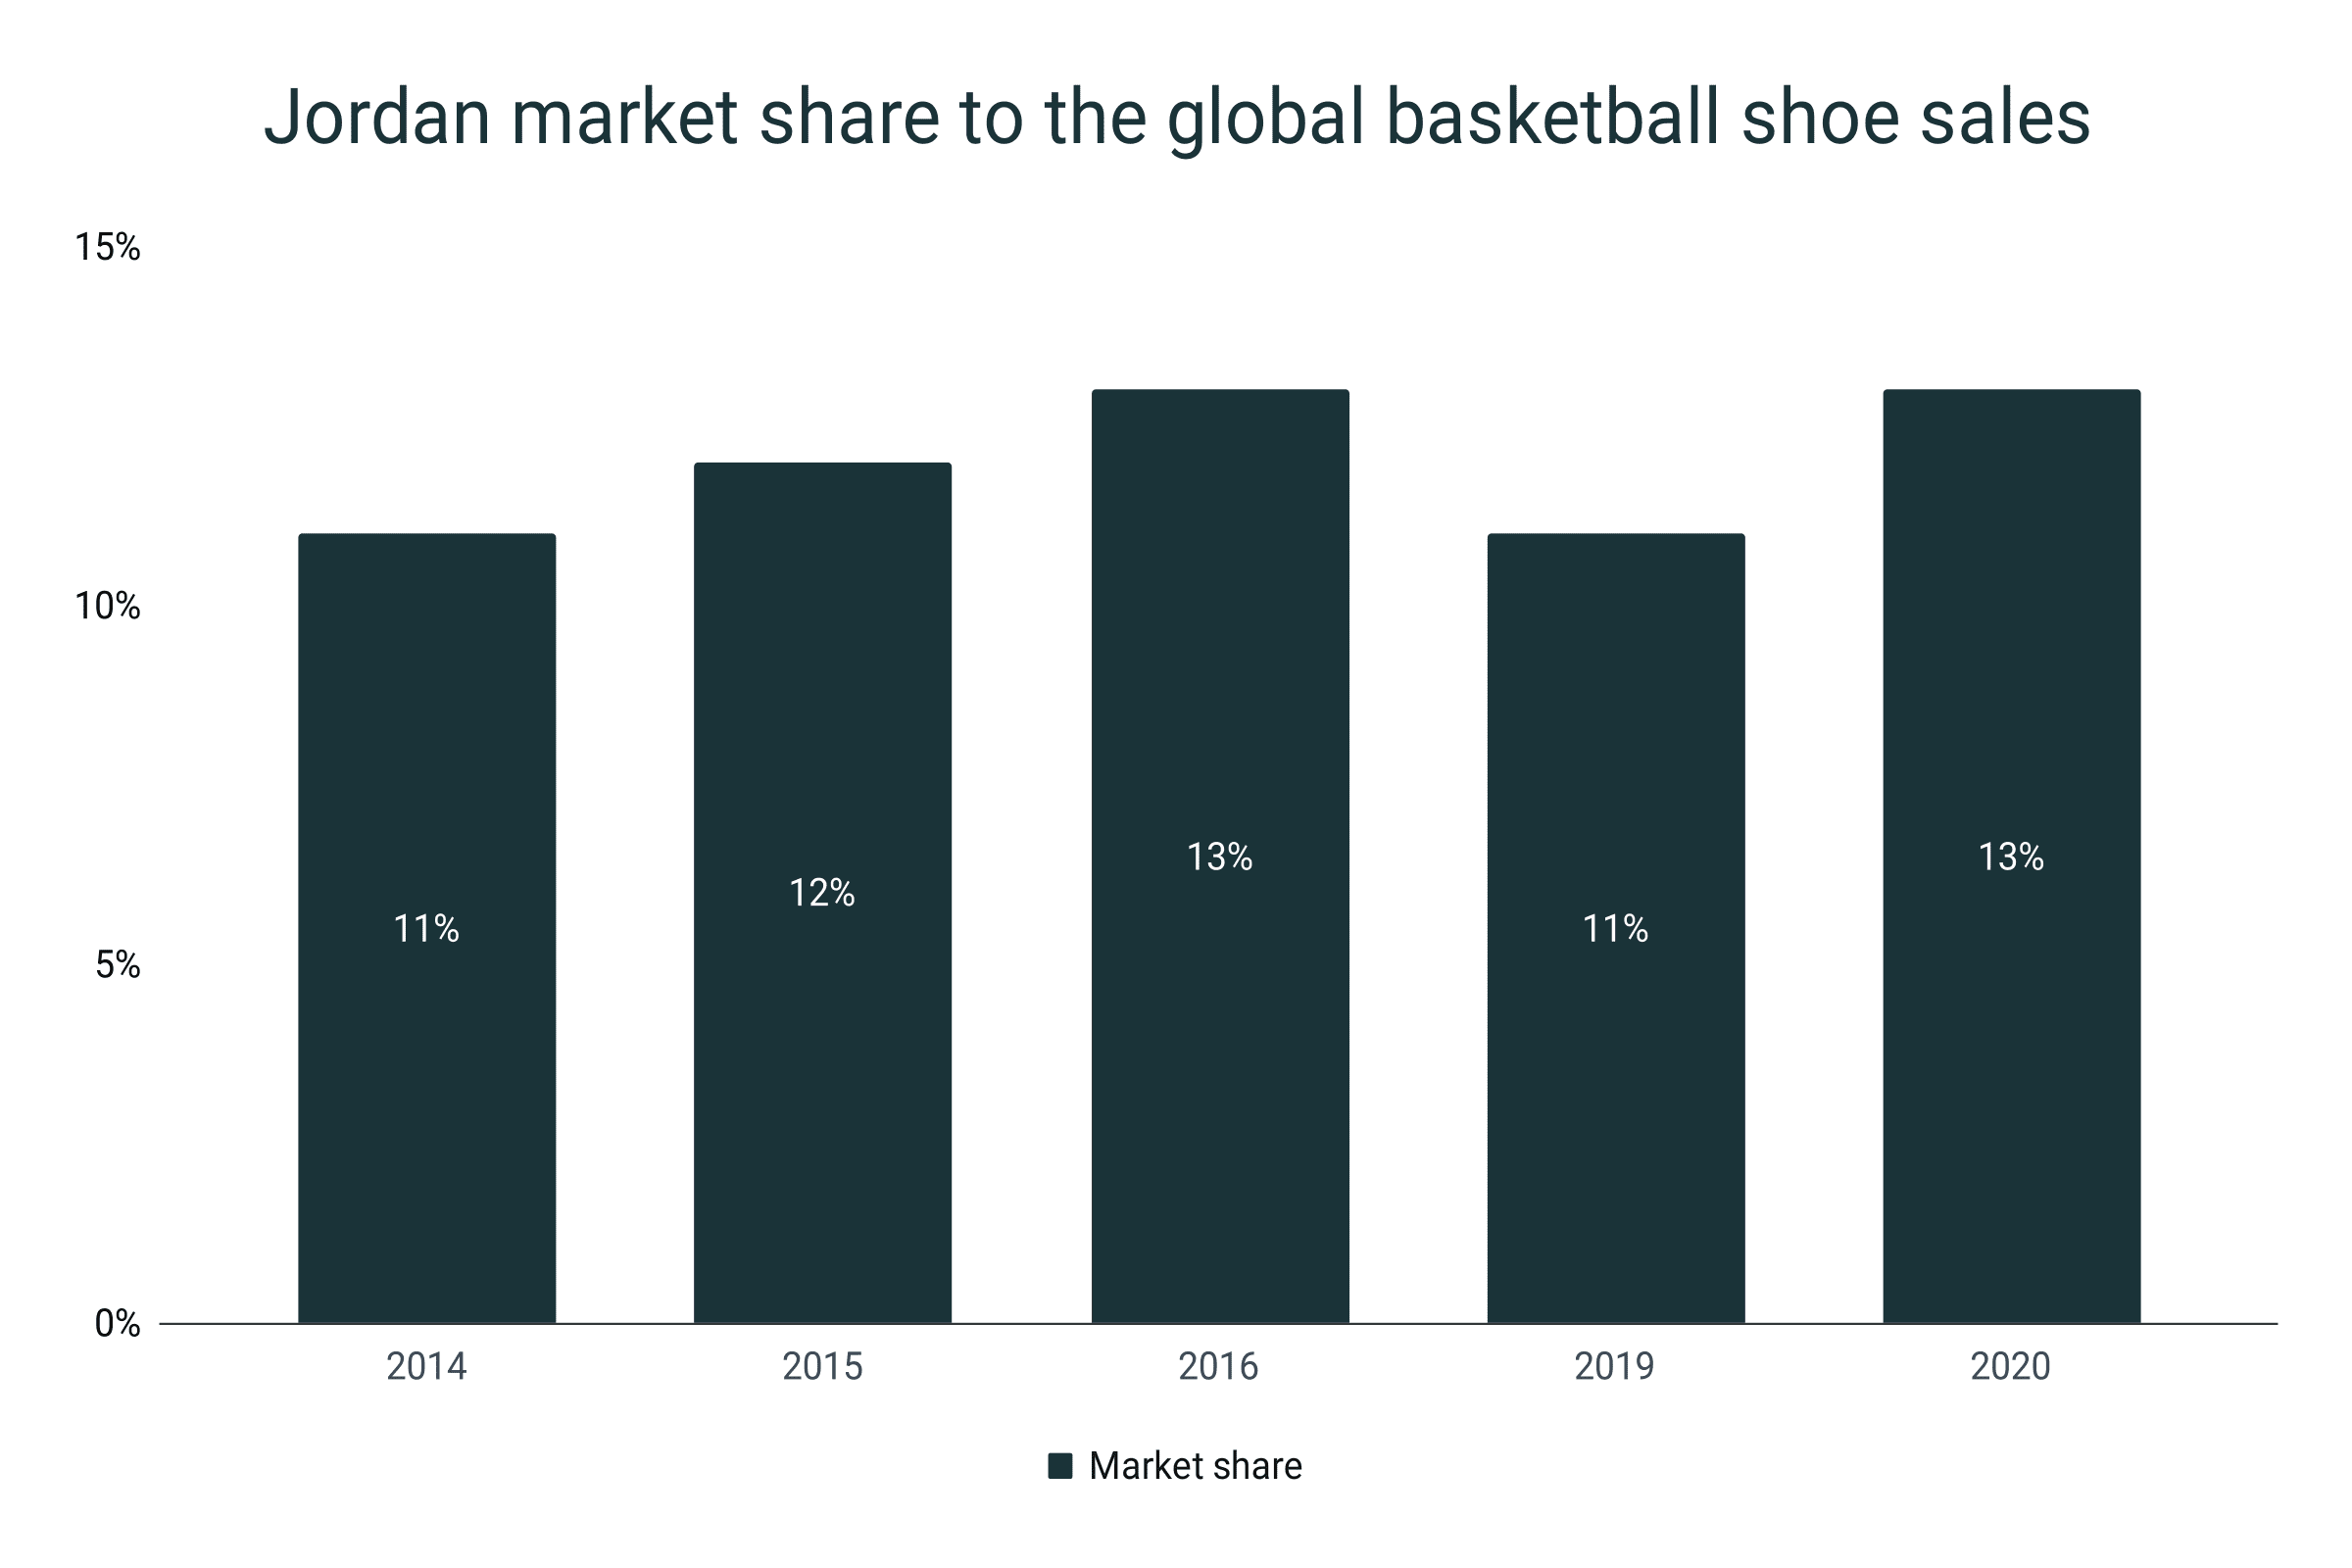
- In terms of global basketball footwear sales, Jordan held 13% of the market in 2020.
- A year ago, in 2019, Jordan had an 11% cut of the total basketball market.
- Back in 2014, the shoe brand also took 11% of the entire basketball footwear segment.
Jordan shoe market share relative to the global basketball shoe market
|
Year |
Market share |
|
2014 |
11% |
|
2015 |
12% |
|
2016 |
13% |
|
2019 |
11% |
|
2020 |
13% |
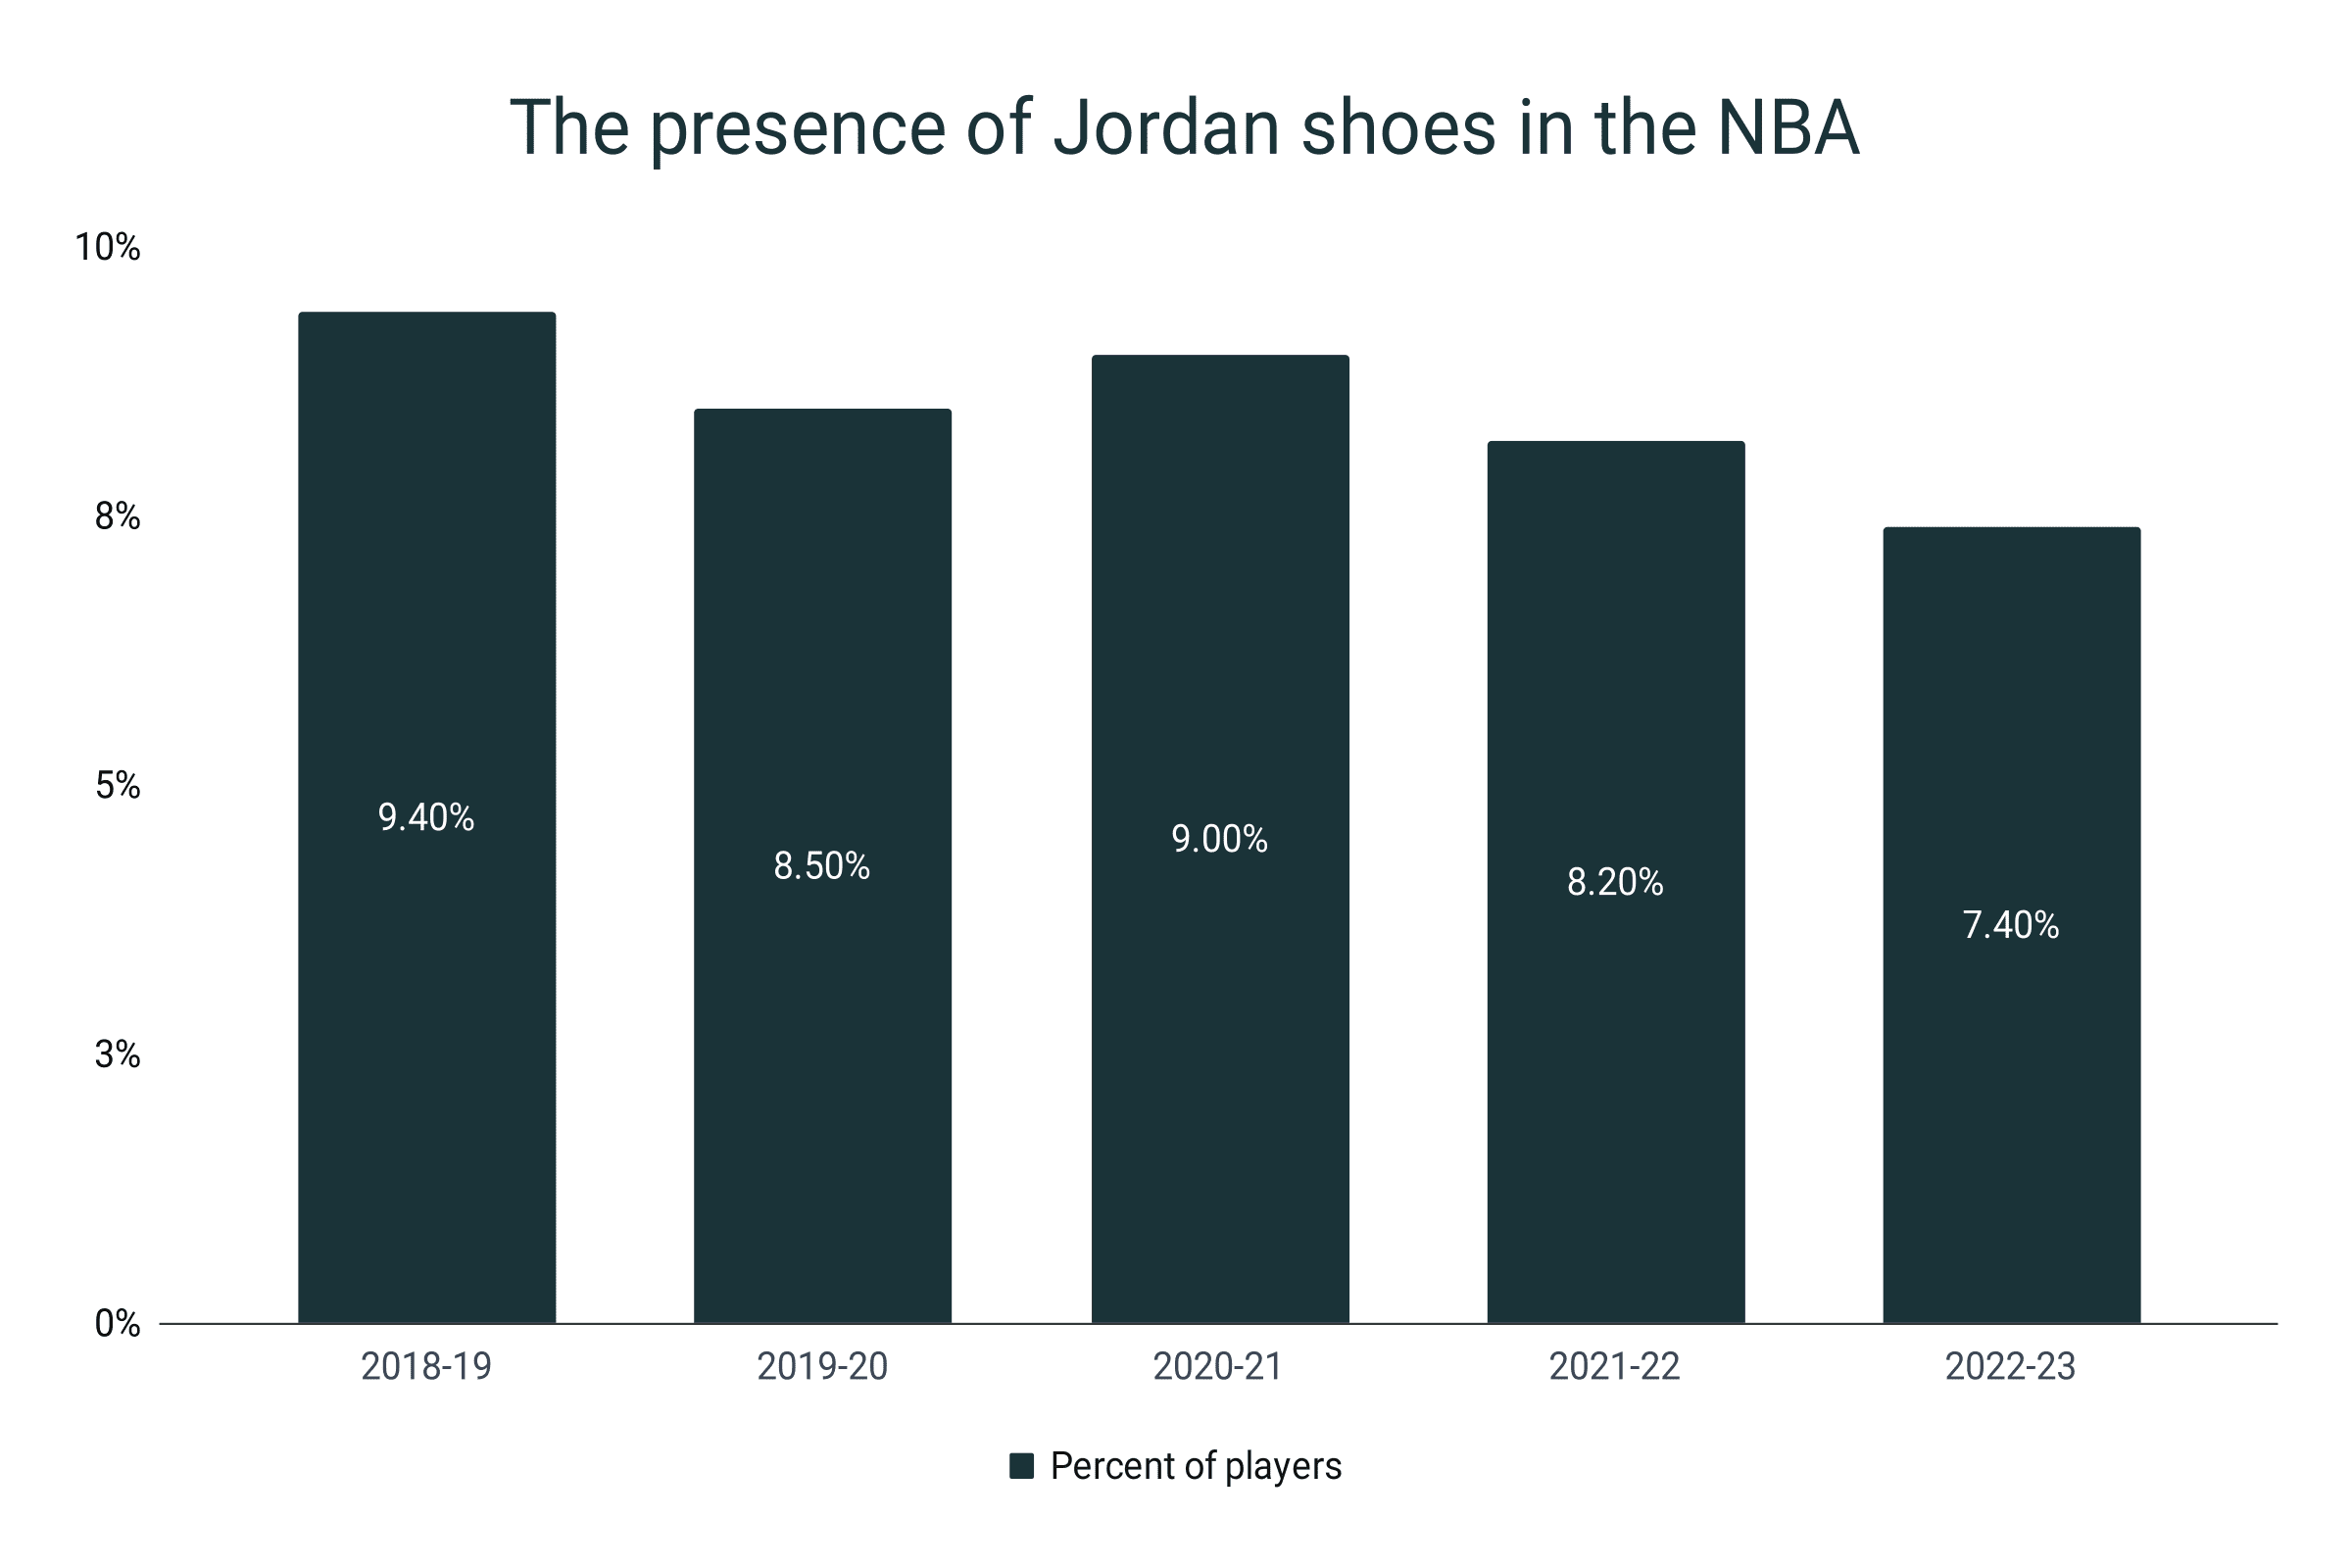
- In the National Basketball Association (NBA), during the 2022-23 season, only 7.4% of the players wore the Jordan shoe brand.
- This is lower than the 8.2% showing in the 2021-22 season.
- The highest percentage of players who sported the brand was in the 2018-29 season wherein 9.4% wore Jordans.
- Averaging the past five NBA seasons, approximately 8.5% of the players are seen wearing the brand.
- For the women’s division, the WNBA, the figure is not far off at 8.4%.
The presence of Jordan shoes in the NBA
|
Season |
Percent of players |
|
2018-19 |
9.4% |
|
2019-20 |
8.5% |
|
2020-21 |
9.0% |
|
2021-22 |
8.2% |
|
2022-23 |
7.4% |
|
Ave. (2018-23) |
8.5% |
Jordan shoe production
- In 2022, approximately 60 million pairs of Jordan shoes were manufactured.
- When the first Jordan shoe, the Air Jordan 1 was introduced in 1985, Nike expected to sell about 100,000 pairs.
- However, in its debut, Jordan has sold 4 million pairs of Air Jordan 1s.
- Thus, the production of Jordan footwear has grown by about 1400% from its introduction in 1985 to its current operation in 2023.
- The lifespan of a pair of Jordans is said to be around 7-10 years when in storage.
- When used and maintained regularly, the shoe lasts for 2-3 years.
Jordan shoe production by year
|
Year |
Million pairs |
|
1985* |
4 |
|
2022 |
60 |
*Air Jordan 1 debut
Jordan shoe prices
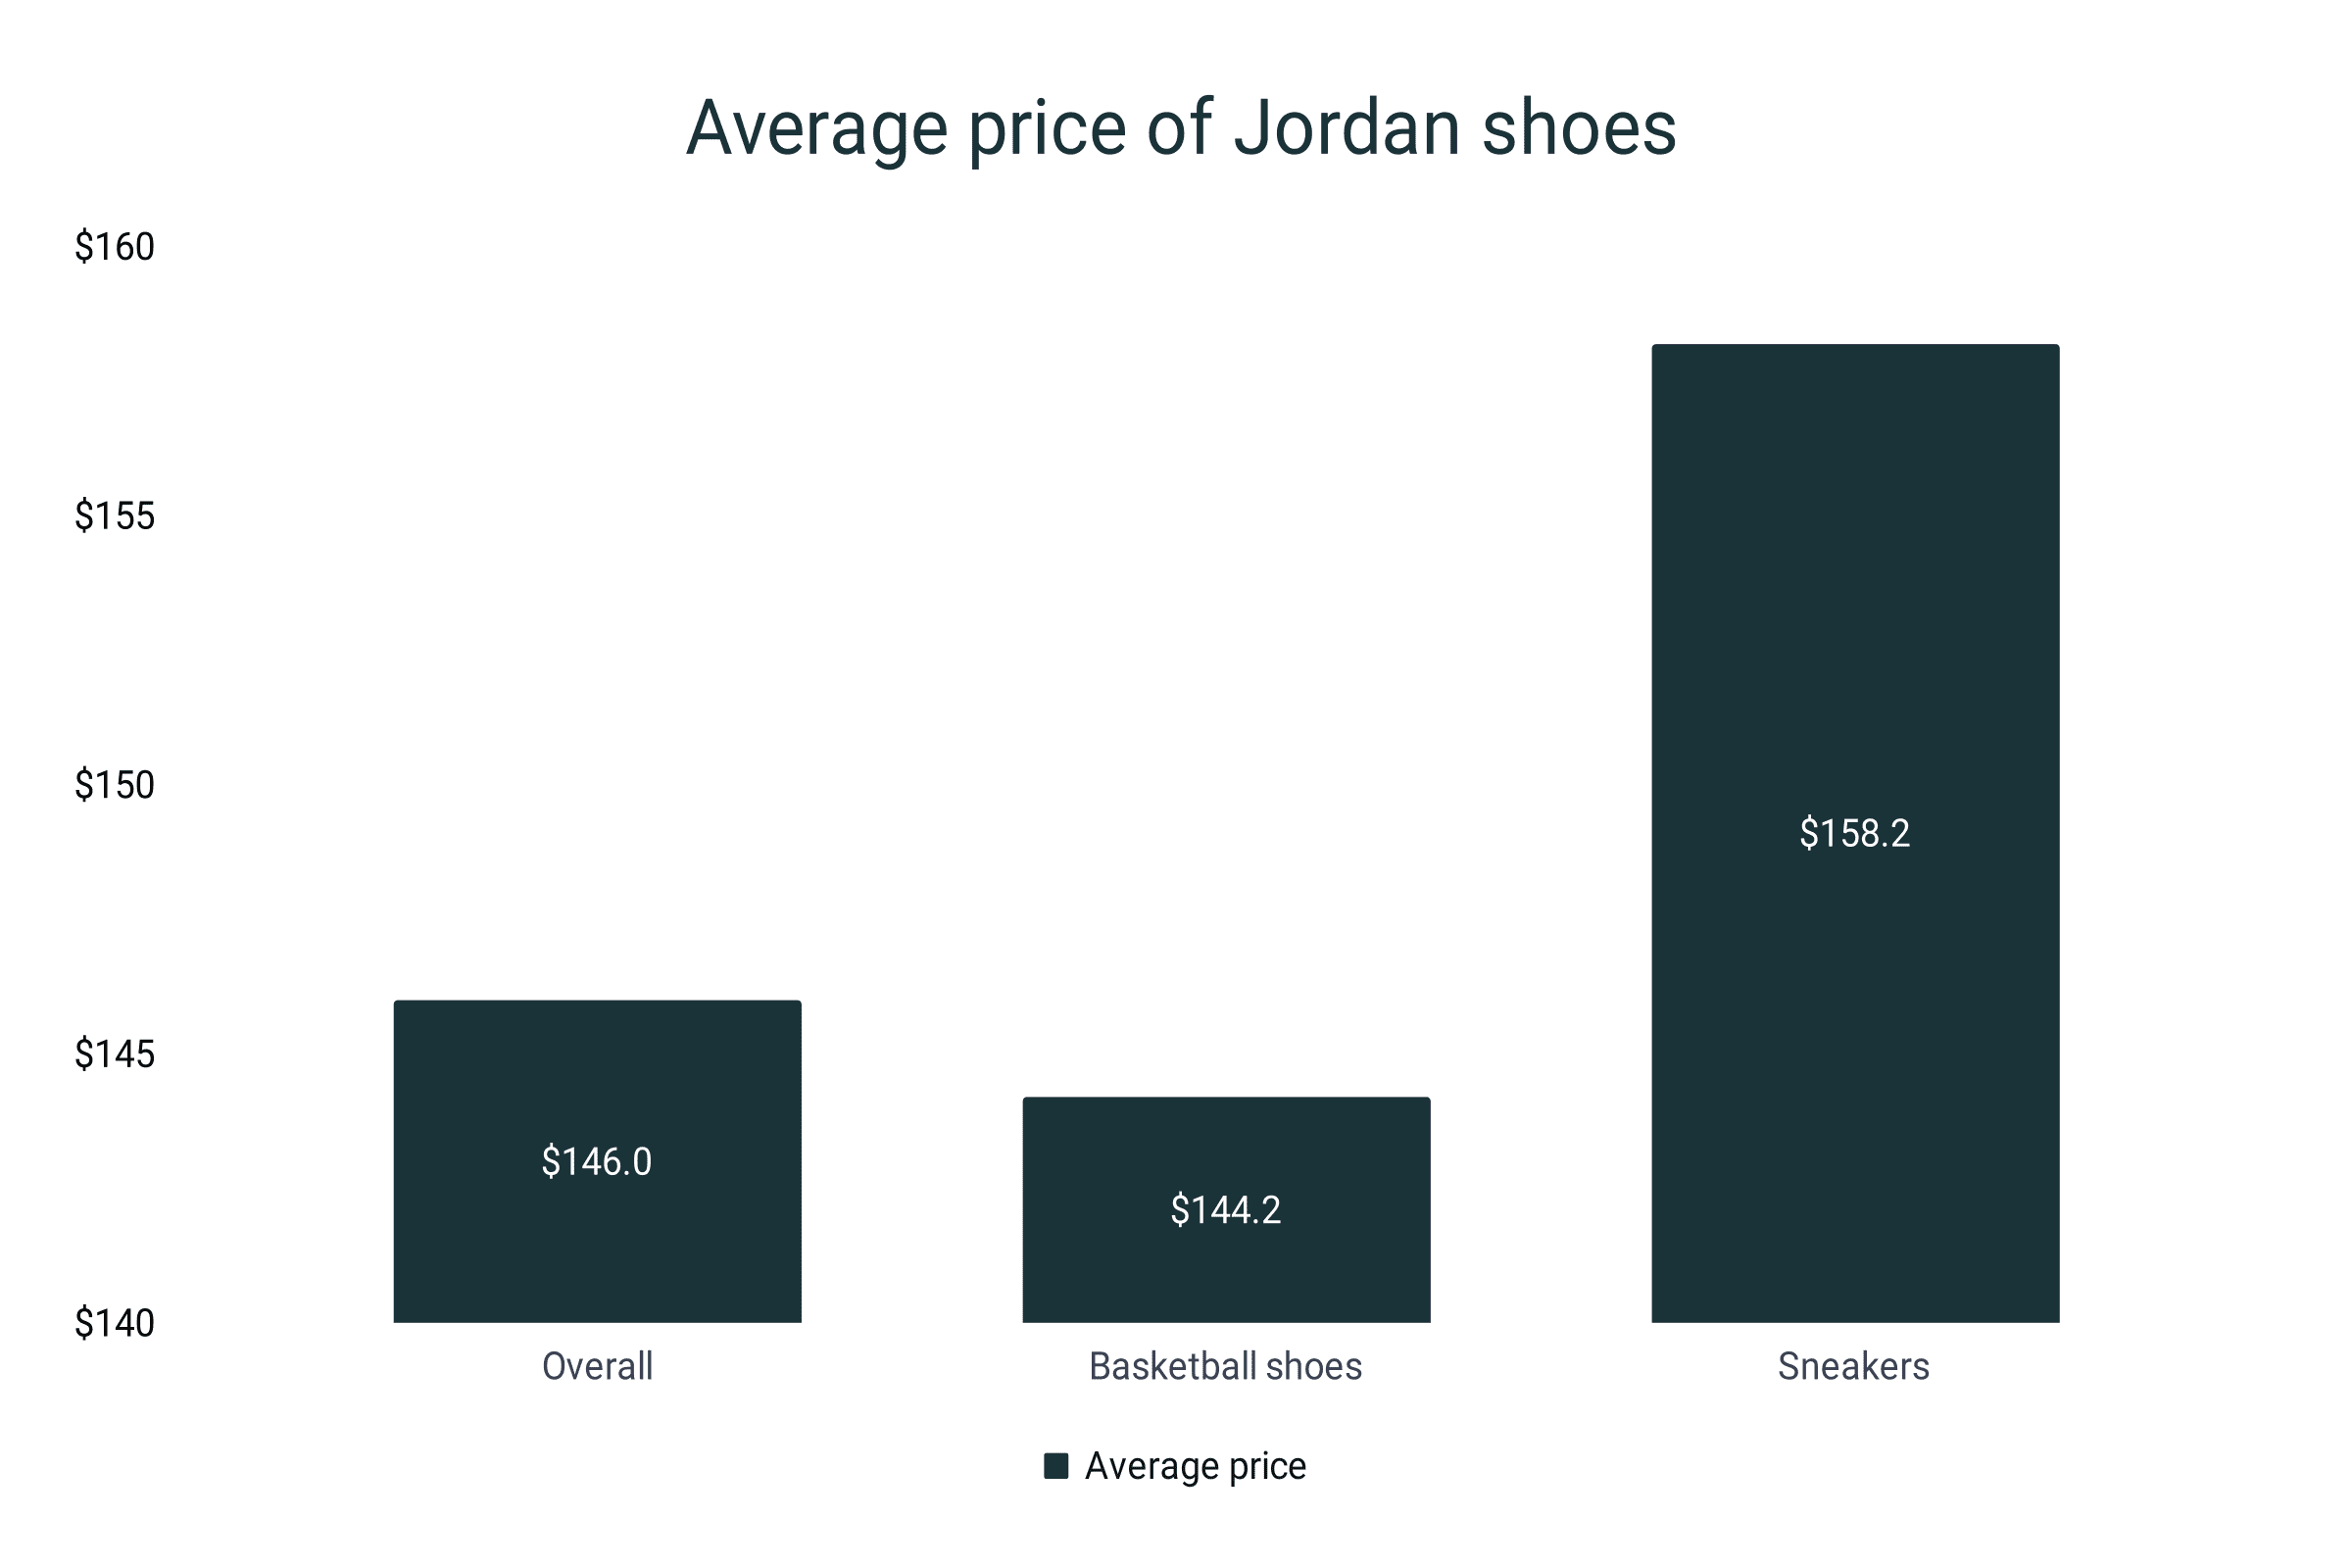
- A pair of Jordan shoes sells for $146 on average.
- Jordan basketball shoes have an average price tag of $144.2.
- Jordans are 17.2% more expensive compared to an average b-ball shoe that fetches for $123.
- The mean cost of Jordan sneakers is $158.2. Meanwhile, the average sneaker is 34.9% cheaper at an average price of $103.
- During its debut in 1985, a pair of Jordans cost $65.
- Meaning, the price of a pair of Jordans has ballooned by 124.6% in over 30 years
Jordan shoe resale market
- Jordan shoes are the biggest secondary market with a 28% share.
- In 2020, the combined revenue from the resale of Nike and Air Jordan was valued at $7.1 billion. In 2014, it was $0.9 billion.
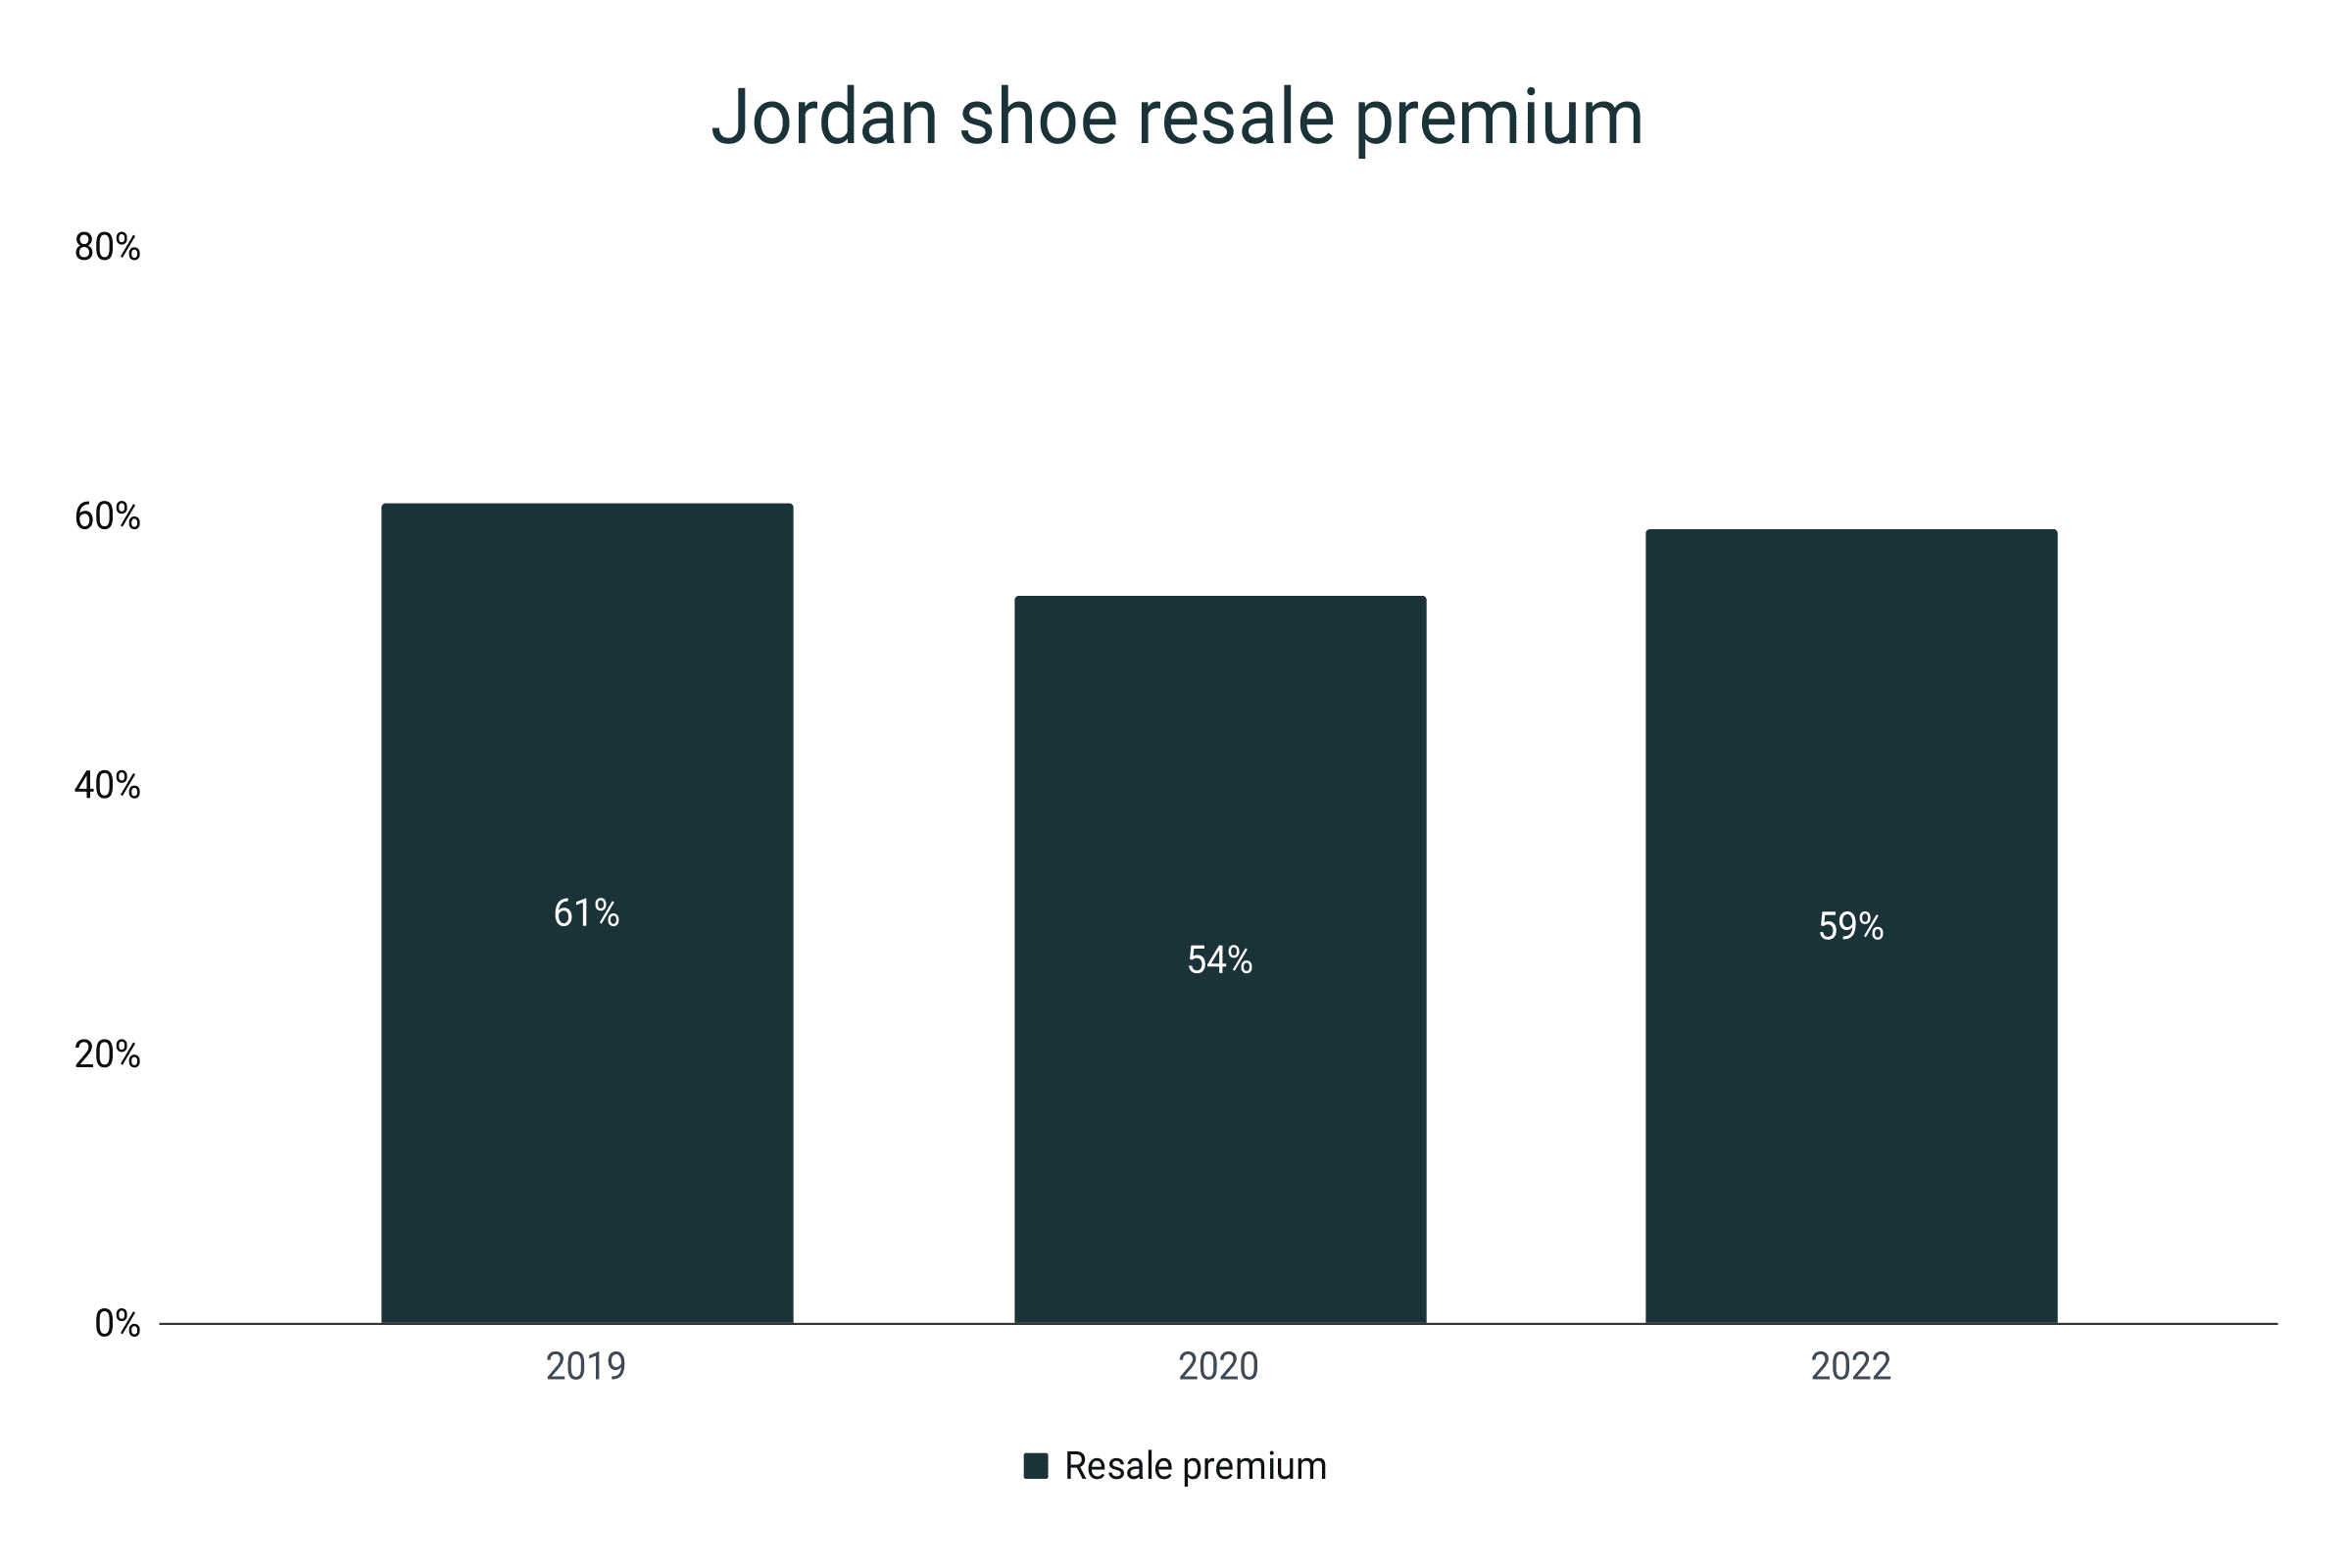
- In terms of premium, a Jordan shoe sells 59% more than its original retail price in 2022.
- The premium is higher at 54% in 2020 and 61% in 2019.
- Meaning, a $100 Jordan One Take 4, for example, resells for $161 in 2019, $154 in 2020, and $159 in 2022.
- Air Jordan 1 remains the most sought-after resale sneaker, taking 23% of the entire secondary sneaker market. It resells for $260.
- The average resale price of all Jordan shoes is $266.
Jordan shoe resale premium
|
Year |
Resale premium |
|
2019 |
61% |
|
2020 |
54% |
|
2022 |
59% |
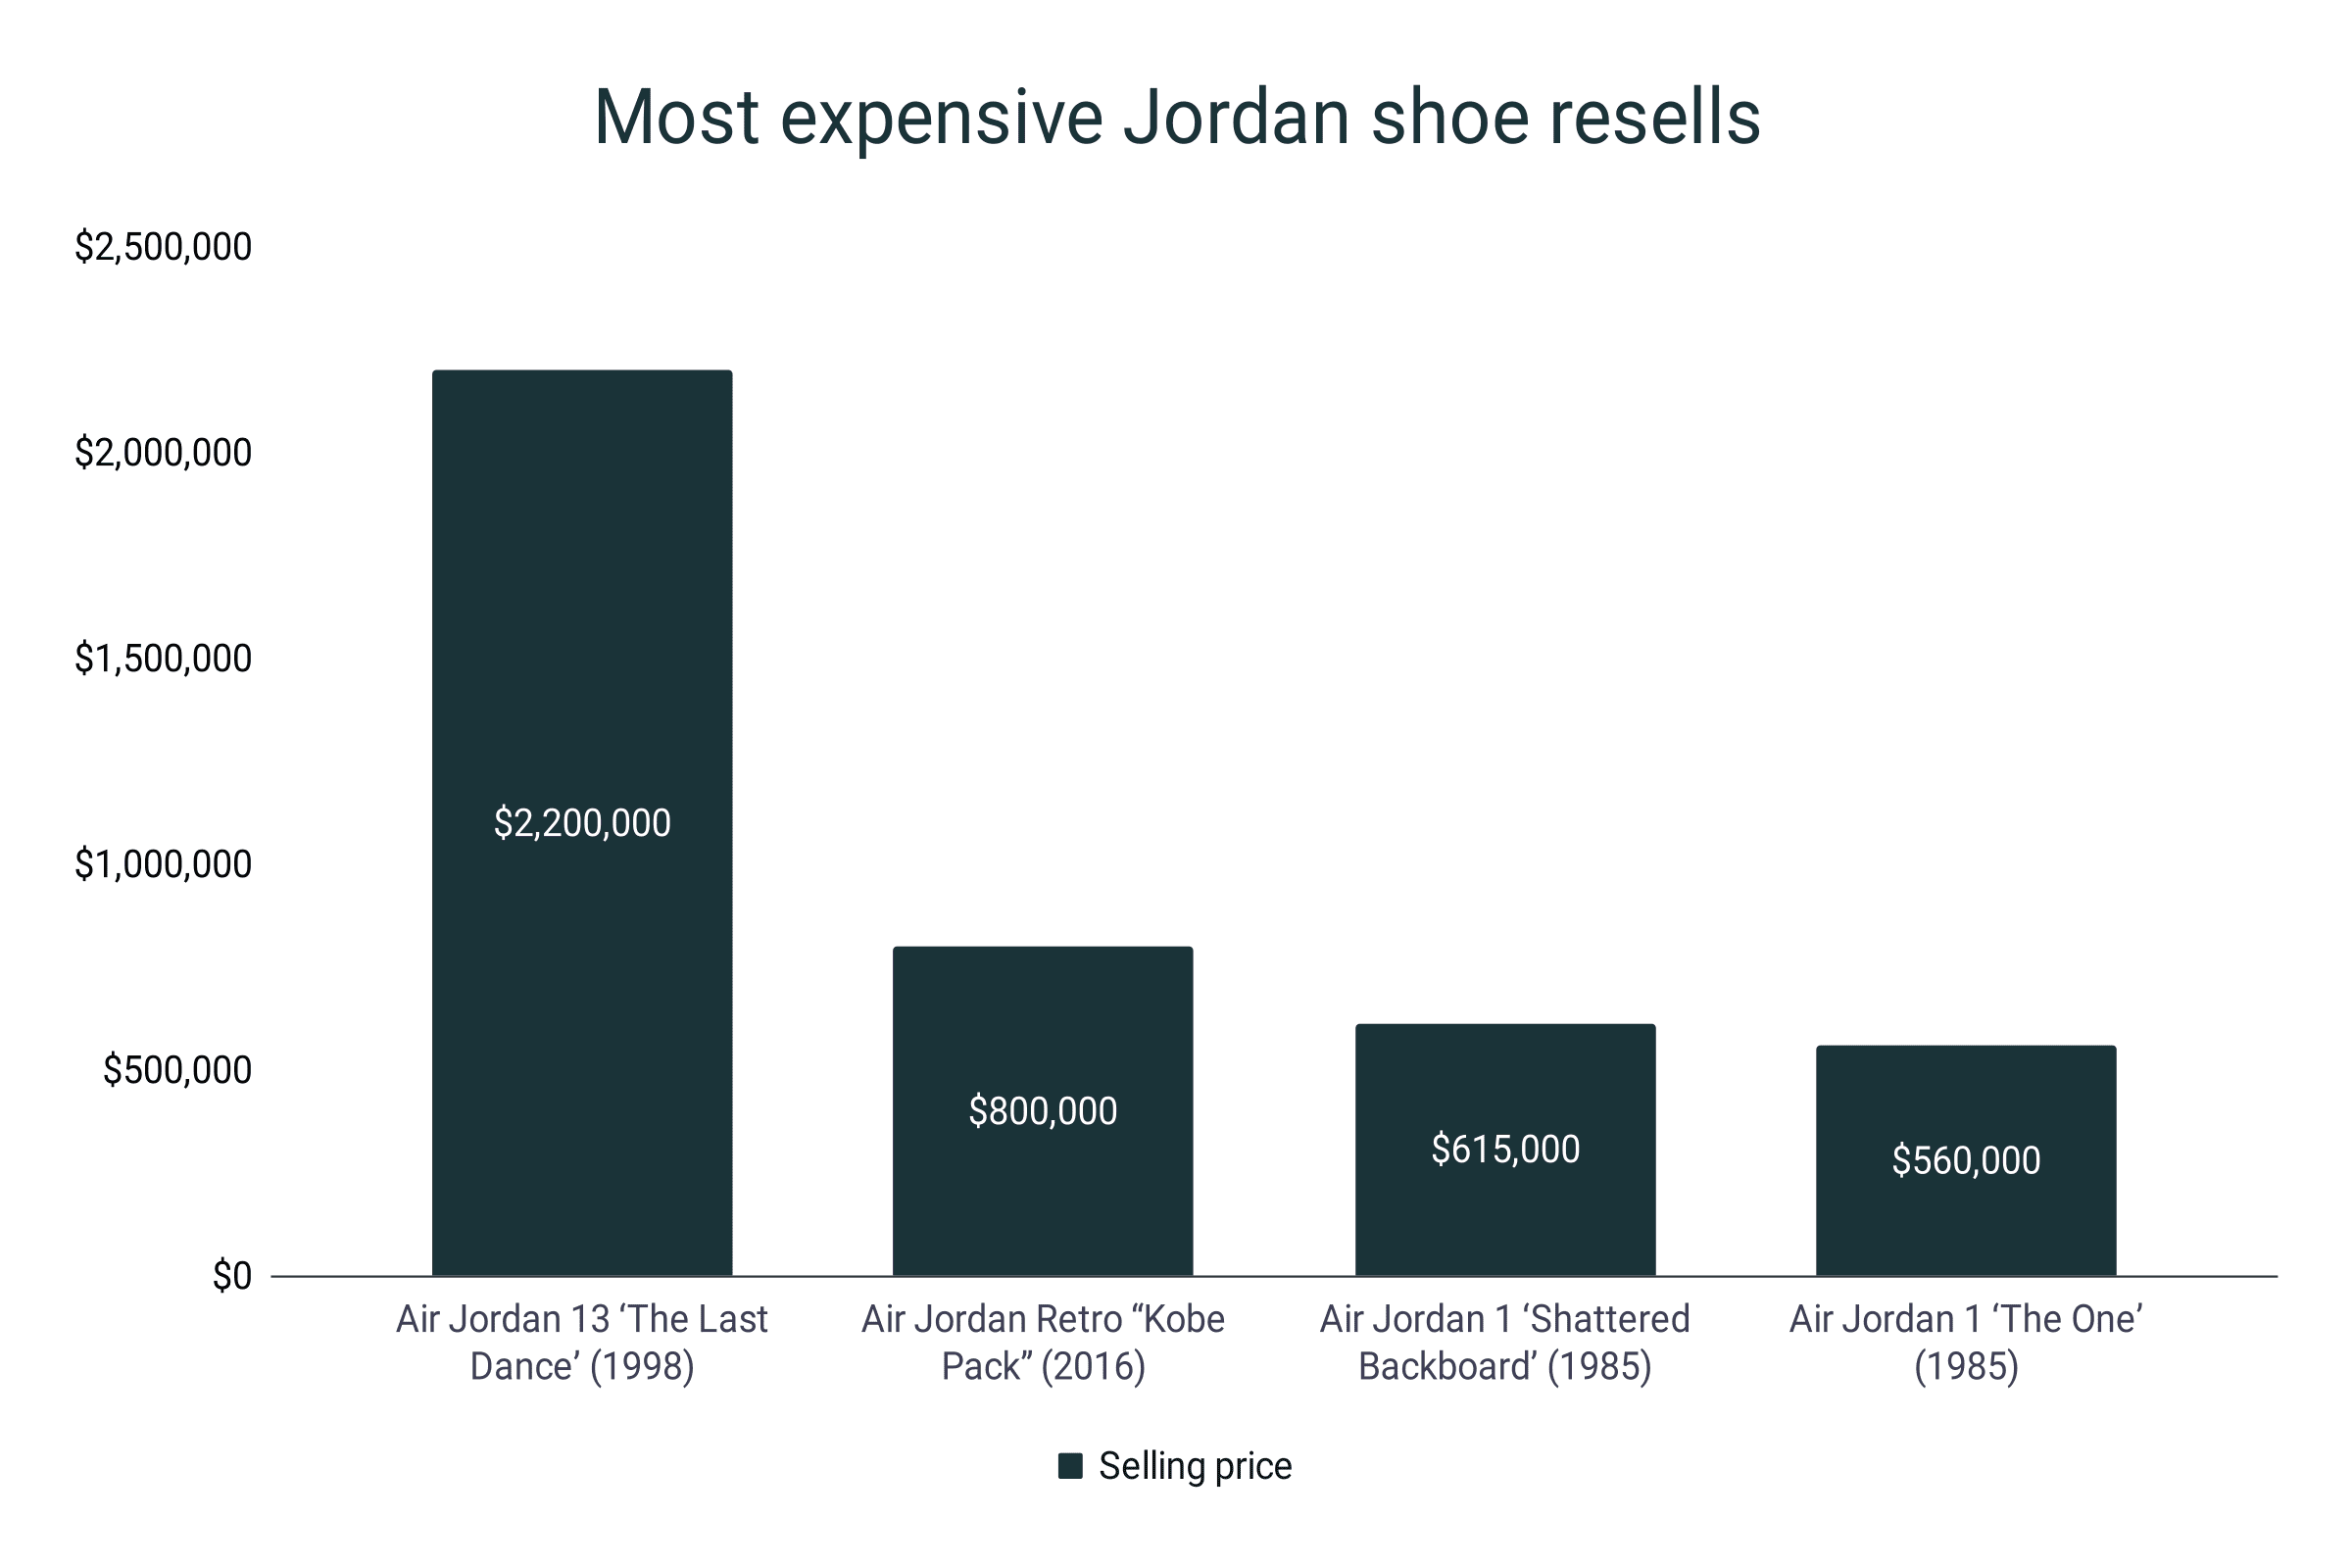
- In 2023, the Air Jordan 13 ‘The Last Dance’ became the most expensive auctioned sneaker ever. It fetched a whopping $2.2 million in a Sotheby auction in New York.
- Next in line is the Air Jordan Retro “Kobe Pack” which was sold for $800 thousand in 2020.
- The most expensive Air Jordan 1, and the third most expensive on this list, is the 1985 ‘Shattered Backboard.’ It was valued at $615,000 in 2020.
- Fourth on the list is the $560 million Air Jordan ‘The One” which was a pair released in 1985.
- Five out of the ten most expensive secondary sneakers are from Jordan.
- Additionally, Drake’s Solid Gold OVO x Air Jordans is one of the most expensive releases of the brand. It is estimated to be valued at $2.1 million.
Most expensive Jordan shoe resells
|
Shoe (Release year) |
Selling price (Year sold) |
|
Air Jordan 13 ‘The Last Dance’ (1998) |
$2,200,00 (2023) |
|
Air Jordan Retro “Kobe Pack” |
$800,000 (2020) |
|
Air Jordan 1 ‘Shattered Backboard’ (1985) |
$615,000 (2020) |
|
Air Jordan 1 ‘The One’ (1985) |
$560,000 (2020) |
The popularity of Jordan shoes
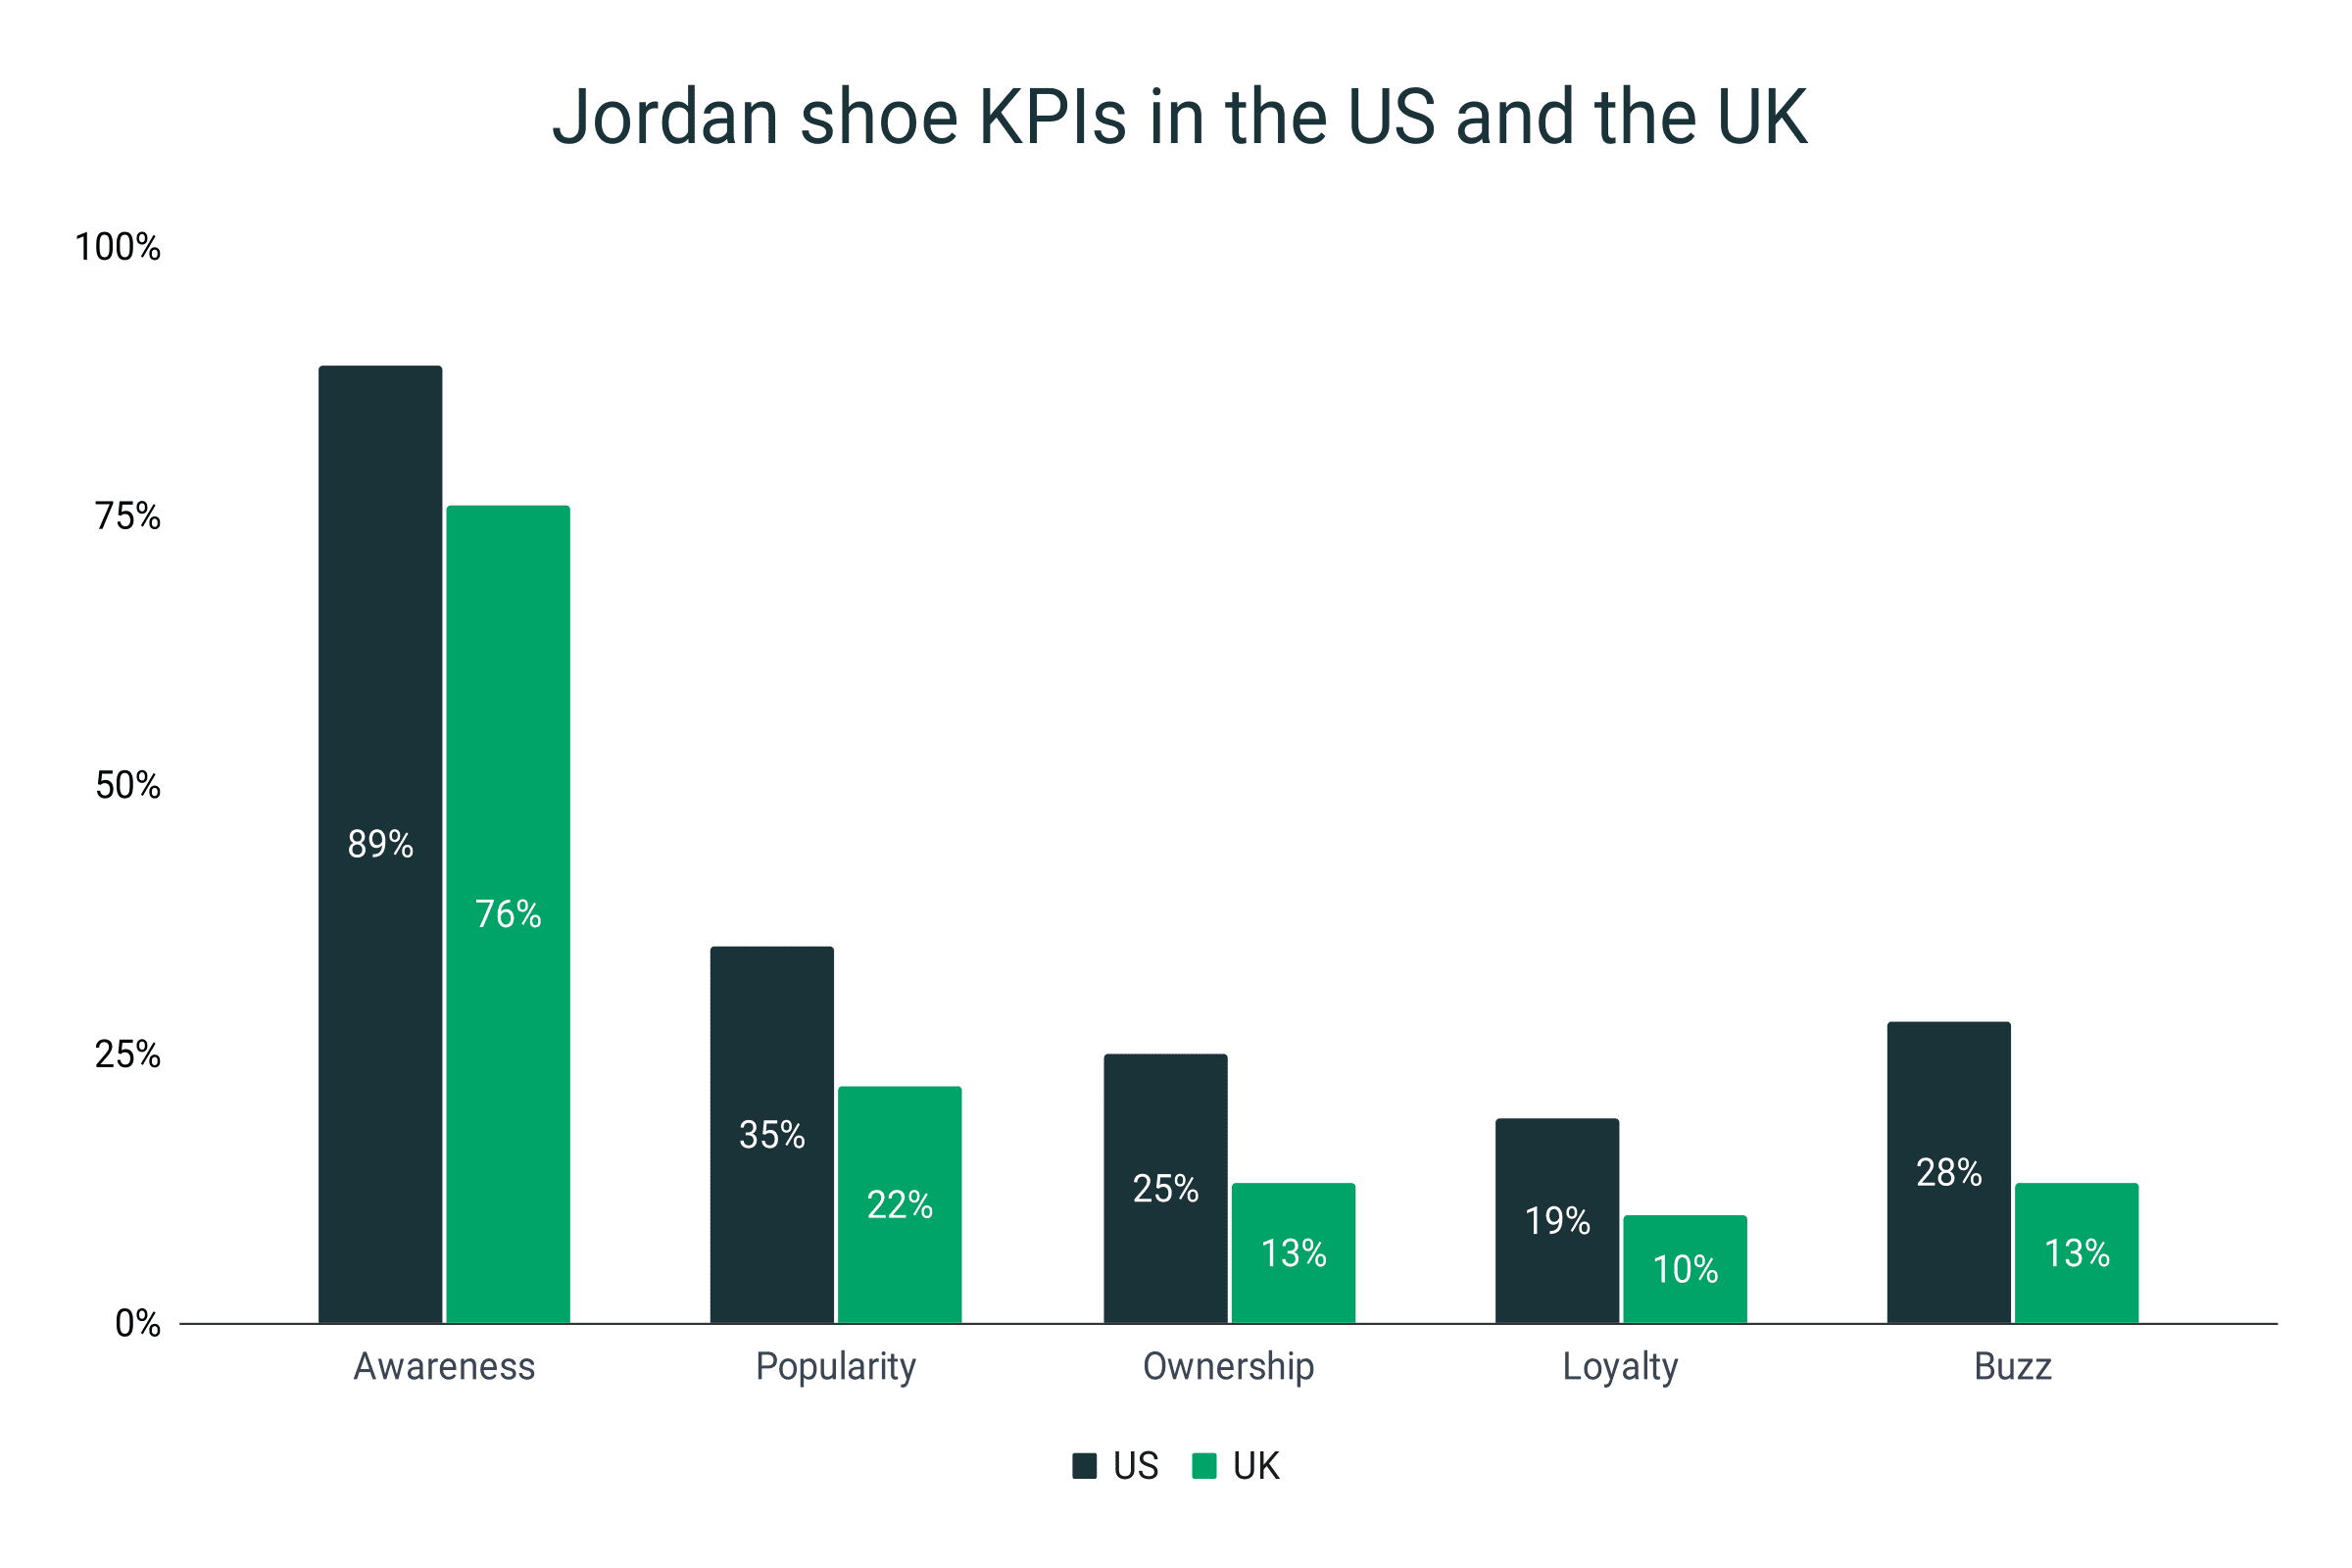
- Based on reports, 89% of the American consumer population is aware of the Jordan shoe brand.
- The popularity of the company is at 35%. Roughly 1 out of every 3 Americans agreed that Jordan shoes are popular.
- Regarding ownership, 25% of the population has at least one Jordan shoe. That is 1 out of every 4 Americans have bought and worn a Jordan.
- Meanwhile, the brand’s buzz is a healthy 28%.
- On the other hand, the brand awareness of Jordan in the United Kingdom fares at 76%.
- It is popular with only 22% of the British population.
- 13% or about 3 out of every 25 Brits own a Jordan shoe.
- However, only 10% of the population is loyal to the Jordan shoe brand.
Jordan shoe KPIs in the US and the UK
|
Key Performance Indicators (KPI) |
US |
UK |
|
Awareness |
89% |
76% |
|
Popularity |
35% |
22% |
|
Ownership |
25% |
13% |
|
Loyalty |
19% |
10% |
|
Buzz |
28% |
13% |
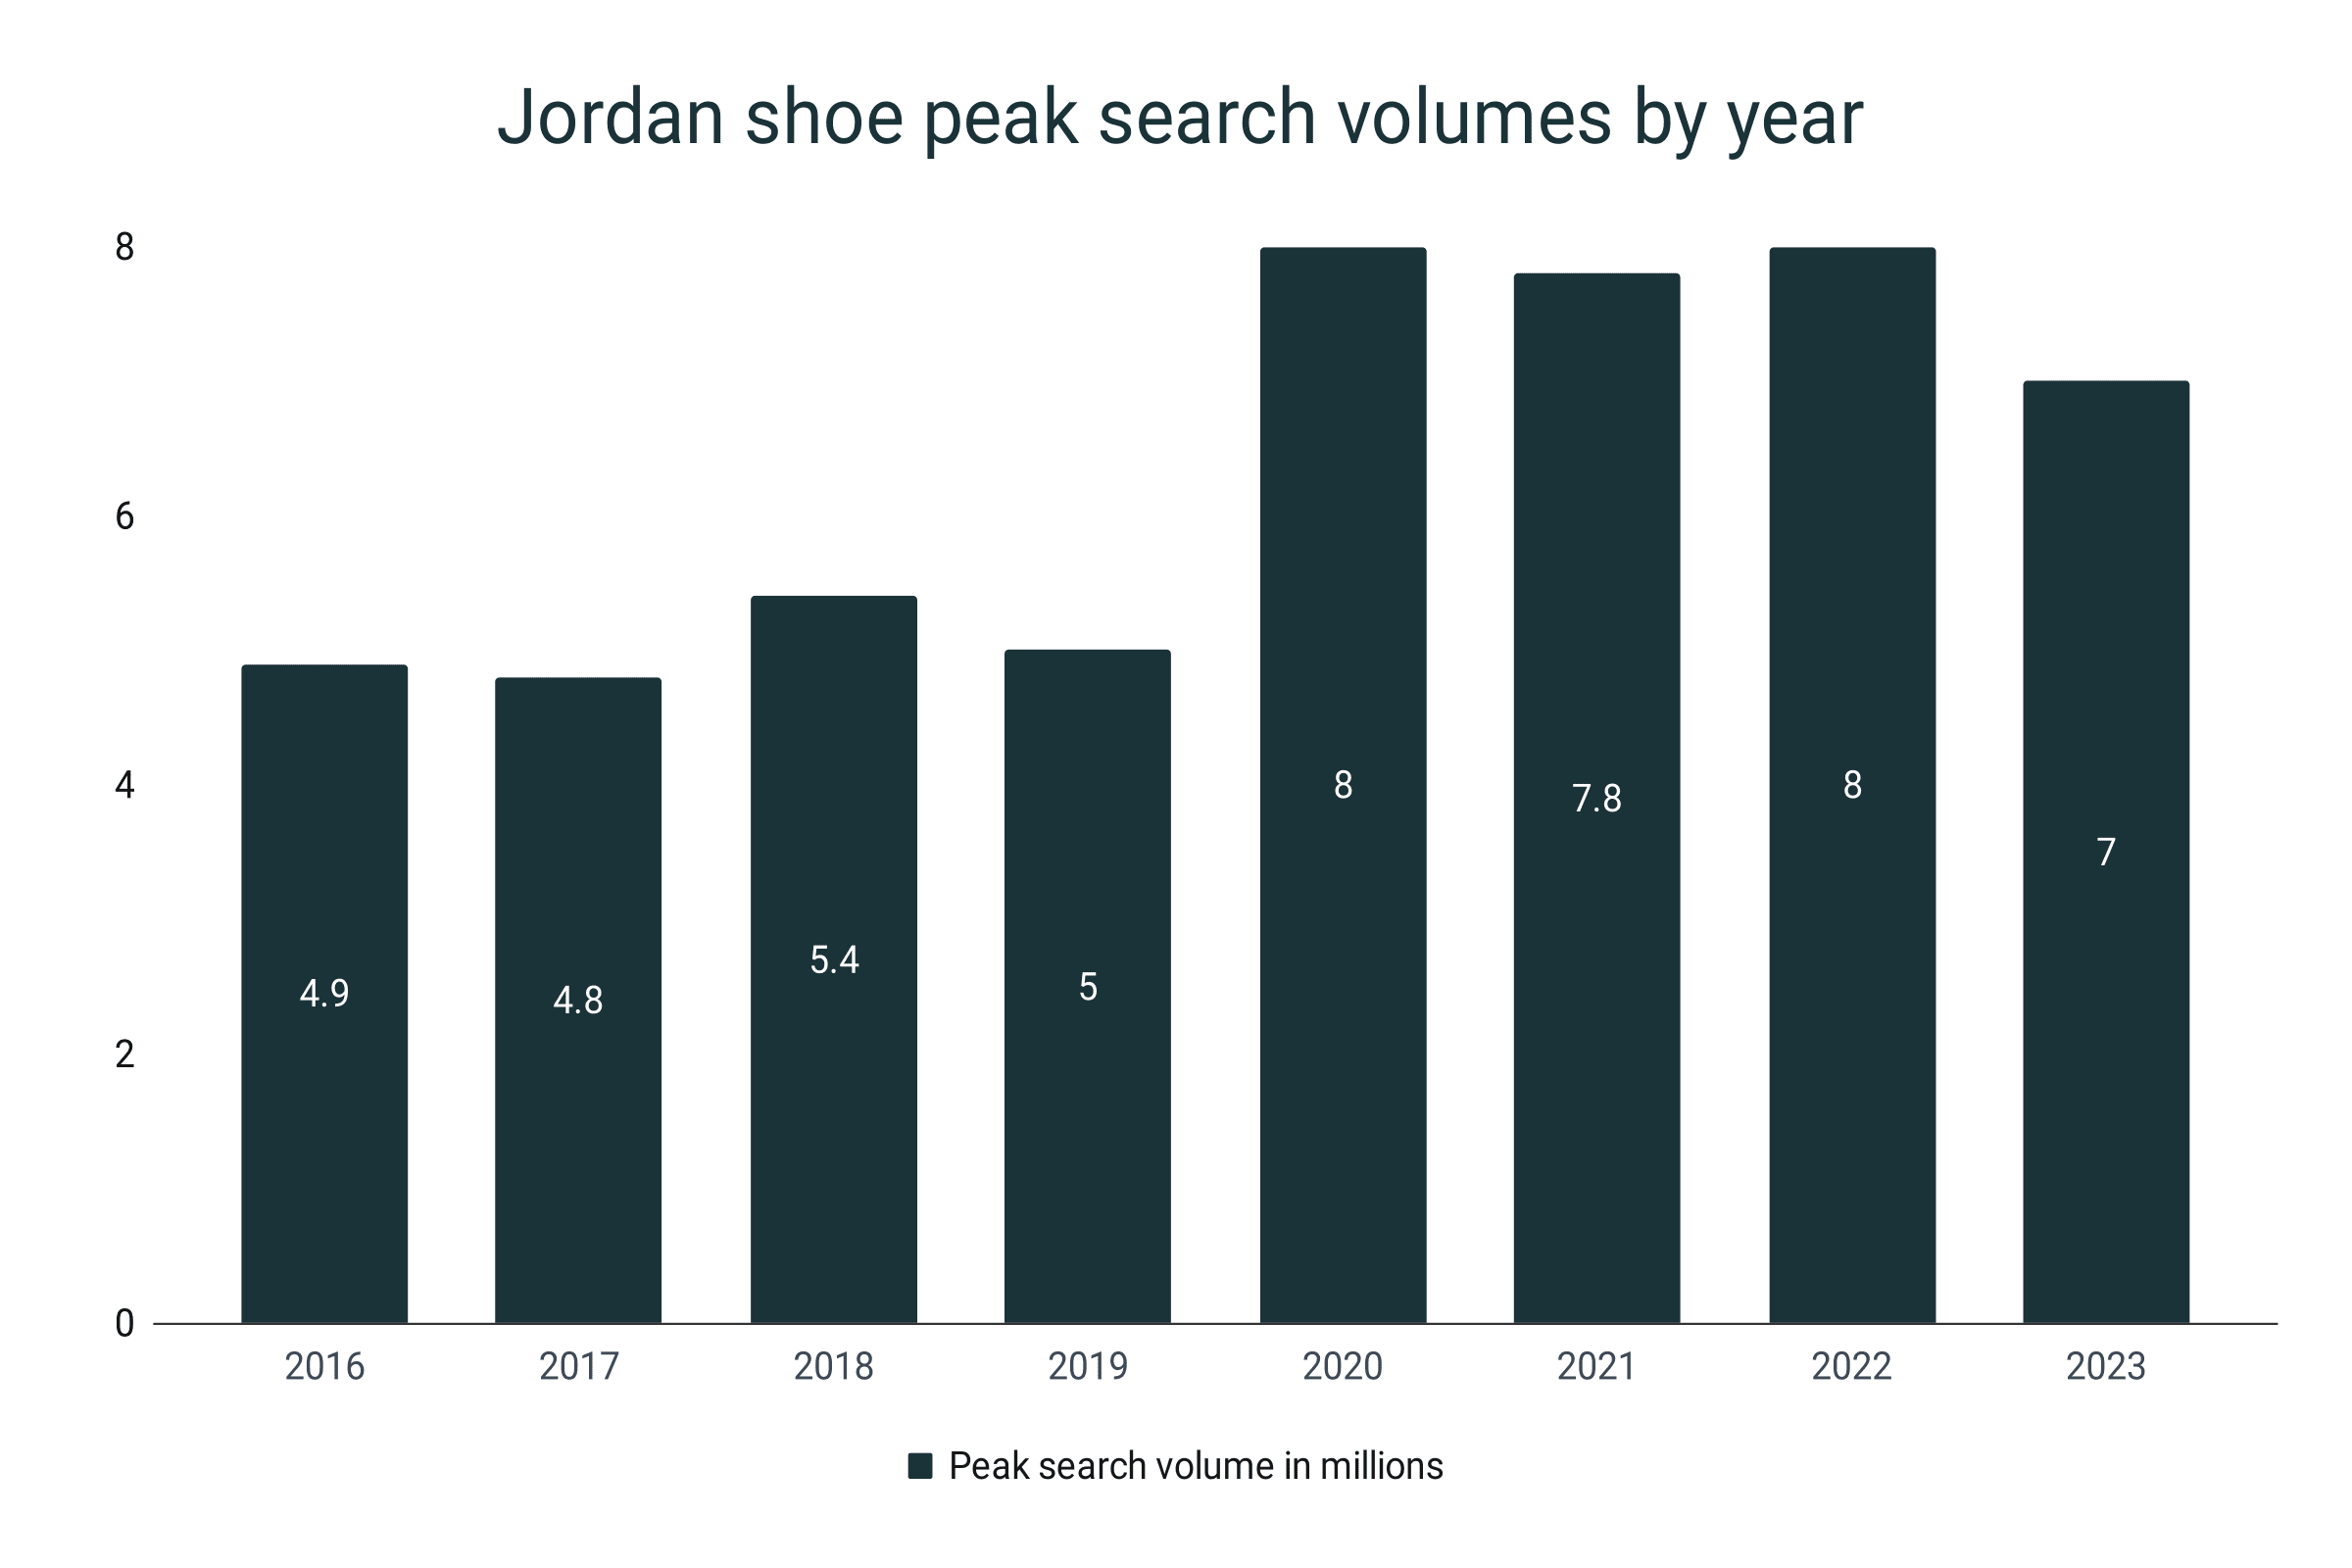
- Diving more into the popularity of the Jordan brand, an estimated 7 million global search volume is recorded as of February 2023.
- It is significantly lower compared to the peak search volume of 8 million last 2022.
- In 2017, the peak number of searches for the company is only 4.8 million.
- Looking at the bigger picture, from 2016 to 2023, the peak number of searches for the Jordan shoe brand has ballooned by 42.9%.
Jordan shoe peak search volumes by year
|
Year |
Peak search volume in millions |
|
2016 |
4.9 |
|
2017 |
4.8 |
|
2018 |
5.4 |
|
2019 |
5 |
|
2020 |
8 |
|
2021 |
7.8 |
|
2022 |
8 |
|
2023 |
7 |
Sources
https://s1.q4cdn.com/806093406/files/doc_downloads/2023/414759-1-_5_Nike-NPS-Combo_Form-10-K_WR.pdf
https://s1.q4cdn.com/806093406/files/doc_financials/2021/ar/386273(1)_20_Nike-Inc_Combo_WR.pdf
https://s1.q4cdn.com/806093406/files/doc_financials/2020/ar/363224(1)_16_Nike-Inc_Combo_WR_R2.pdf
https://s1.q4cdn.com/806093406/files/doc_financials/2019/ar/354352(1)_76_Nike-Inc_COMBO_WR_R1.pdf
https://s1.q4cdn.com/806093406/files/doc_financials/2018/ar/docs/nike-2018-form-10K.pdf
https://s1.q4cdn.com/806093406/files/doc_financials/2017/ar/docs/nike-2017-form-10K.pdf
https://fourweekmba.com/jordan-brand-revenue/
https://www.statista.com/statistics/888793/nikes-revenue-by-product-category-worldwide/
https://footwearnews.com/entertainment-news/awards/jordan-brand-of-the-year-award-fnaa-1203374852/
https://www.openpr.com/news/2067672/basketball-shoes-market-worth-observing-growth-nike-adidas
https://thesporting.blog/blog/the-rise-of-air-jordan
https://www.esquire.com/uk/style/g43495247/air-jordans/
https://shoeeffect.com/how-many-jordan-shoes-are-sold-per-year/
https://shoeeffect.com/how-long-does-jordan-shoes-last/
https://www.theshitbot.com/air-jordan-prices/
https://yis.org/betting-on-a-legend-the-story-of-nikes-air-jordan-shoe/
https://stockx.com/news/state-of-resale/
https://www.finder.com.au/air-jordan-sneakers-with-best-resale-value
https://publikationen.reutlingen-university.de/frontdoor/deliver/index/docId/2118/file/2118.pdf
https://stockx.com/news/breaking-bred-the-impact-of-jordans-signature-colorway/
https://stockx.com/news/en-gb/breaking-bred-the-impact-of-jordans-signature-colorway-en-gb/
https://www.parabuy.com/en/purchase-service/63-stockxcom.html
https://www.statista.com/chart/29726/most-expensive-sneakers-sold-at-auctions/
https://luxe.digital/lifestyle/style/most-expensive-sneakers/
https://www.gq.com/story/drake-new-jordans-gold-price
https://fourweekmba.com/nike-vs-jordan/
https://www.panaprium.com/blogs/i/jordan
https://directory.goodonyou.eco/brand/jordan
https://www.statista.com/insights/consumer/brand-profiles/3/8/jordan/united-states/#contentBox1
https://boardroom.tv/sneaker-stats-wnba-nike/
https://legitcheck.app/stats/air-jordan/
https://frontofficesports.com/newsletter/jordan-nike-hit-new-heights-in-2022/
https://ballershoesdb.com/blog/popular-shoes-and-brands-worn-by-players-around-the-nba-2019/
https://ballershoesdb.com/blog/most-popular-shoes-brands-nba-players-2023/
