Estado de los maratones en EEUU (2025)
En 2019 presentamos el informe original The State of Running 2019, que se dio a conocer junto con World Athletics en China.
Este es nuestro primer seguimiento en 6 años.
Para este informe de 2025 hemos reducido el enfoque para analizar únicamente las carreras en Estados Unidos y exclusivamente la distancia de maratón.
Conclusiones clave
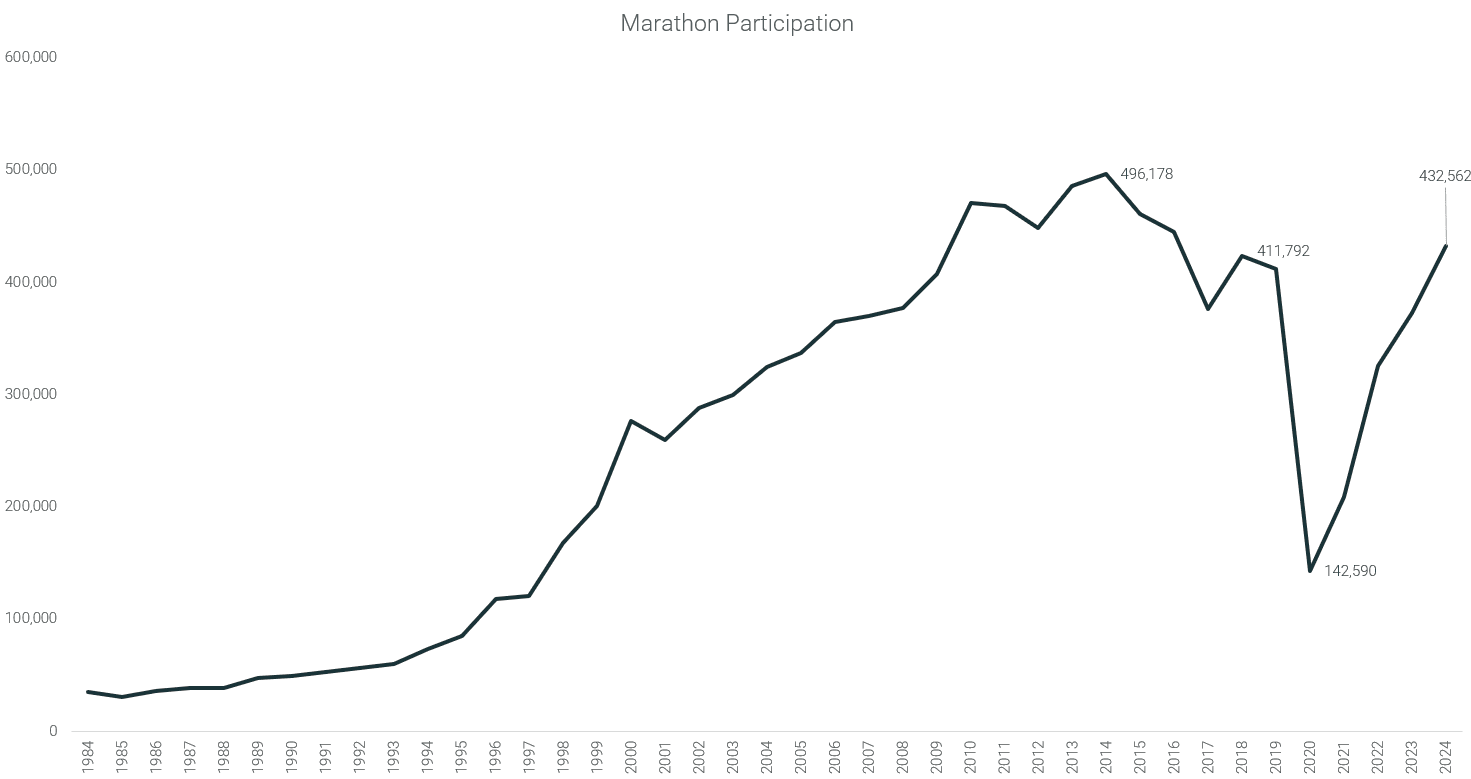
- La participación en maratón alcanzó su punto máximo en 2014 con 496.178 corredores. Durante los 4 años siguientes, la participación disminuyó lentamente hasta 411.792, una caída anual del 4,4%.
- La COVID-19 hizo que correr maratones fuese (casi) inaccesible, con solo 142.590 participantes en 2020 (-65%), incluyendo algunos periodos sin restricciones.
- Cuatro años después, la participación ha vuelto a niveles superiores a los previos a la pandemia, con 432.562 corredores en 2024, un aumento del 5,0% y una tendencia positiva que queda solo un 12,8% por debajo del máximo histórico de 2014.
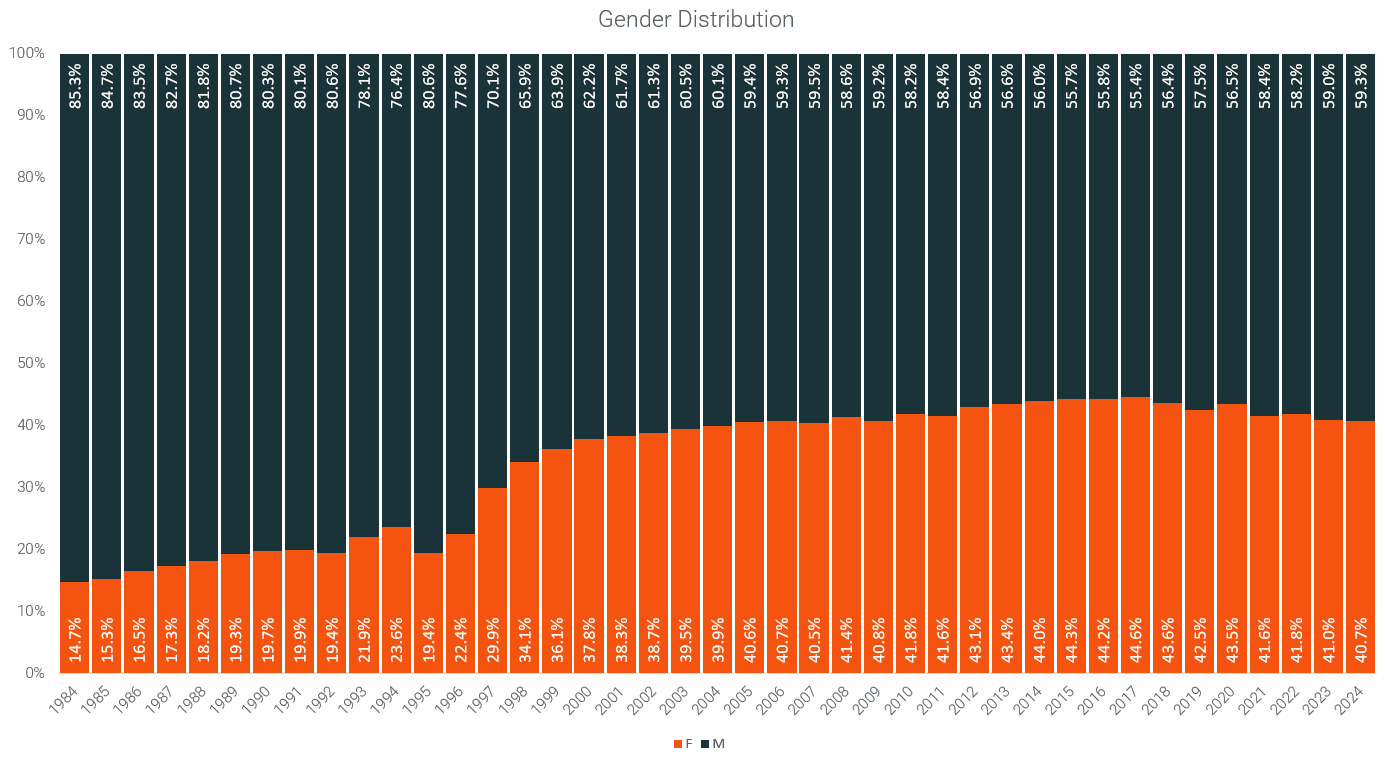
- Desde la primera mujer que corrió un maratón oficialmente (1967), el porcentaje femenino batió récords cada año hasta 2017, cuando alcanzó el 47%. Desde entonces, esta proporción ha ido disminuyendo de forma constante y en 2024 solo el 41% de los participantes fueron mujeres.
- Los tiempos de llegada están mejorando en ambos géneros y en todos los grupos de edad por primera vez en décadas.
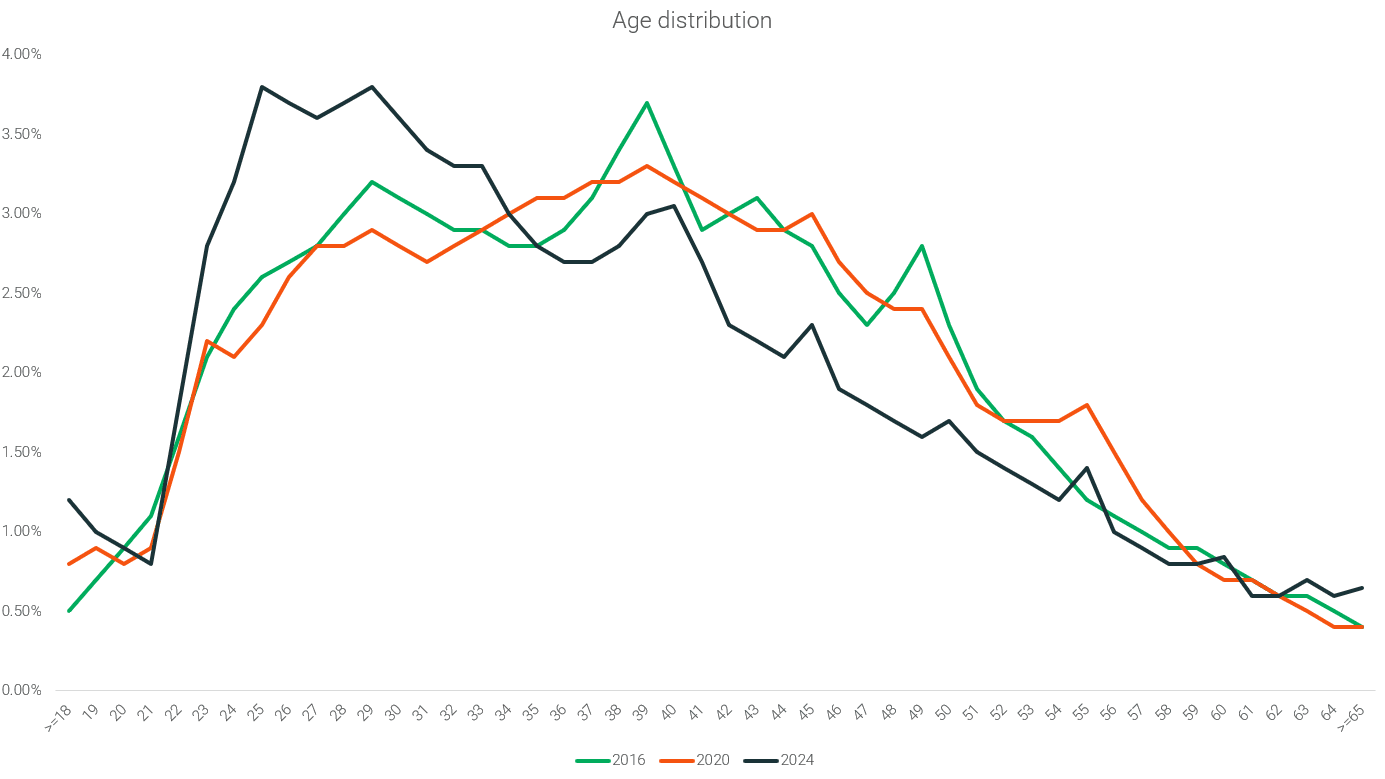
- Los grupos de edad menores de 25 años han crecido de forma considerable como porcentaje del total (del 9,2% en 2016 al 12,1% en 2024).
Datos y metodología
- Los datos cubren aproximadamente el 97% de los resultados totales de maratones en Estados Unidos.
- Se excluyeron los corredores de élite.
- Se excluyeron los resultados de gente andando, los participantes que corren por ONGs o «charity», las carreras de obstáculos y otros eventos de running no tradicionales.
- El estudio se realizó en colaboración con World Athletics en 2025.
- La recolección de datos se llevó a cabo a través de bases de datos de resultados de carreras, así como de competiciones individuales de World Athletics.
- Computamos 10.482.628 resultados de 6.352 eventos.
- Desde 1984 hasta 2025.
Participación en maratones en EE. UU.
En general
A partir del gráfico de participación en maratones de Estados Unidos, concluimos que el running ha vuelto a crecer desde la pandemia, en contraste con la tendencia que veníamos observando desde 2014. La participación en maratones en EE. UU. es un 5% superior a los niveles anteriores a la pandemia.
Participación por género
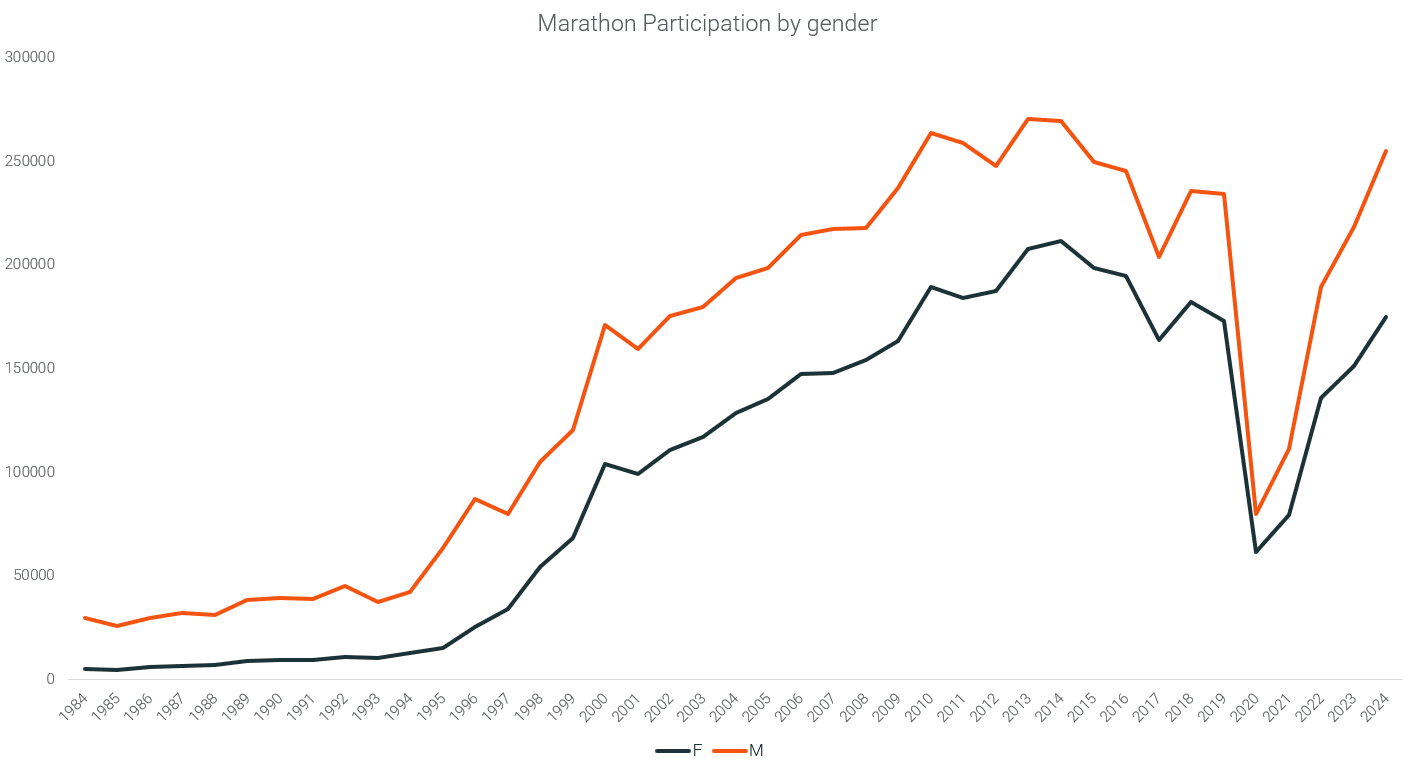
Al observar las cifras de participación por género, vemos que la participación masculina ha aumentado en una proporción mayor que la femenina. En 2019 hubo 234.346 hombres participantes, y en 2024 fueron 255.033, lo que supone un incremento del 8,8%. En cuanto a las mujeres, en 2019 participaron 173.207, y en 2024 fueron 174.875, un aumento de solo el 1%.
Aunque la participación femenina ha registrado un aumento menor, las mujeres representan ahora solo el 41% en 2024, frente al 45% alcanzado en 2017 (su máximo histórico).
Participación por edad
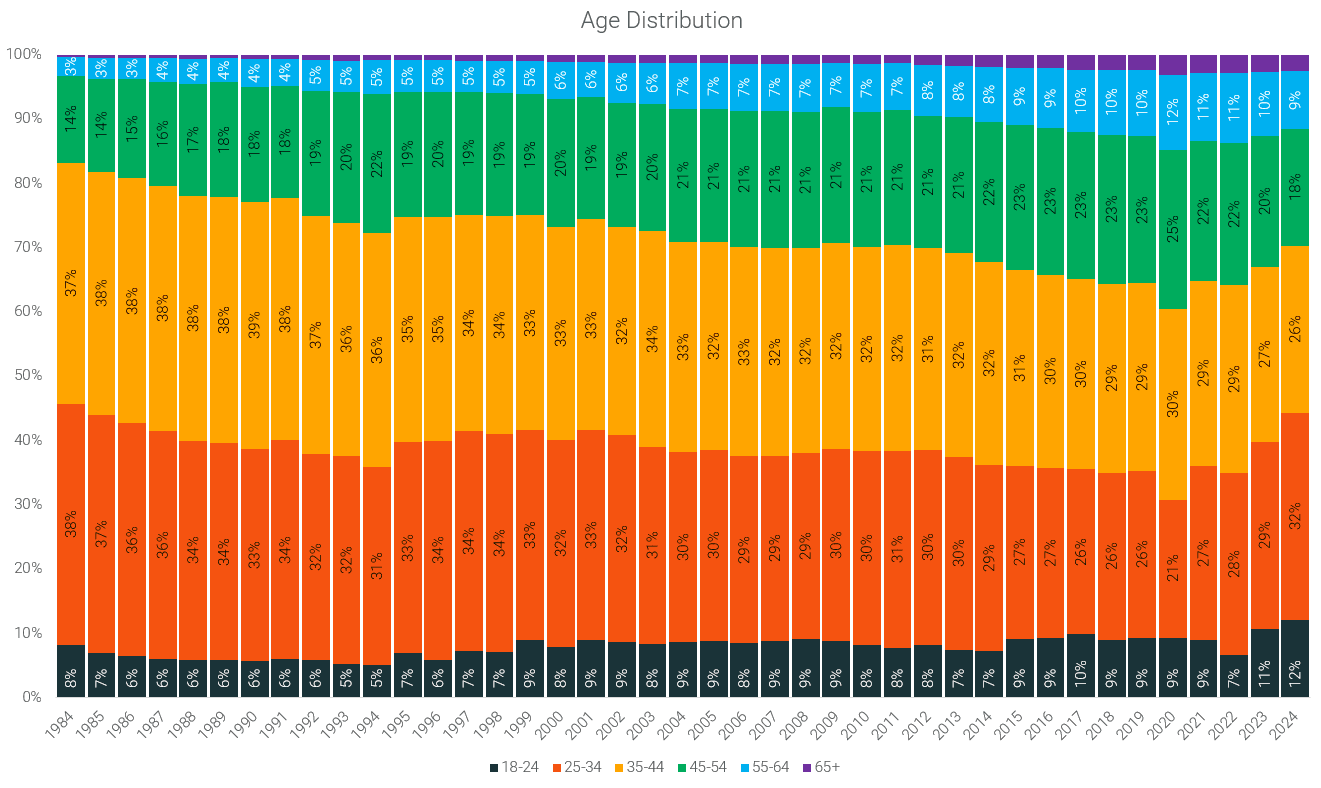
La proporción de corredores de maratón mayores de 45 años ha aumentado, mientras que el grupo de edad de 35 a 44 años ha disminuido.
Participación según el tamaño del evento
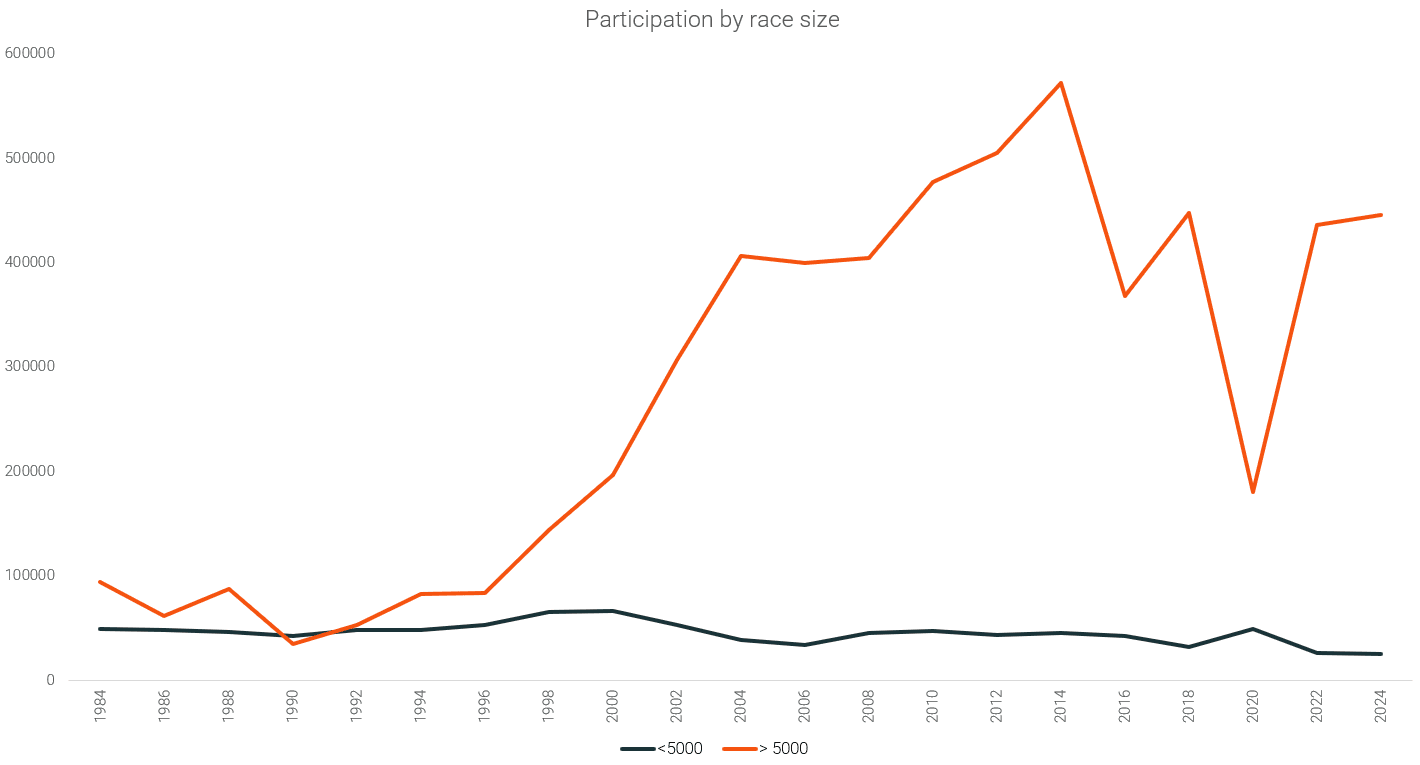
Los corredores prefieren mayoritariamente las grandes carreras con más de 5.000 participantes. Solo durante el periodo de la COVID-19 las carreras pequeñas llegaron a representar una proporción significativa del total, pero desde entonces su peso ha vuelto a disminuir, lo que ha supuesto un retroceso para los organizadores de pruebas de menor tamaño.
Tiempos
En general
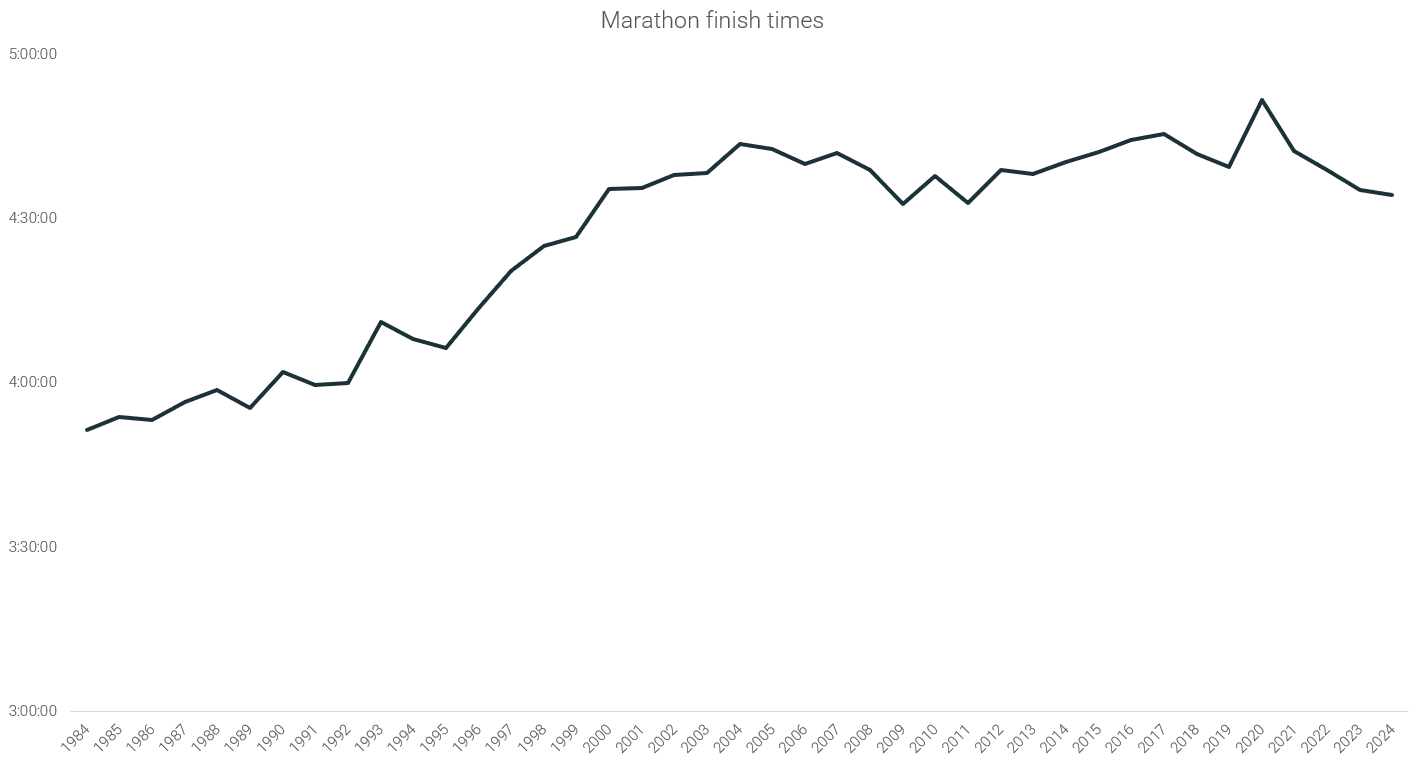
En nuestra investigación de 2019, observamos una tendencia de los estadounidenses a correr más lento.
Ahora, por primera vez, podemos concluir que los corredores de maratón están corriendo más rápido. El tiempo medio de llegada en 2019 era de 4:39 horas y en 2024 es de 4:34 horas, lo que supone una mejora del 1,9%.
Durante la COVID, los tiempos de llegada fueron muy lentos. Las razones de esto pueden ser variopintas.
Tiempos de llegada por género
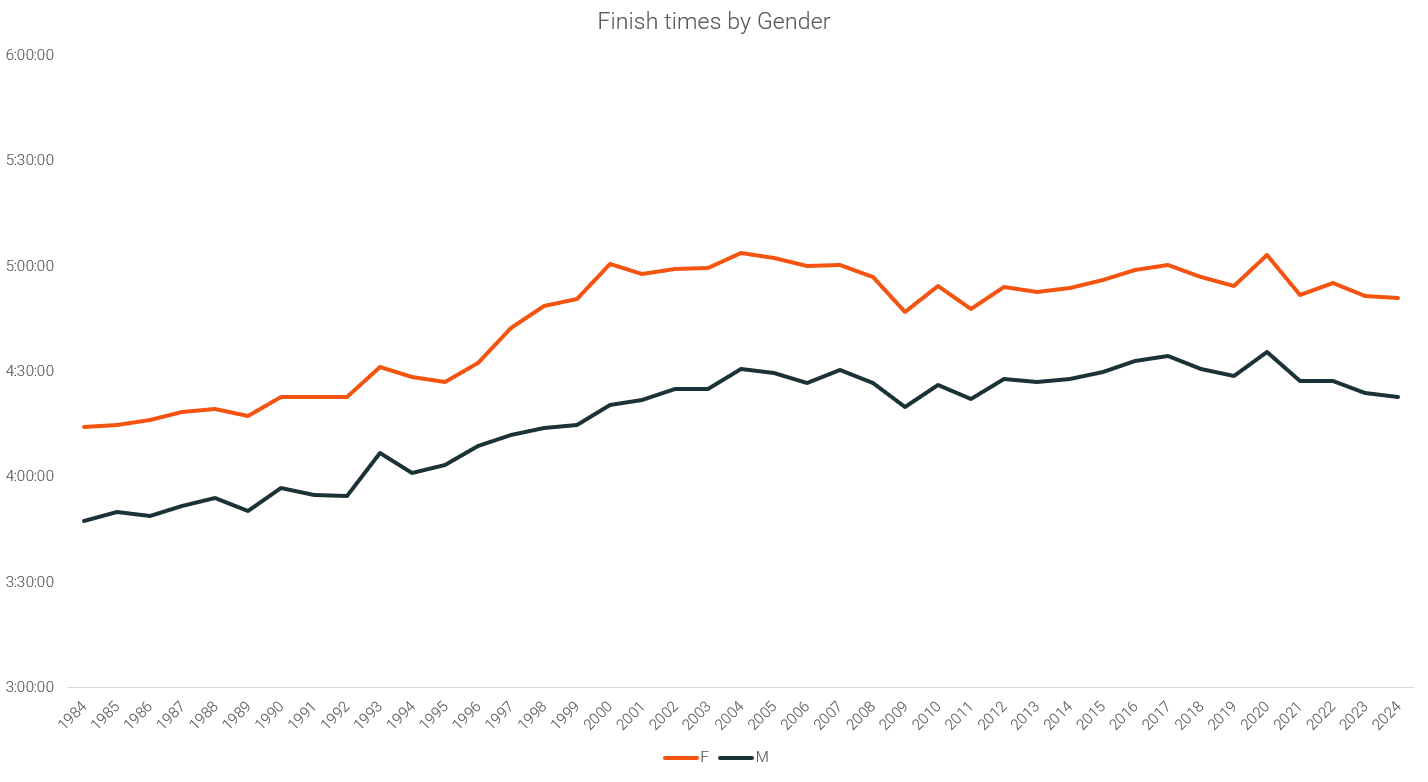
Observamos una tendencia similar en los tiempos de llegada por género. Los hombres tenían un tiempo medio de 4:28 horas en 2019 y de 4:24 horas en 2024, lo que supone una mejora del 2,2%. Las mujeres registraron un tiempo medio de 4:54 horas en 2019 y de 4:51 horas en 2024, un 1,1% más rápido.
Tiempo de llegada por edad
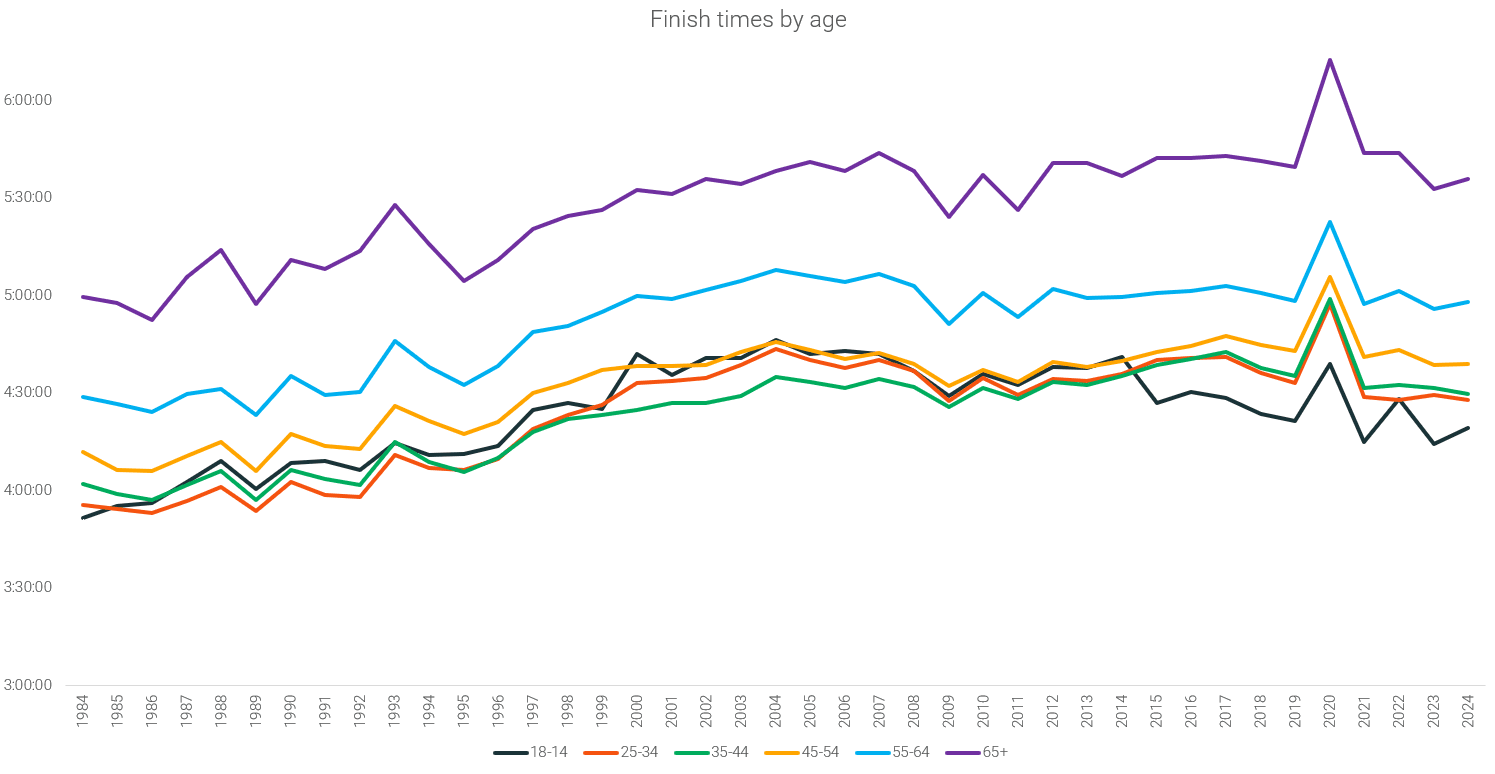
Llegamos a una conclusión similar al observar los tiempos de llegada de los diferentes grupos de edad. Todos ellos han mejorado ligeramente desde 2019:
- Para edades de 18 a 24 años: de 4:21 a 4:19 horas (mejora del 0,9%)
- Para edades de 25 a 34 años: de 4:33 a 4:27 horas (mejora del 1,9%)
- Para edades de 35 a 44 años: de 4:35 a 4:29 horas (mejora del 2%)
- Para edades de 45 a 54 años: de 4:42 a 4:38 horas (mejora del 1,4%)
- Para edades de 55 a 64 años: de 4:58:28 a 4:58:04 horas (mejora del 0,1%)
- Para mayores de 65 años: de 5:39 a 5:35 horas (mejora del 1,1%)
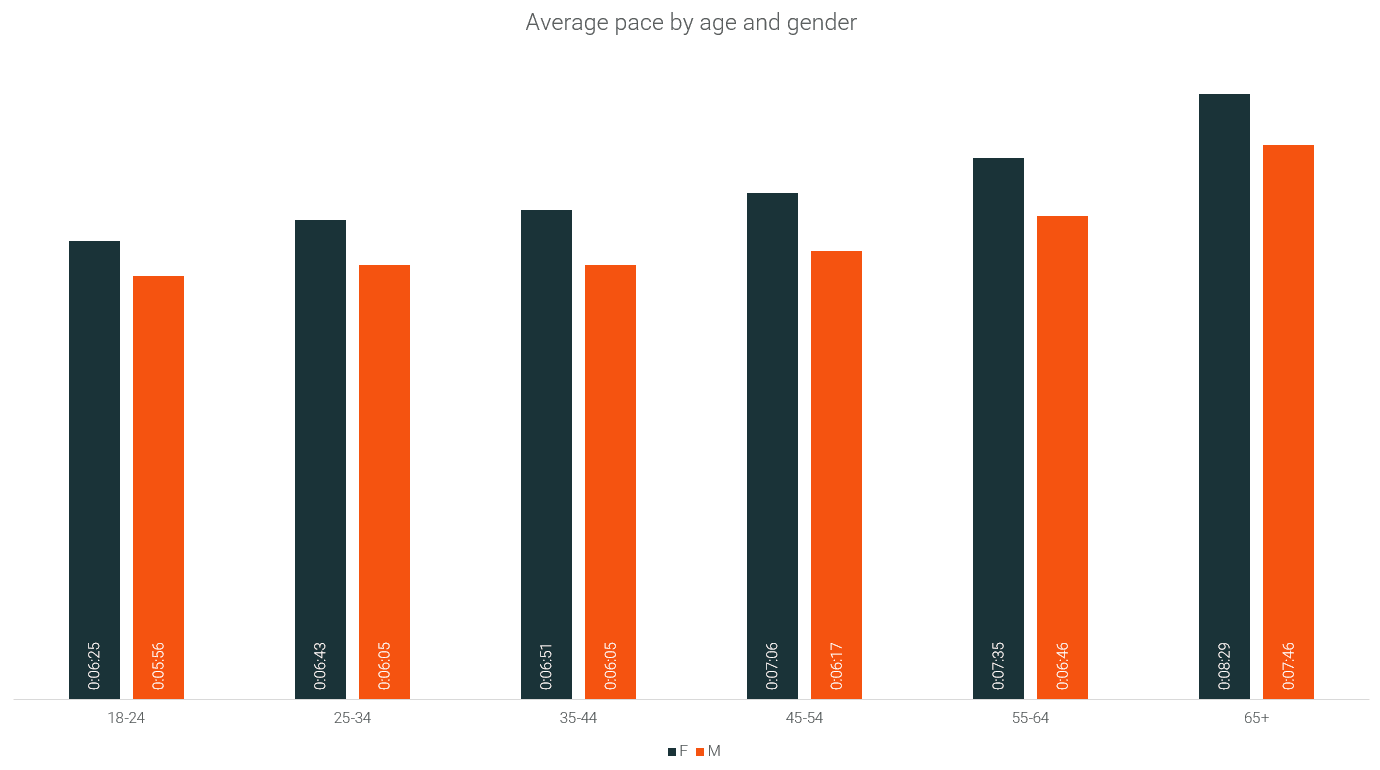
Aquí tienes el ritmo combinado por género y edad.
Distribución por edad
Al observar la distribución media de participantes en 2016, 2020 y 2024, vemos que ha cambiado. Las distribuciones de 2016 y 2020 son similares y se aproximan a una forma normal, pero en 2024 aparece una asimetría hacia la izquierda y una mayor presencia de participantes jóvenes.
También observamos pequeños picos de participación cuando los corredores cumplen una edad en particular como los 40 o los 50, por lo que algunas personas utilizan el maratón como una forma de celebrar un hito personal.
