Cycling Statistics
Top cycling statistics
- Over 51 million people in the US cycle each year.
- Men dominated cycling. For every 3 male riders, there is just 1 female cyclist.
- There are 1 billion bicycles in use around the world.
- China is the biggest producer and exporter of bikes. With 500 million bikes, they also have the most units in their country.
- 58% of the Netherlands population commute using their bikes, making the Netherlands the number one country that rides bikes the most.
- About 7% of all urban trips worldwide are done by bicycle.
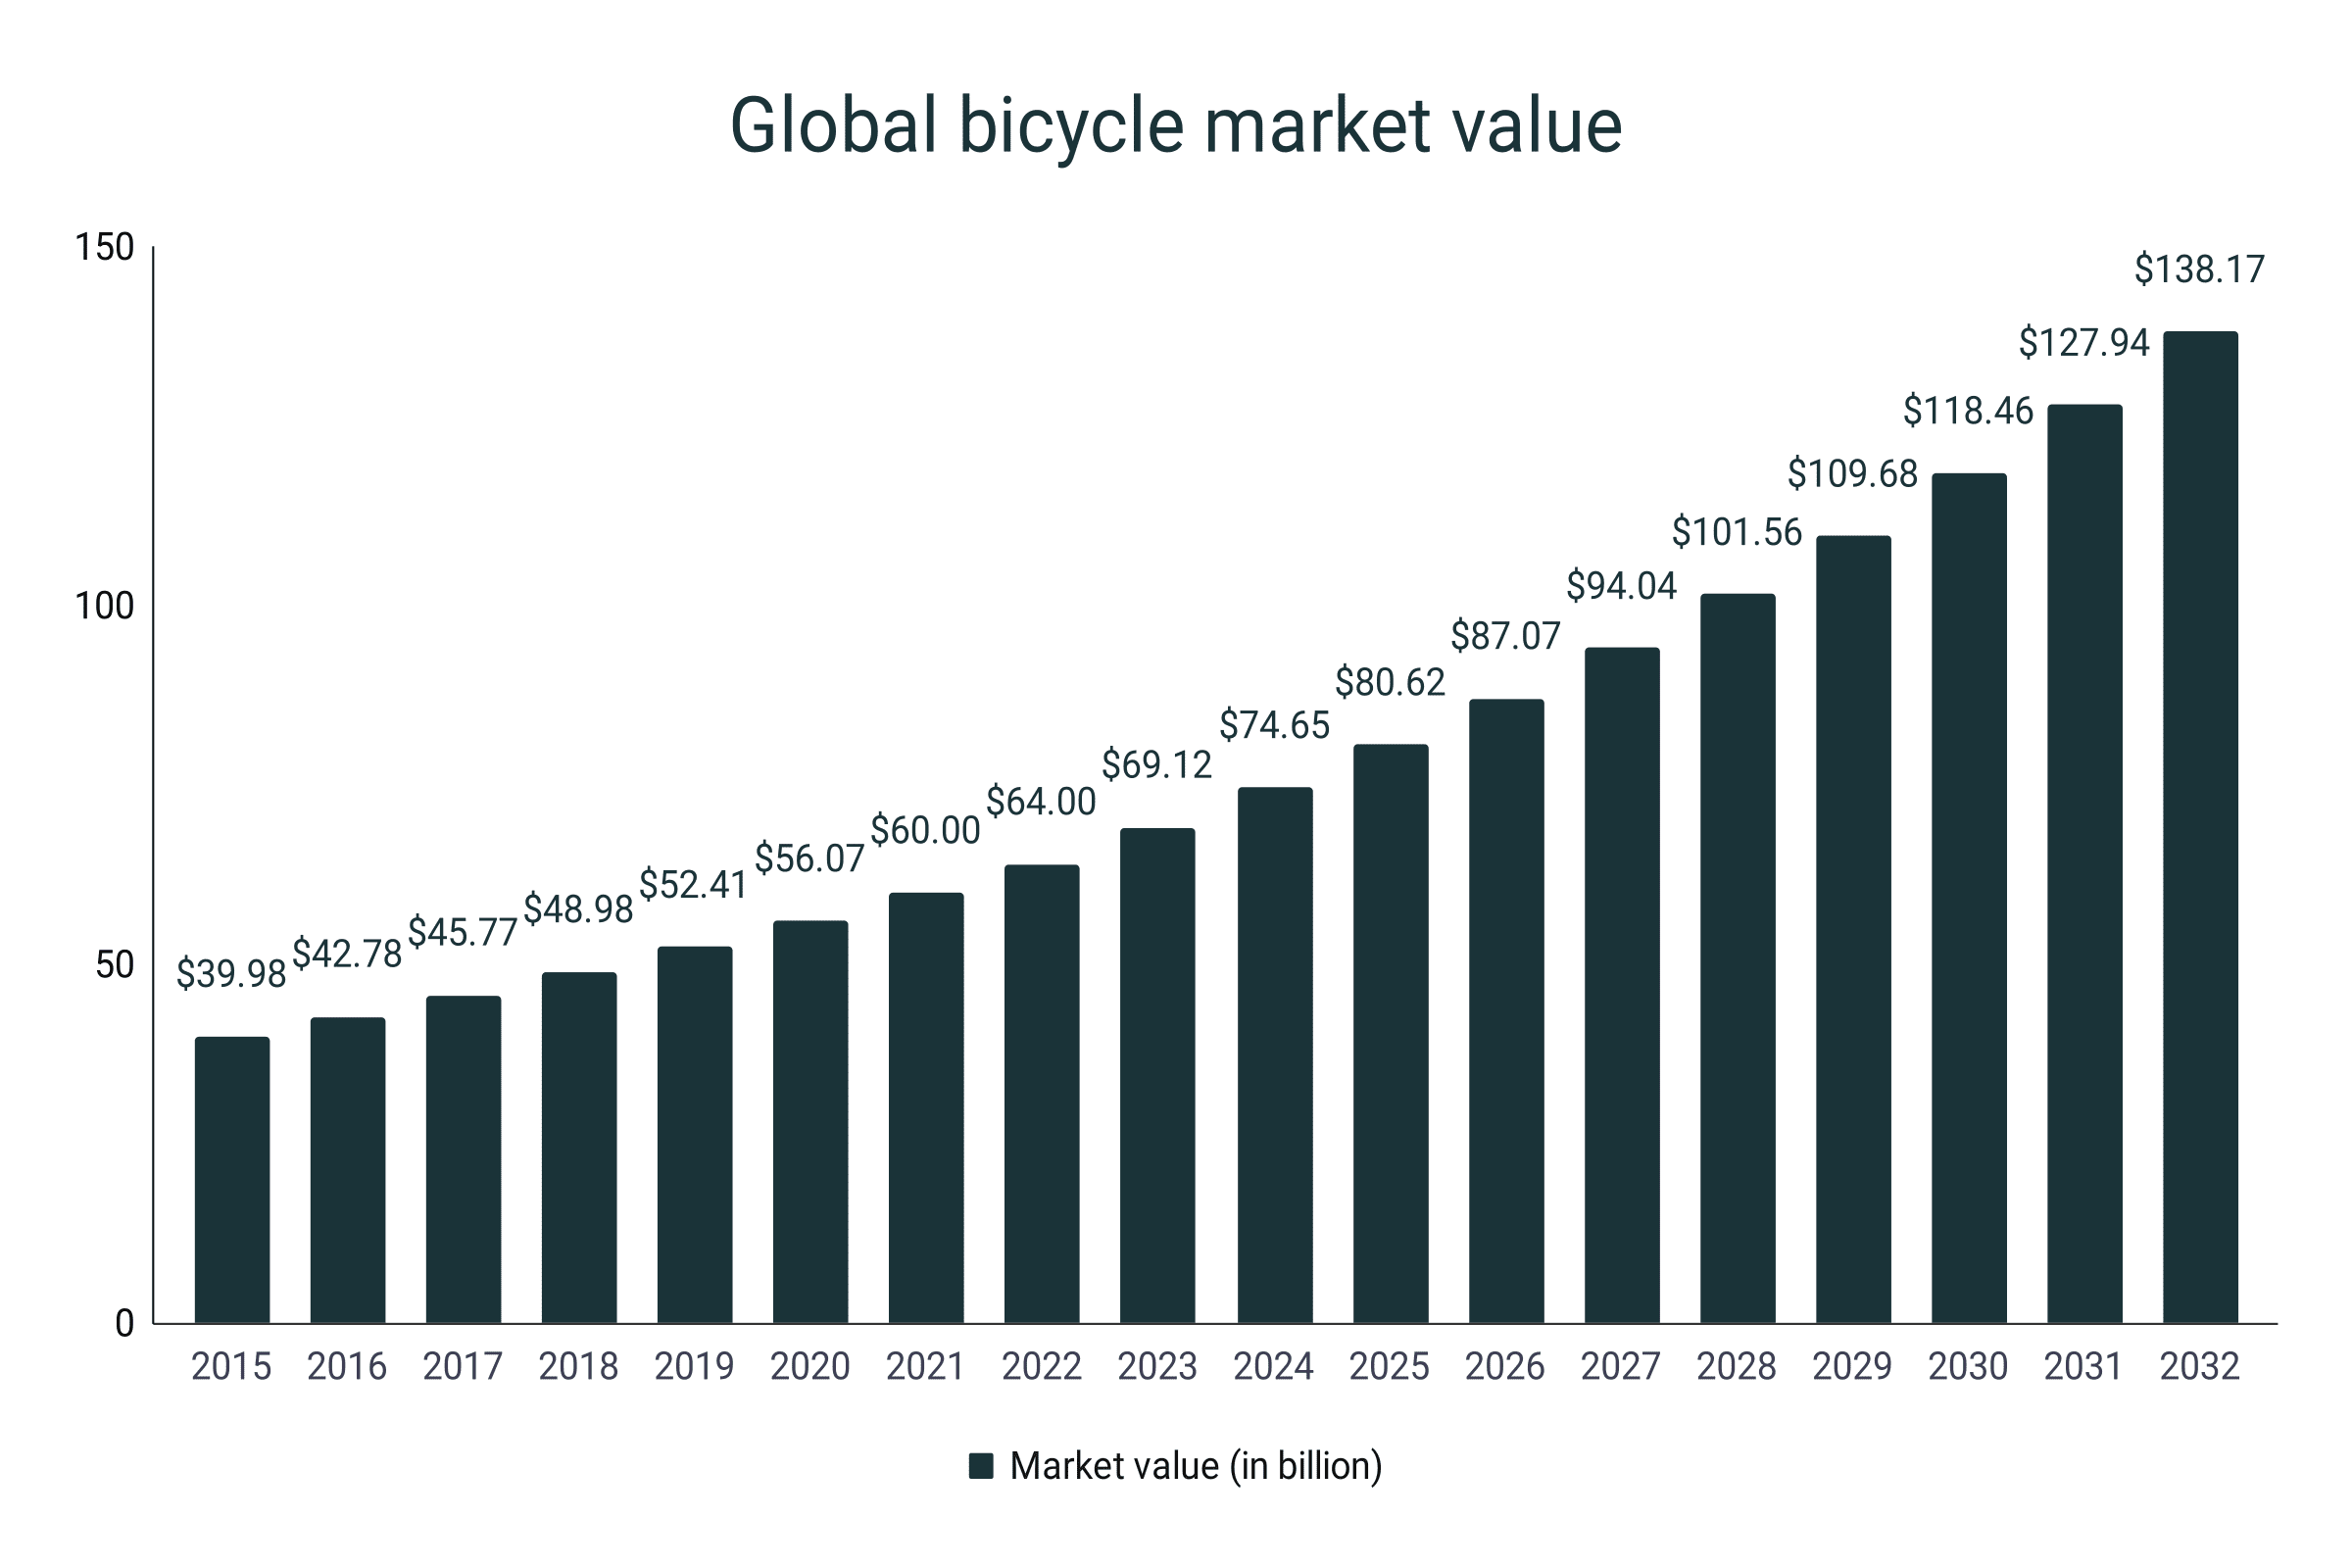
- The global industry of bicycles is estimated to be worth $69 billion in 2023.
- By 2032, the bicycle market value is predicted to grow to $138 billion.
- High-quality bikes with high-end parts cost more than $1,200, on average.
- Lower-end bikes, on the other hand, can be purchased at prices lower than $250.
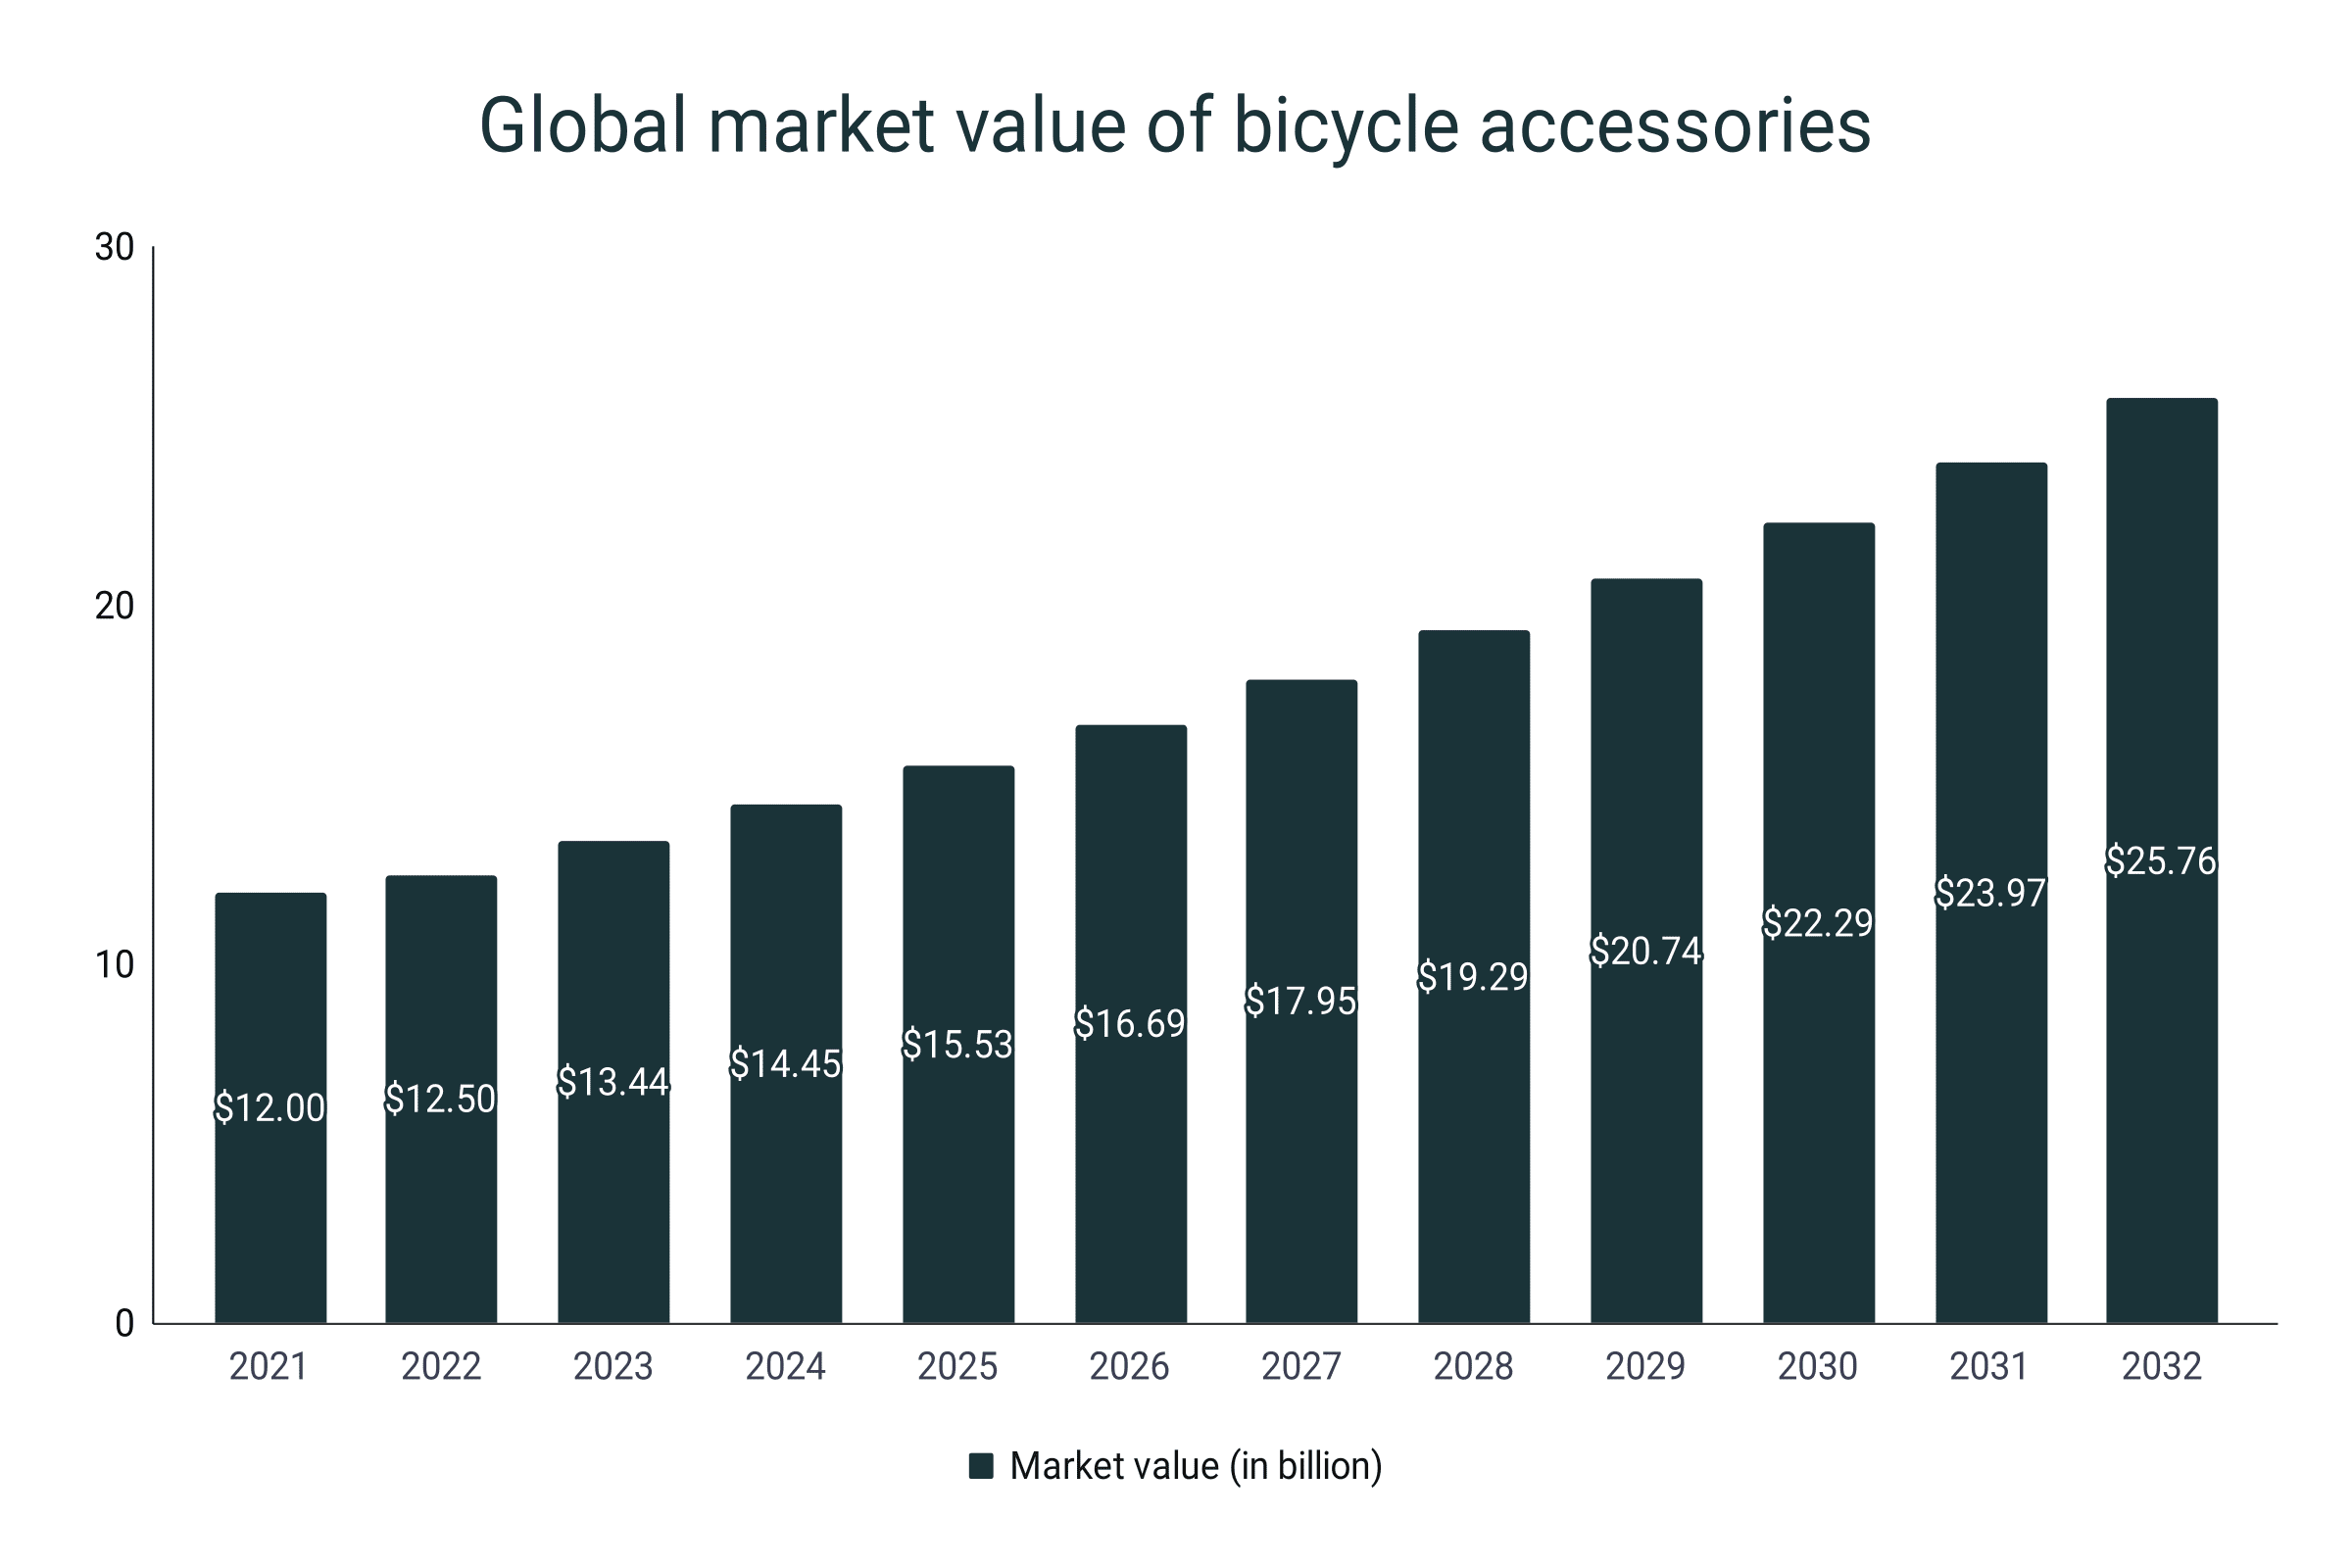
- The bicycle accessories market size was valued at $12.5 billion in 2022.
- By 2030, the forecasted value of the industry of bicycle gears and components is $25 billion.
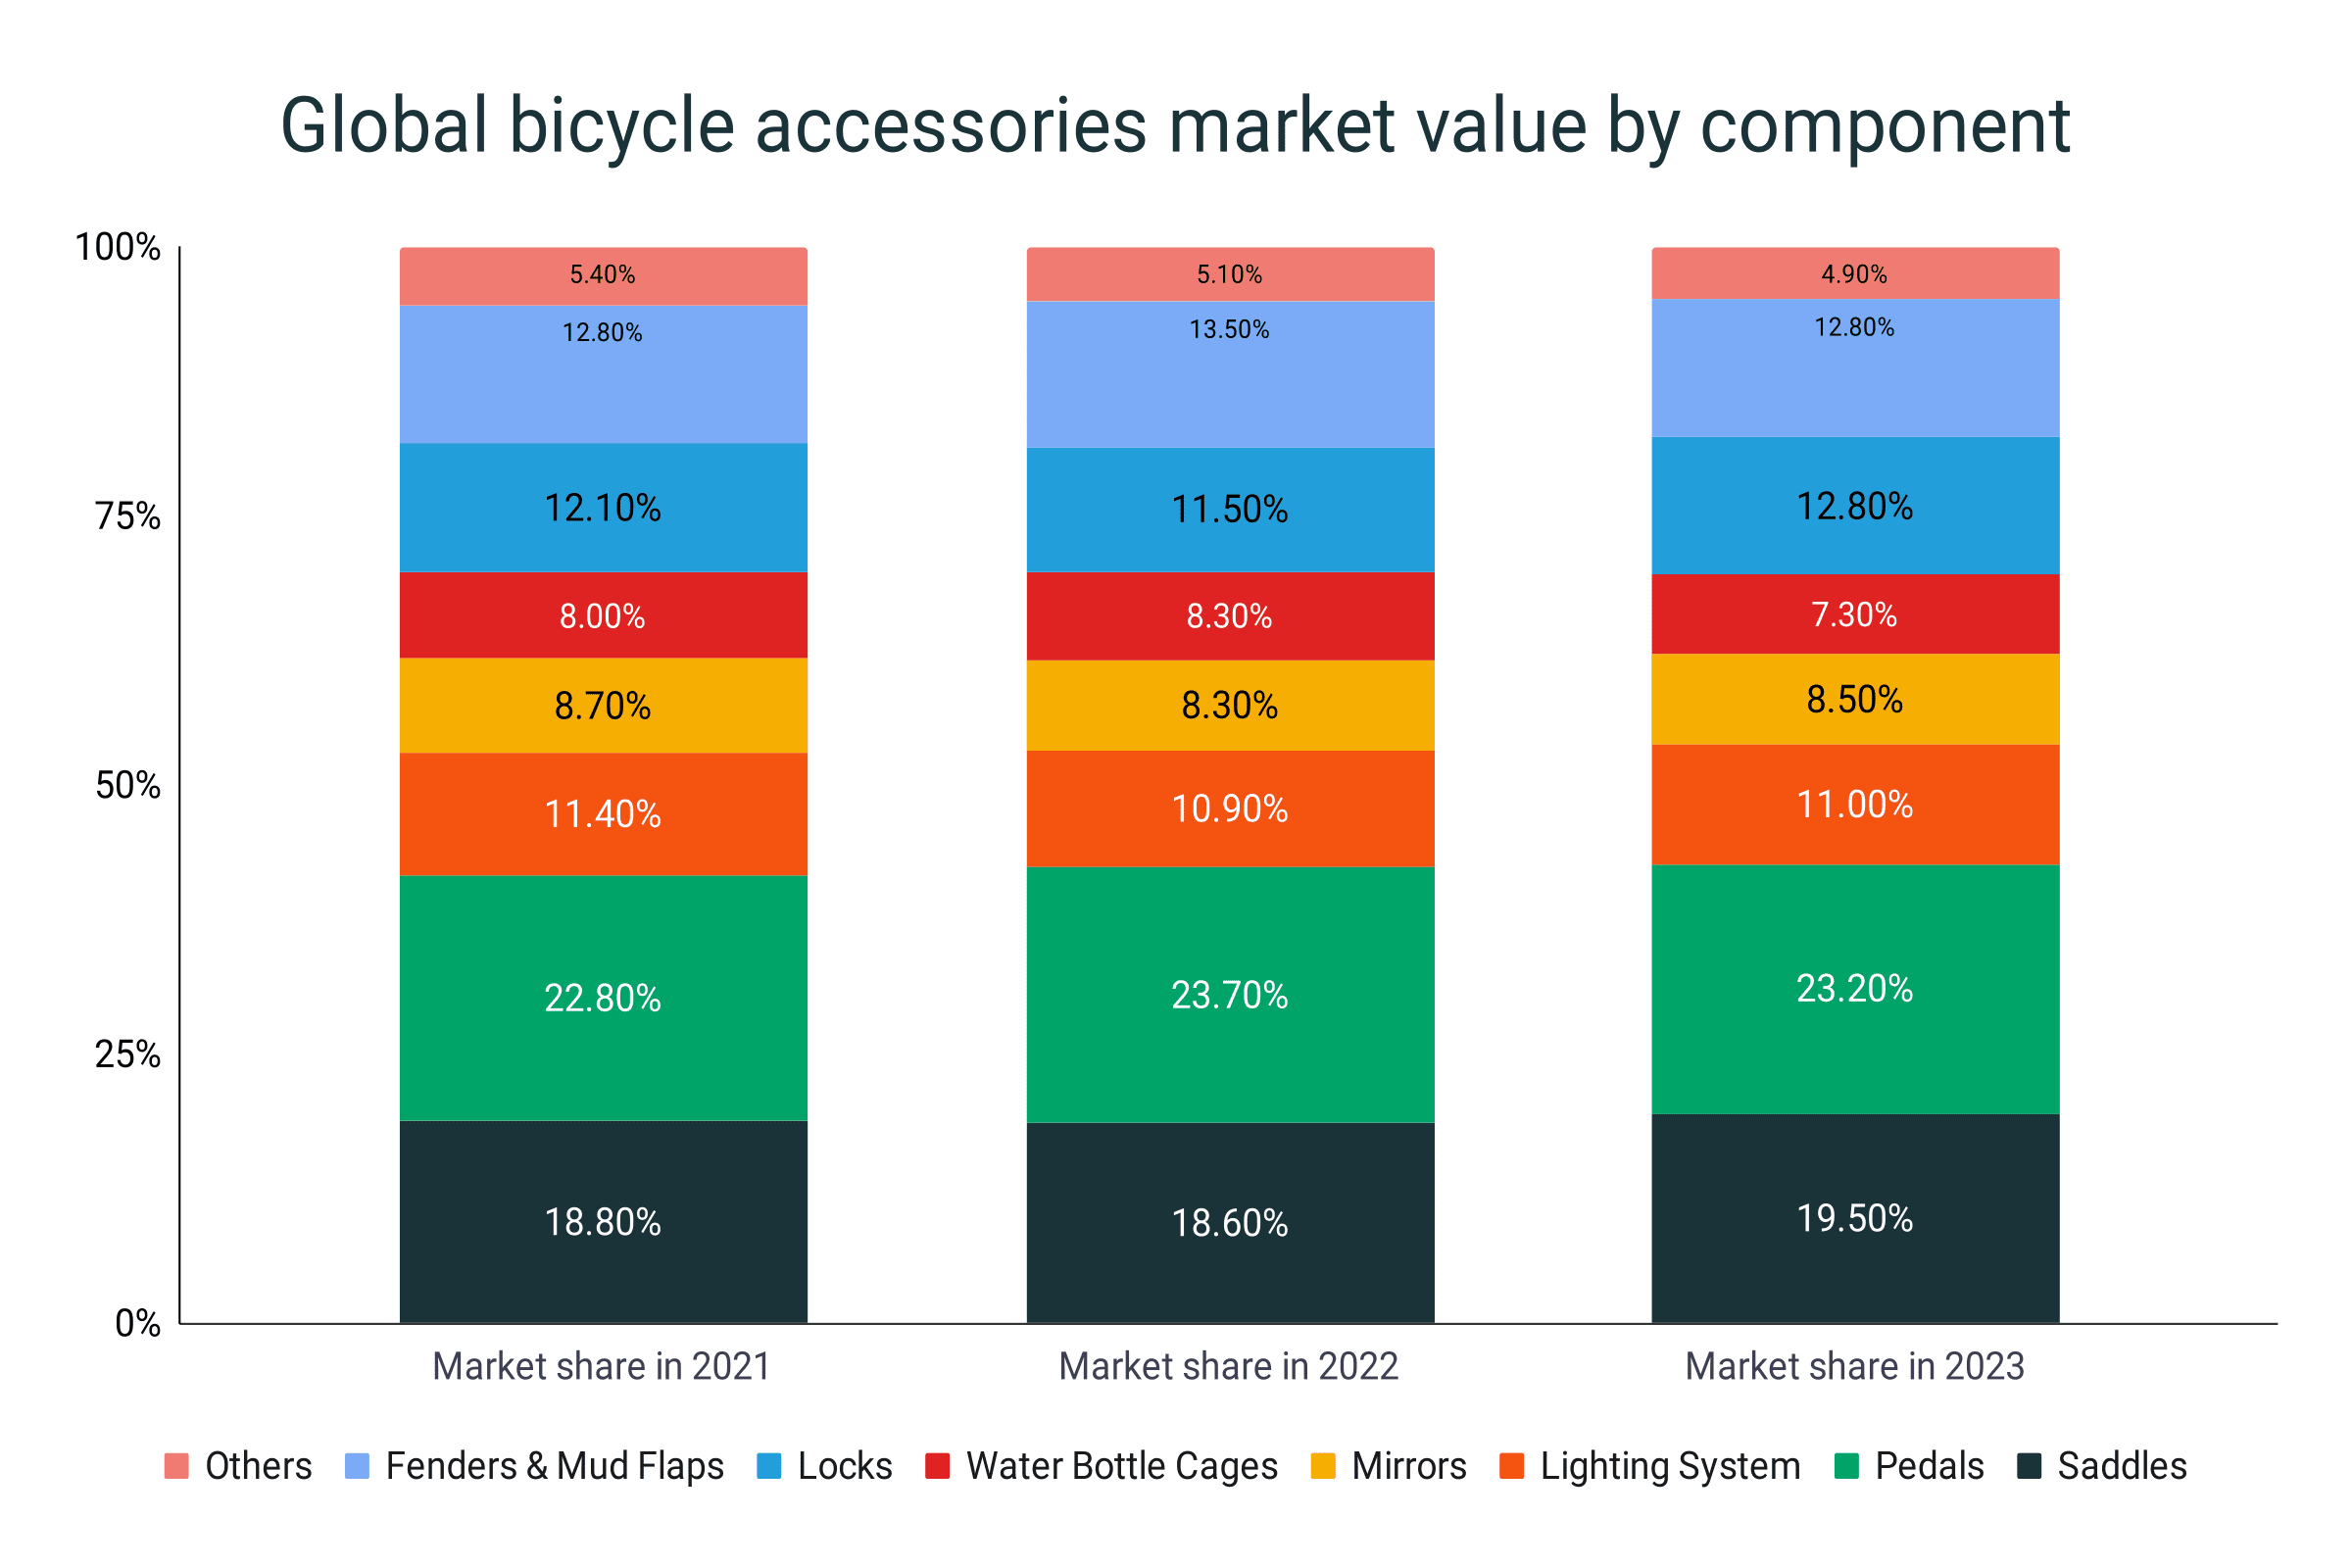
- The components that dominated the overall market in 2022 are the saddles, with almost 24% of the market allocated.
- The components with the least market share are mirrors and water bottle cages, each covering 8.3% of the market.
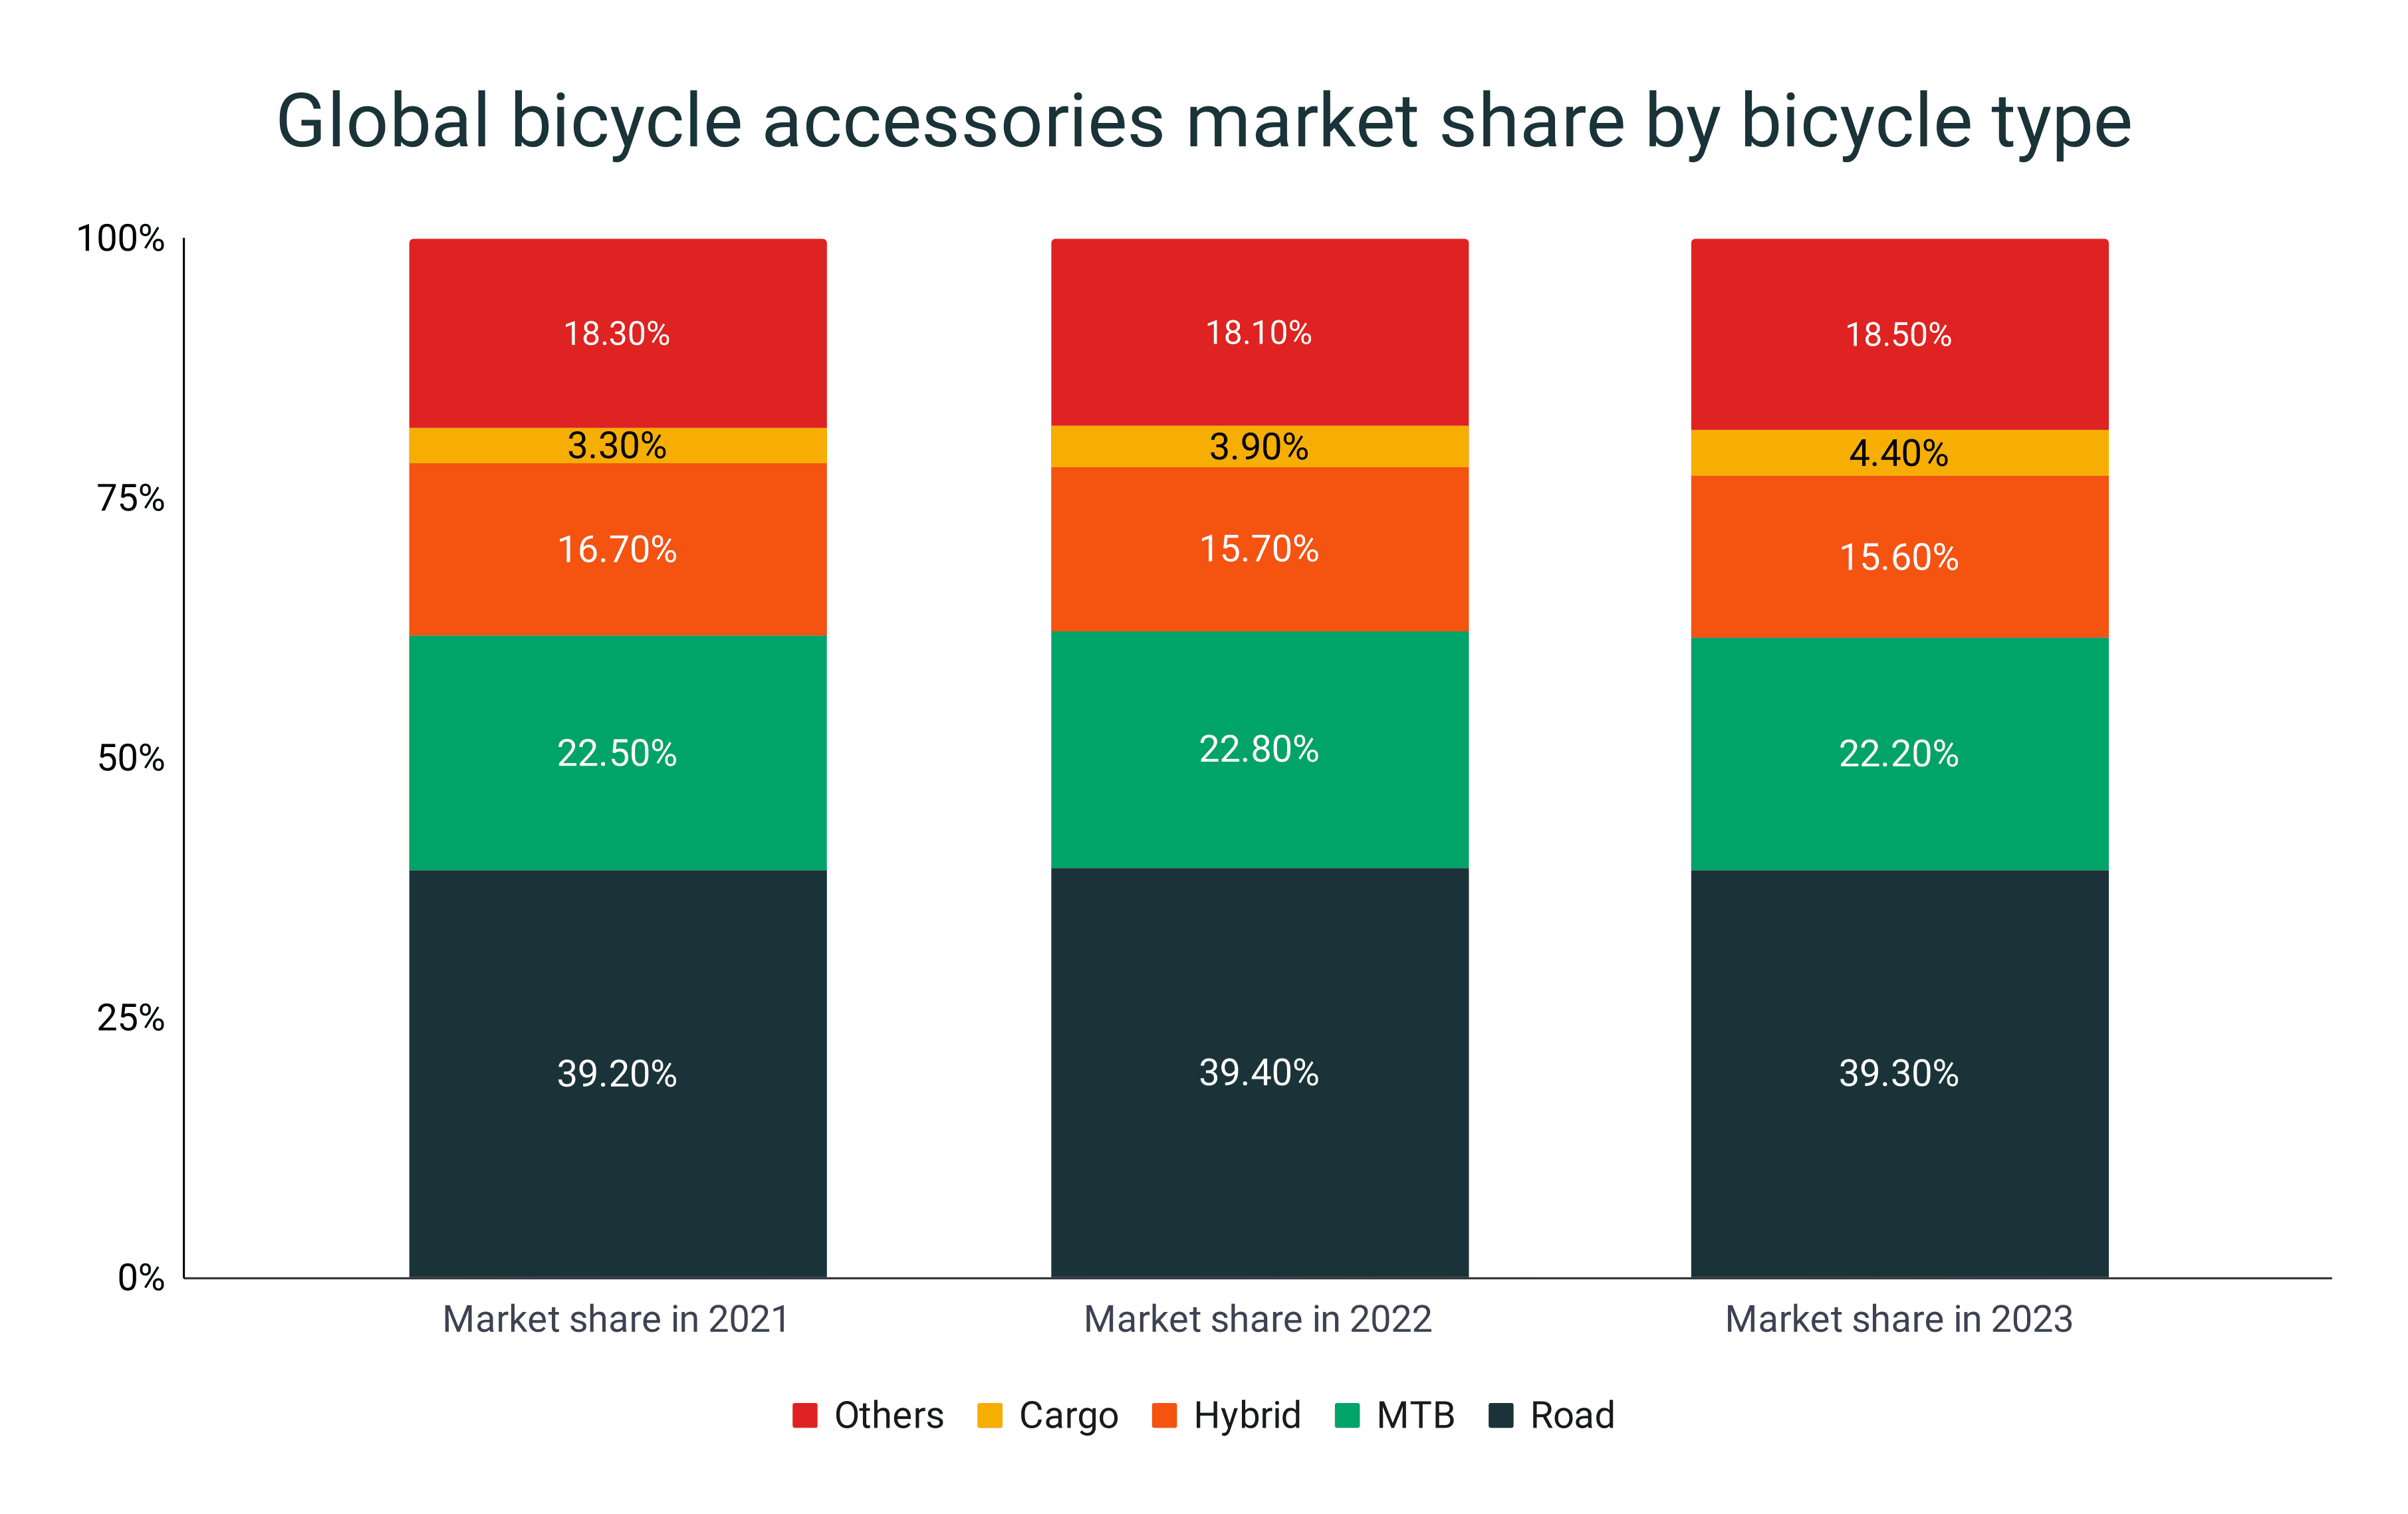
- The bicycle types that are expected to have the highest sales figures in the bicycle accessories industry are road bikes and MTB, with 39.3% and 22.2% of the market.
- 21.3% of bike users switched from conventional bikes to e-bikes.
- E-bikes are heavier than normal bikes by 10 kg.
- The average cycling speed worldwide is 13.5 mph.
- The average pace of women cyclists is 12.1 mph while men cyclists is 13.7 mph.
- The use of a helmet decreases the risk of head injury by 85%.
- 54% of cycling deaths are cyclists without helmets.
- The longest bike ever has a length of 135 feet and 10.7 inches.
- The largest bike ever has a wheel diameter of 10 feet and 9.92 inches.
Cycling demographics
- In the US, cycling is the 3rd most popular outdoor activity with more than 51 million Americans riding a bike every year.
- Around 870,000 Americans, or 0.6% of all employees in the US, bike to work.
- In big cities, 1.1% of commuters go to work by cycling.
- Outside the major cities, only 0.3% of employees get to their workplaces by biking.
- 1% of commuters from ages 16 to 24 travel to work by cycling.
- 0.7% from the 25 to 44 age bracket get to their jobs by bike.
- 0.4% of 45-year-old and older workers commute by bicycle.
- In New York, 100,000 individuals ride to work every day.
- Americans who commuted by cycling grew by 21% in 2020.
- Since 2000, the percentage of people who biked to work in the US has increased by 43%.
- 51% of American adults bike compared to 15% who run.
- Globally, 42% of households have at least one bike. This roughly equates to over 580 million bikes.
- In 2021, 10 billion miles with 480.2 billion feet of elevation gain were clocked in by cyclists around the world in Strava.
- In 2020, 103 million people rode a bicycle.
- For every 3 male cyclists, there is only 1 female cyclist.
- Out of all the bicycle trips made, 76% are done by men while 24% are done by women.
- With between 37% to 45% of women cyclists, the Twin Cities boasts one of the highest numbers of female bikers in the US.
How many bikes are there per country?
- The estimated number of bicycles around the world is 1 billion. However, this figure is believed to have grown drastically during the pandemic.
- Every day, 364,000 bicycles are manufactured and 47,670 bicycles are being sold.
- China is the leading manufacturer and distributor of bicycles, producing 60% of bikes worldwide. It has 500 million bikes in use in the country.
- It is followed by the US with 120 million bikes. 86% of the bikes sold in America are actually shipped in from China
- There are 75 million bicycles in Japan, putting them third in line.
- In Germany, 62 million bikes exist.
- Next country with the highest number of bicycles is Brazil with 42 million units.
- In Europe, the highest bicycle exporter is Portugal which exported 15% of all bicycles.
- The biggest importer in the country, on the other hand, is the UK which accounted for 18% of all the ship ins.
|
Country |
Number of bicycles |
|
China |
500,000,000 |
|
USA |
120,000,000 |
|
Japan |
75,000,000 |
|
Germany |
62,000,000 |
|
Brazil |
42,000,000 |
|
India |
32,000,000 |
|
Italy |
24,000,000 |
|
Indonesia |
22,000,000 |
|
UK/France |
20,000,000 |
|
Netherlands |
16,500,000 |
Which countries ride the bike the most?
- Approximately 7% of urban trips in the world are by bicycle.
- 60% of worldwide urban trips are completed by bicycle in Chinese cities.
- The Netherlands has the most daily bike riders in the world. 58% of the population use their bike for transportation 2 times per week or more.
- This is followed by Germany with 36% of their population who commutes with a bike.
- Same with Germany, India has 36% of people use cycling to go places twice or more in a week.
- Fourth in line is Sweden with 31% of bike riders.
- With 30% of the population who maximize biking for transportation, Finland comes fifth.
- South Africa and the United States come in 15th and 16th place, with 14% and 13% of people who bike at least two times a week or more frequently.
|
Country |
Percentage of the Population |
|
Netherlands |
58% |
|
Germany |
36% |
|
India |
36% |
|
Sweden |
31% |
|
Finland |
30% |
|
Brazil |
29% |
|
Switzerland |
28% |
|
Italy |
26% |
|
China |
25% |
|
Spain |
24% |
|
Russia |
22% |
|
France |
18% |
|
Canada |
17% |
|
UK |
15% |
|
South Africa |
14% |
|
US |
13% |
Global bicycle market size
- The estimated global revenue of bicycles in 2023 is around $69 billion.
- The market size of bikes in 2022 was $64 billion.
- In 2021, the bicycle market generated a revenue of $60 billion.
- The bicycle industry is predicted to expand at a compound annual growth rate of 8% from 2022 to 2032.
- In 2032, the bicycle market is estimated to reach $138 billion.
- During the pandemic, bike sales in the US expanded by 25% in 2020 and 30% in 2021 compared to the 2019 sales.
|
Year |
Market value (in billion) |
|
2015 |
$39.98 |
|
2016 |
$42.78 |
|
2017 |
$45.77 |
|
2018 |
$48.98 |
|
2019 |
$52.41 |
|
2020 |
$56.07 |
|
2021 |
$60.00 |
|
2022 |
$64.00 |
|
2023 |
$69.12 |
|
2024 |
$74.65 |
|
2025 |
$80.62 |
|
2026 |
$87.07 |
|
2027 |
$94.04 |
|
2028 |
$101.56 |
|
2029 |
$109.68 |
|
2030 |
$118.46 |
|
2031 |
$127.94 |
|
2032 |
$138.17 |
The average price of bicycle per type
- Ordinary bikes that are usually sold in department stores cost less than $250 on average.
- Entry-level bikes that are used for leisure or commutes are usually priced around $250 to $500.
- Entry-level road bikes, as well as average-quality commute bikes are worth between $500 to $750.
- Mid-range road and mountain bikes are in the price range of $750 to $1,200.
- Bikes with superior quality and first-rate components are over $1,200.
- It is advisable to invest $1,000 to $2,500 on your first bike unless it’s only an occasional hobby.
|
Bicycle’s level of quality |
Average price |
|
Low-end bikes |
<$250 |
|
Basic, entry-level recreation bikes |
$250-$500 |
|
Mid-range recreation bikes and entry-level road bikes |
$500-$750 |
|
High-quality recreation bikes, entry-level to mid-range MTB and road bikes |
$750-$1,200 |
|
Higher end bikes |
>$1,200 |
Global bicycle accessories market size
- The forecasted revenue of bicycle accessories in 2023 is $13.44 billion.
- The market size of bike apparel in 2022 was $12.5 billion.
- The offline sales network of bicycle accessories accounted for a 55% market share in 2022. The online sales channel, on the other hand, covered the remaining 45%.
- The global market value in 2021 was $12 billion, which grew by 4.2% in 2022.
- On the other hand, the US market of bike accessories was valued at $1.7 billion and $1.8 billion in 2020 and 2021, respectively.
- The market size for bike gears and accessories worldwide is predicted to soar at a compound annual growth rate of 7.5% from 2022 to 2032.
- The global bicycle accessories market is expected to reach over $25 billion by 2030.
|
Year |
Market value (in billion) |
|
2021 |
$12.00 |
|
2022 |
$12.5 |
|
2023 |
$13.44 |
|
2024 |
$14.45 |
|
2025 |
$15.53 |
|
2026 |
$16.69 |
|
2027 |
$17.95 |
|
2028 |
$19.29 |
|
2029 |
$20.74 |
|
2030 |
$22.29 |
|
2031 |
$23.97 |
|
2032 |
$25.76 |
The global market value of bicycle accessories by component
- The anticipated leading component in the 2023 market size of all bicycle accessories are pedals followed by saddles, taking 23.2% and 19.5% of the sales figure, respectively.
- The projected market value of pedals and saddles in 2023 is estimated at around $3.11 billion and $2.62 billion.
- In 2022, the pedal component also had the most market share in all the bike accessories with an almost 24% market portion or around $2.96 billion.
- The next component that dominated the overall market in 2022 is the saddle, covering about 19% of the revenue which is approximately worth $2.32 billion.
- In 2021, pedals accounted for 22.8%, saddles for 18.8%, fenders, and mud flaps for 12.8%, locks for 12.1%, lighting systems for 11.4%, mirrors for 8.7%, water bottle cages for 8%, and others covered 5.4%.
|
Component |
Market share in 2021 |
Market share in 2022 |
Market share in 2023 |
|
Saddles |
18.8% |
18.6% |
19.5% |
|
Pedals |
22.8% |
23.7% |
23.2% |
|
Lighting System |
11.4% |
10.9% |
11% |
|
Mirrors |
8.7% |
8.3% |
8.5% |
|
Water Bottle Cages |
8% |
8.3% |
7.3% |
|
Locks |
12.1% |
11.5% |
12.8% |
|
Fenders & Mud Flaps |
12.8% |
13.5% |
12.8% |
|
Others |
5.4% |
5.1% |
4.9% |
Global market share of bicycle accessories by bicycle type
- In 2023, road and mountain bikes are anticipated to dominate the bicycle accessories industry with 39.3% and 22.2% of market shares, respectively.
- The bicycle type with the most bicycle accessories market share in 2022 was the road bike covering 39.4% of the market.
- The next with the second-highest share of the bike accessories market is the MTB.
- Cargo bike is the bicycle type with the least market share with only 3.9%.
|
Bicycle type |
Market share in 2021 |
Market share in 2022 |
Market share in 2023 |
|
Road |
39.2% |
39.4% |
39.3% |
|
MTB |
22.5% |
22.8% |
22.2% |
|
Hybrid |
16.7% |
15.7% |
15.6% |
|
Cargo |
3.3% |
3.9% |
4.4% |
|
Others |
18.3% |
18.1% |
18.5% |
E-bikes statistics
- In America, e-bikes move up to 28 mph on average.
- There are approximately 300 million e-bikes in the world.
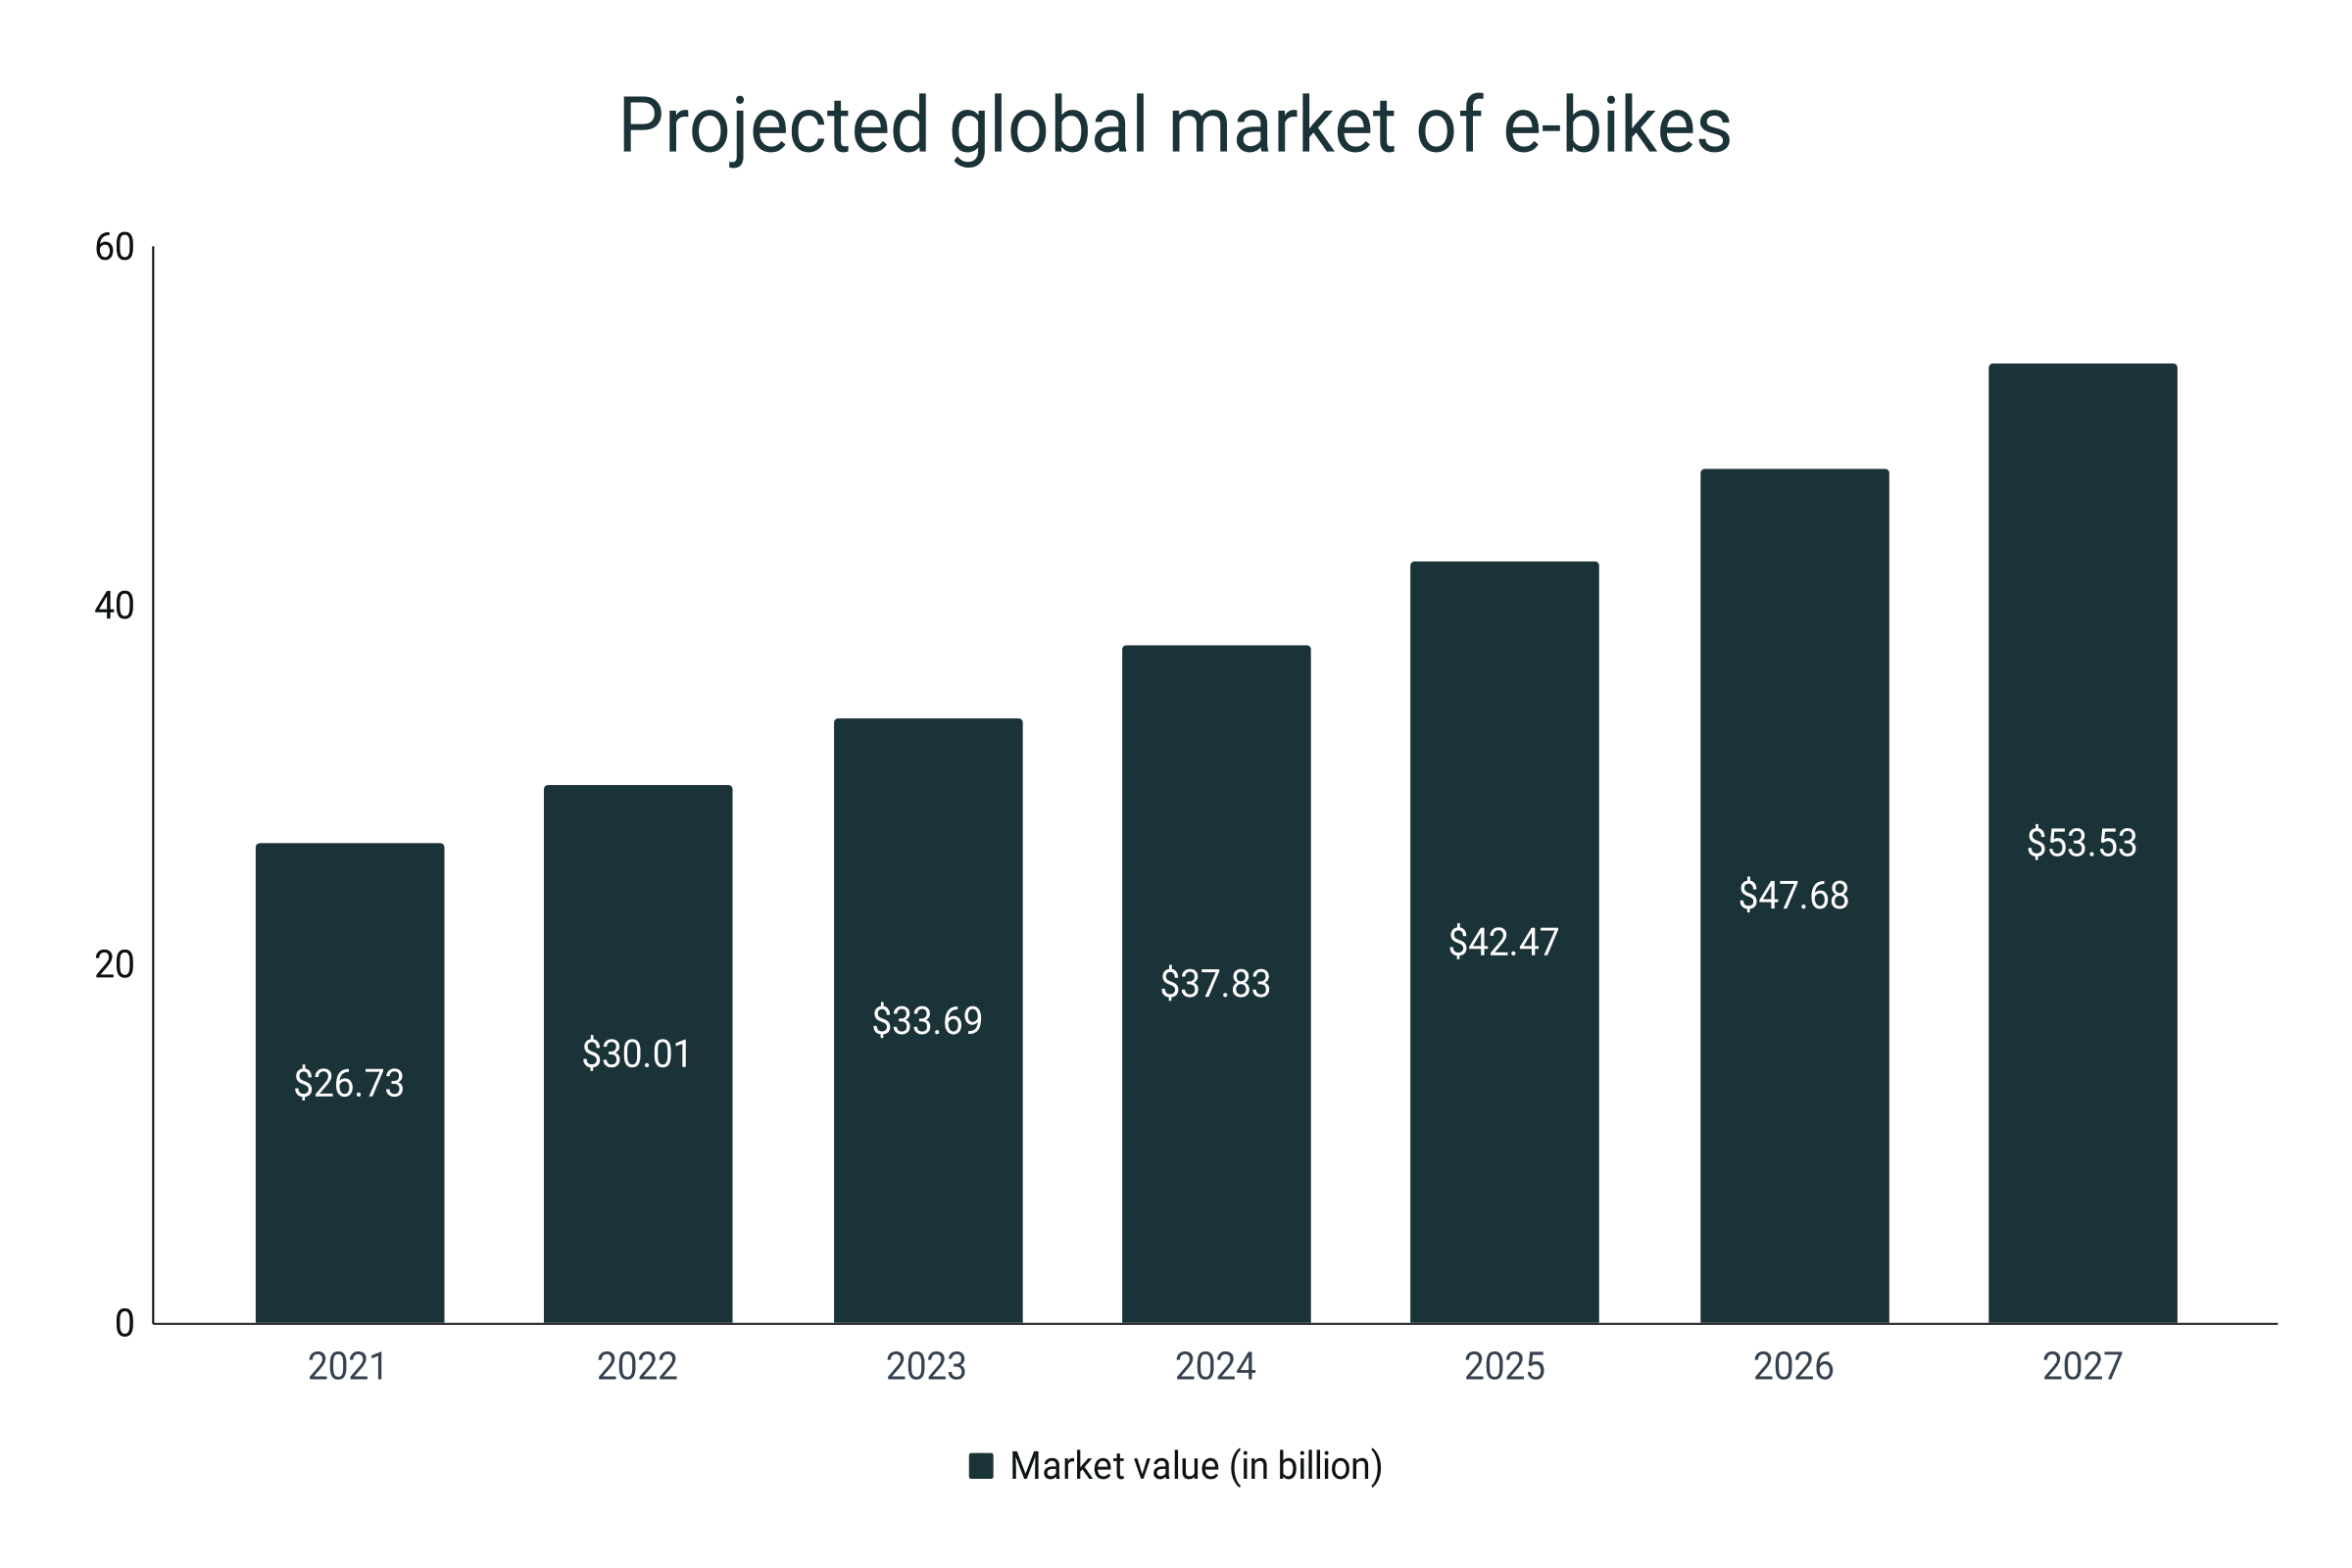
- In 2023, the projected market value of e-bikes worldwide is estimated at $33.69 billion.
- The global market size for electric bikes in 2021 is $26.73 billion.
- The compound annual growth rate or CAGR of the e-bike market between 2021 and 2027 is 12.27%.
- Consequently, the global e-bike market is expected to expand to $53.53 billion in 2027.
- 21.3% of cyclists converted their bikes to e-bikes.
- In China, 36 million electronic bikes are produced every year.
- E-bikes are 10 kg heavier than standard bikes.
|
Year |
Market value (in billion) |
|
2021 |
$26.73 |
|
2022 |
$30.01 |
|
2023 |
$33.69 |
|
2024 |
$37.83 |
|
2025 |
$42.47 |
|
2026 |
$47.68 |
|
2027 |
$53.53 |
Bike speed statistics
- The global average cycling speed is 13.5 mph.
- According to Strava, the average cycling speed of women is 12.1 mph while the cycling speed of men is 13.7 mph.
- A beginner cyclist has an average speed of 8 to 12 mph.
- An intermediate cyclist bikes at an average pace of 12 to 16 mph.
- Advanced and professional cyclists are much faster at average speeds of 16 to 24 mph and greater than 24 mph, respectively.
- On roadways that are meant for bikes, the average cycling speed is from 7.7 mph to 16.4 mph.
- In 2018, Denise Mueller-Korenek recorded the fastest cycling speed at 183.9 mph.
- The fastest speed achieved on an indoor treadmill is 207.91 mph, recorded by Bruce Bursford.
- The average bike commute distance in the US is about 3 to 4 miles.
|
Cyclist’s skill level |
Average cycling speed |
|
Beginner |
8-12 mph |
|
Intermediate |
12-16 mph |
|
Advanced |
16-24 mph |
|
Professional |
>24 mph |
|
Average cycling speed by bicycle type |
|||
|
Bicycle type |
At zero elevation |
At 5% inclines |
Competitive downhill |
|
Road bike |
14-18 mph |
8-12 mph |
- |
|
MTB |
10-14 mph |
4-8 mph |
29-32 mph |
|
Hybrid |
12-16 mph |
6-10 mph |
- |
Bicycle accident statistics
- 2% of the total car crash fatalities in America involve cyclists.
- Deaths caused by cycling increased by 5% from 2020 to 2021.
- In 2018, approximately 857 bike riders died due to traffic accidents, with 79% of these deaths being in urban areas.
- Drivers who attempted to overtake bike lanes between intersections resulted in 25% of bike rider deaths.
- Wearing a helmet while cycling can reduce up to 85% chance of acquiring a head injury.
- The typical bike commute times are from 6 AM to 8 AM and 6 PM to 10 PM. Consequently, these times have low-light conditions and the highest number of deaths by bike crashes.
- Downhill mountain bikers have an injury rate of 43 injuries per 1,000 hours cycled.
- 54% of bicycling fatalities involve cyclists without helmets.
- 29% of death victims of cycling are found wearing a helmet.
- The remaining 17% are not determined, whether they are wearing a helmet or not.
Cycling fun facts
- The minimum speed to which bicycles can balance on their own without wobbling is around 8 mph.
- The first bike helmet was produced 300 years after bicycles became widely used.
- The longest bicycle in the world measured 135 feet and 10.7 inches.
- The largest bike, on the other hand, has wheels that measure 10 feet and 9.92 inches in diameter.
- Riding a bike is three times faster than walking.
- Fifteen bikes can fit in the same area that a car occupies.
- The number of bicycles is double the number of cars in the world.
- Approximately 100 million bicycles are produced globally per year.
- Every year, the 19th individual in the world buys a bicycle.
- The manufacturing rate for bicycles is 2.5 times higher than for cars.
- Only 1% of total road traffic is comprised of cyclists.
- The most bike-friendly country is Denmark. 9 out of 10 of their population own a bike.
- 25% of all the trips in Denmark shorter than a 5-km distance are cycled.
- Every year, there are approximately 15 million bicycles are disposed of by their owners.
- The highest bicycle expenses per user recorded from 2007 to 2016 was $23.02 in 2015.
- The lowest bicycle expenses per user in the same period was $13.69 in 2008.
- In the US, 188,500 bicycles are stolen every year.
- The bicycle theft count in the UK is even higher at 400,000 bikes per year.
Sources
https://www.statista.com/statistics/674381/size-global-market-electric-bicycles/
https://www.statista.com/chart/25156/share-using-bike-for-transportation-regularly/
https://completetri.com/cycling-and-biking-statistics/
https://www.livestrong.com/article/13730398-cycling-statistics/
https://www.weightlossresources.co.uk/calories/burning_calories/cycling-burns-calories.htm#:~:text=On%20average%2C%20cycling%20burns%20over,while%20men%20will%20burn%20450
https://www.actionaid.org.uk/blog/2021/03/19/8-weird-and-wonderful-facts-you-didnt-know-about-cycling
https://www.worldcycletours.com/blog/2019/22-interesting-facts-about-cycling
https://kids.nationalgeographic.com/history/article/ten-fun-facts-about-bikes
https://www.bikethesites.com/how-many-bicycles-are-in-the-world/
https://www.grandviewresearch.com/industry-analysis/bicycle-accessories-market-report#:~:text=The%20global%20bicycle%20accessories%20market%20size%20was%20estimated%20at%20USD,USD%2012.14%20billion%20in%202023.
https://www.gminsights.com/industry-analysis/bicycle-accessories-market
https://www.nsc.org/safety-first/bicycle-safety-statistics-may-surprise-you
https://www.pioneersportscolorado.com/bike-statistics-and-facts-2019/
https://www.bicycle-guider.com/bike-facts-stats/
https://www.factmr.com/report/bicycle-market
https://www.ridepace.com/how-much-are-bikes/
https://www.bikelockwiki.com/average-cycling-speed/