Asics Shoes Statistics
Kihachiro Onitsuka founded ASICS in the 1940s. Today, the Japan-based shoe giant is the top footwear brand from the Asia-Pacific region. This compilation of relevant statistics, facts, and figures about the shoe company is here to tell you why.
Top ASICS shoe statistics
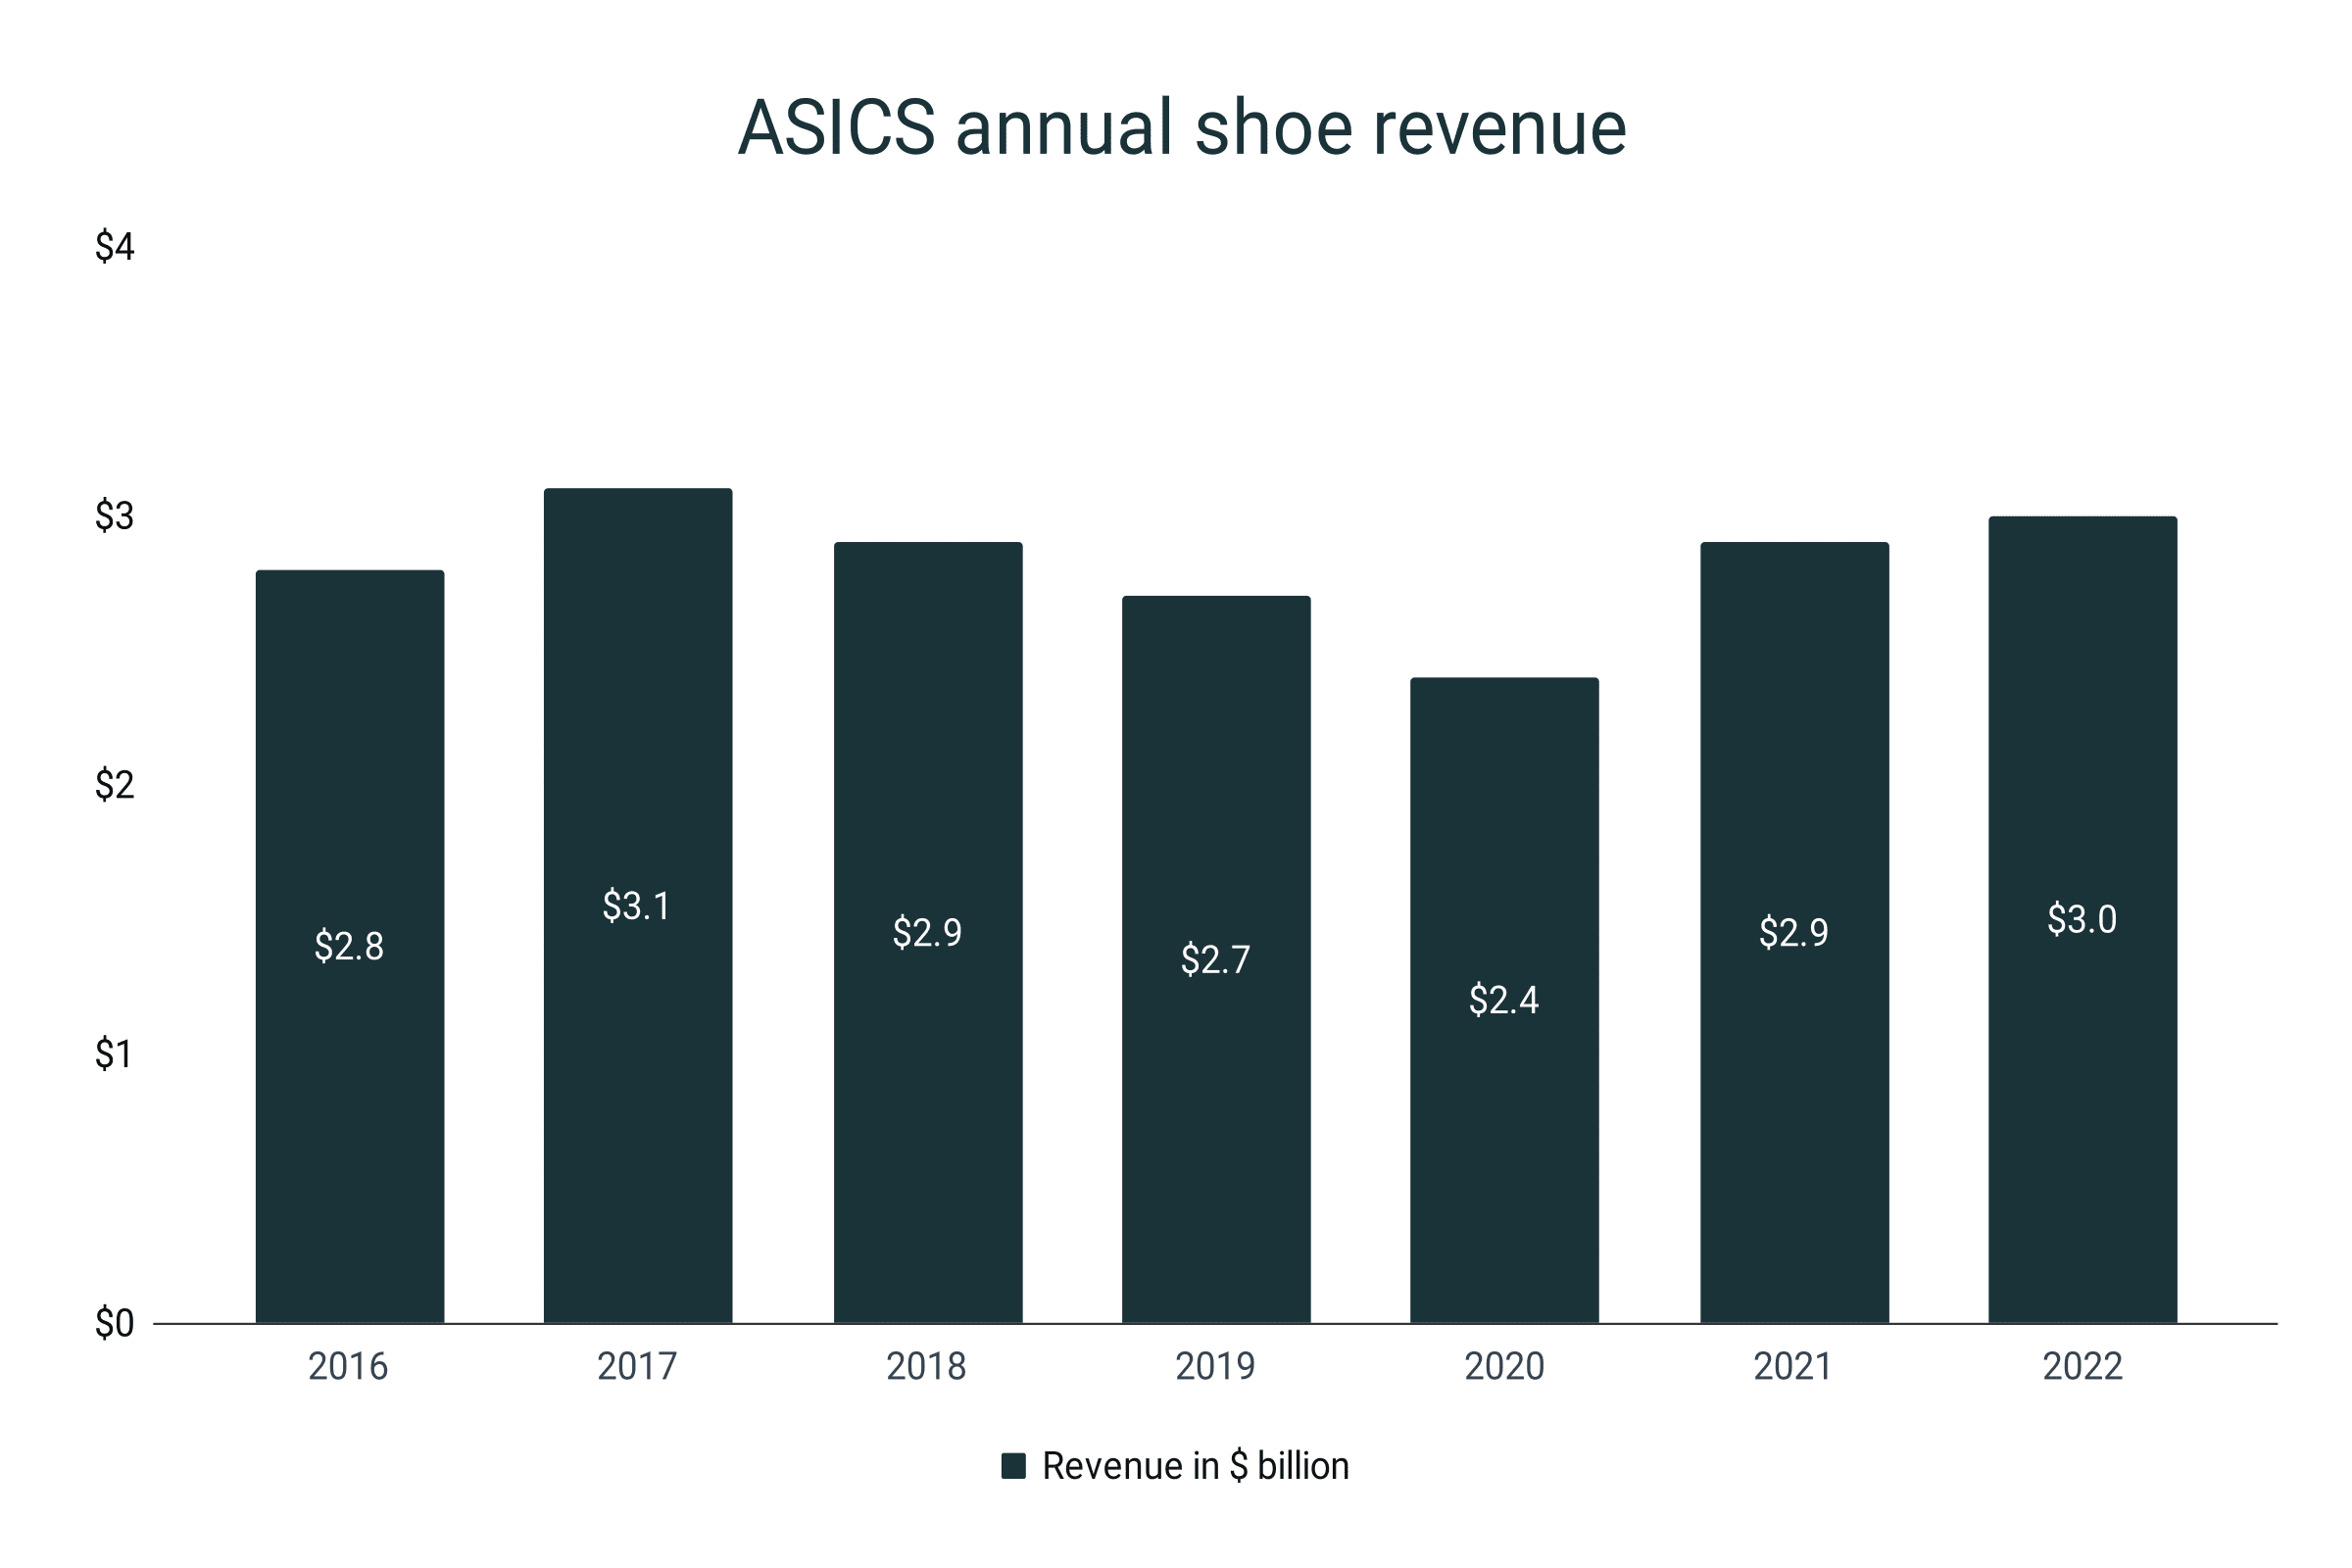
- ASICS closed the year 2022 with a $3 billion shoe revenue.
- This is 3.4% more than its 2021 output but still lower than its all-time high of $3.1 billion in 2017.
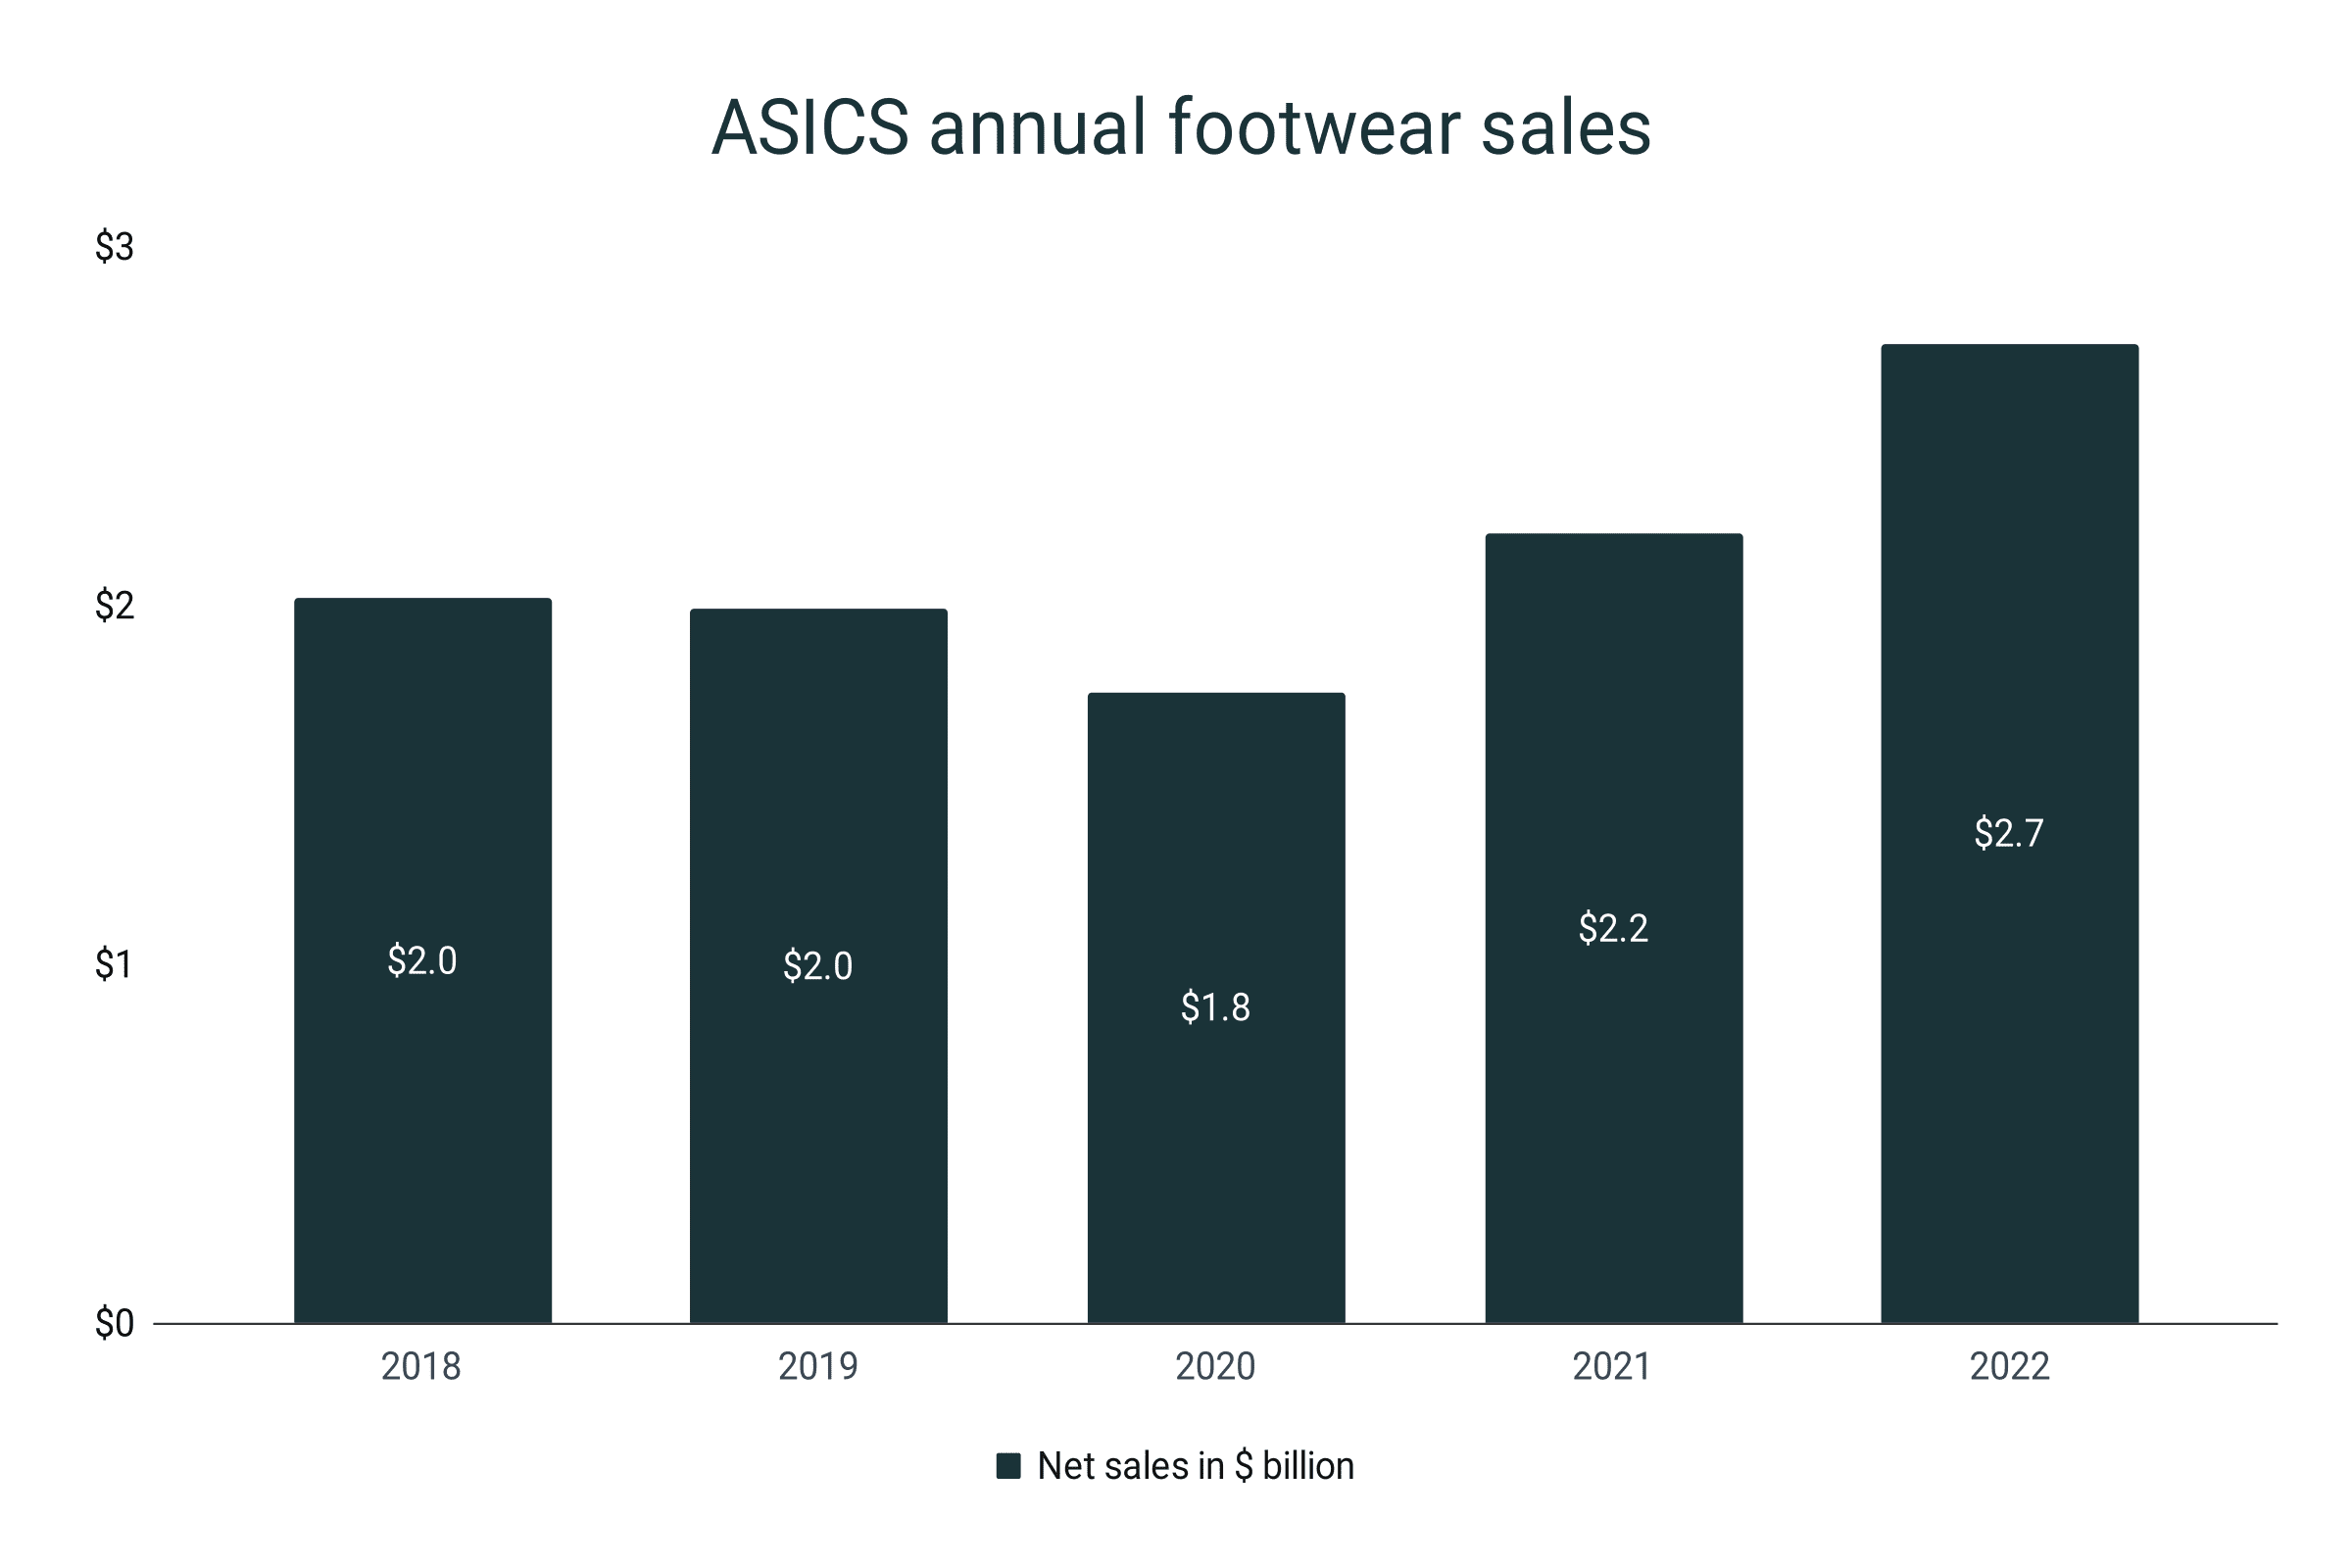
- The net sales of the footwear segment increased by 24.1% to reach $2.73 billion by the end of 2022.
- During this time, the footwear sales comprised 82.3% of the company’s total net sales.
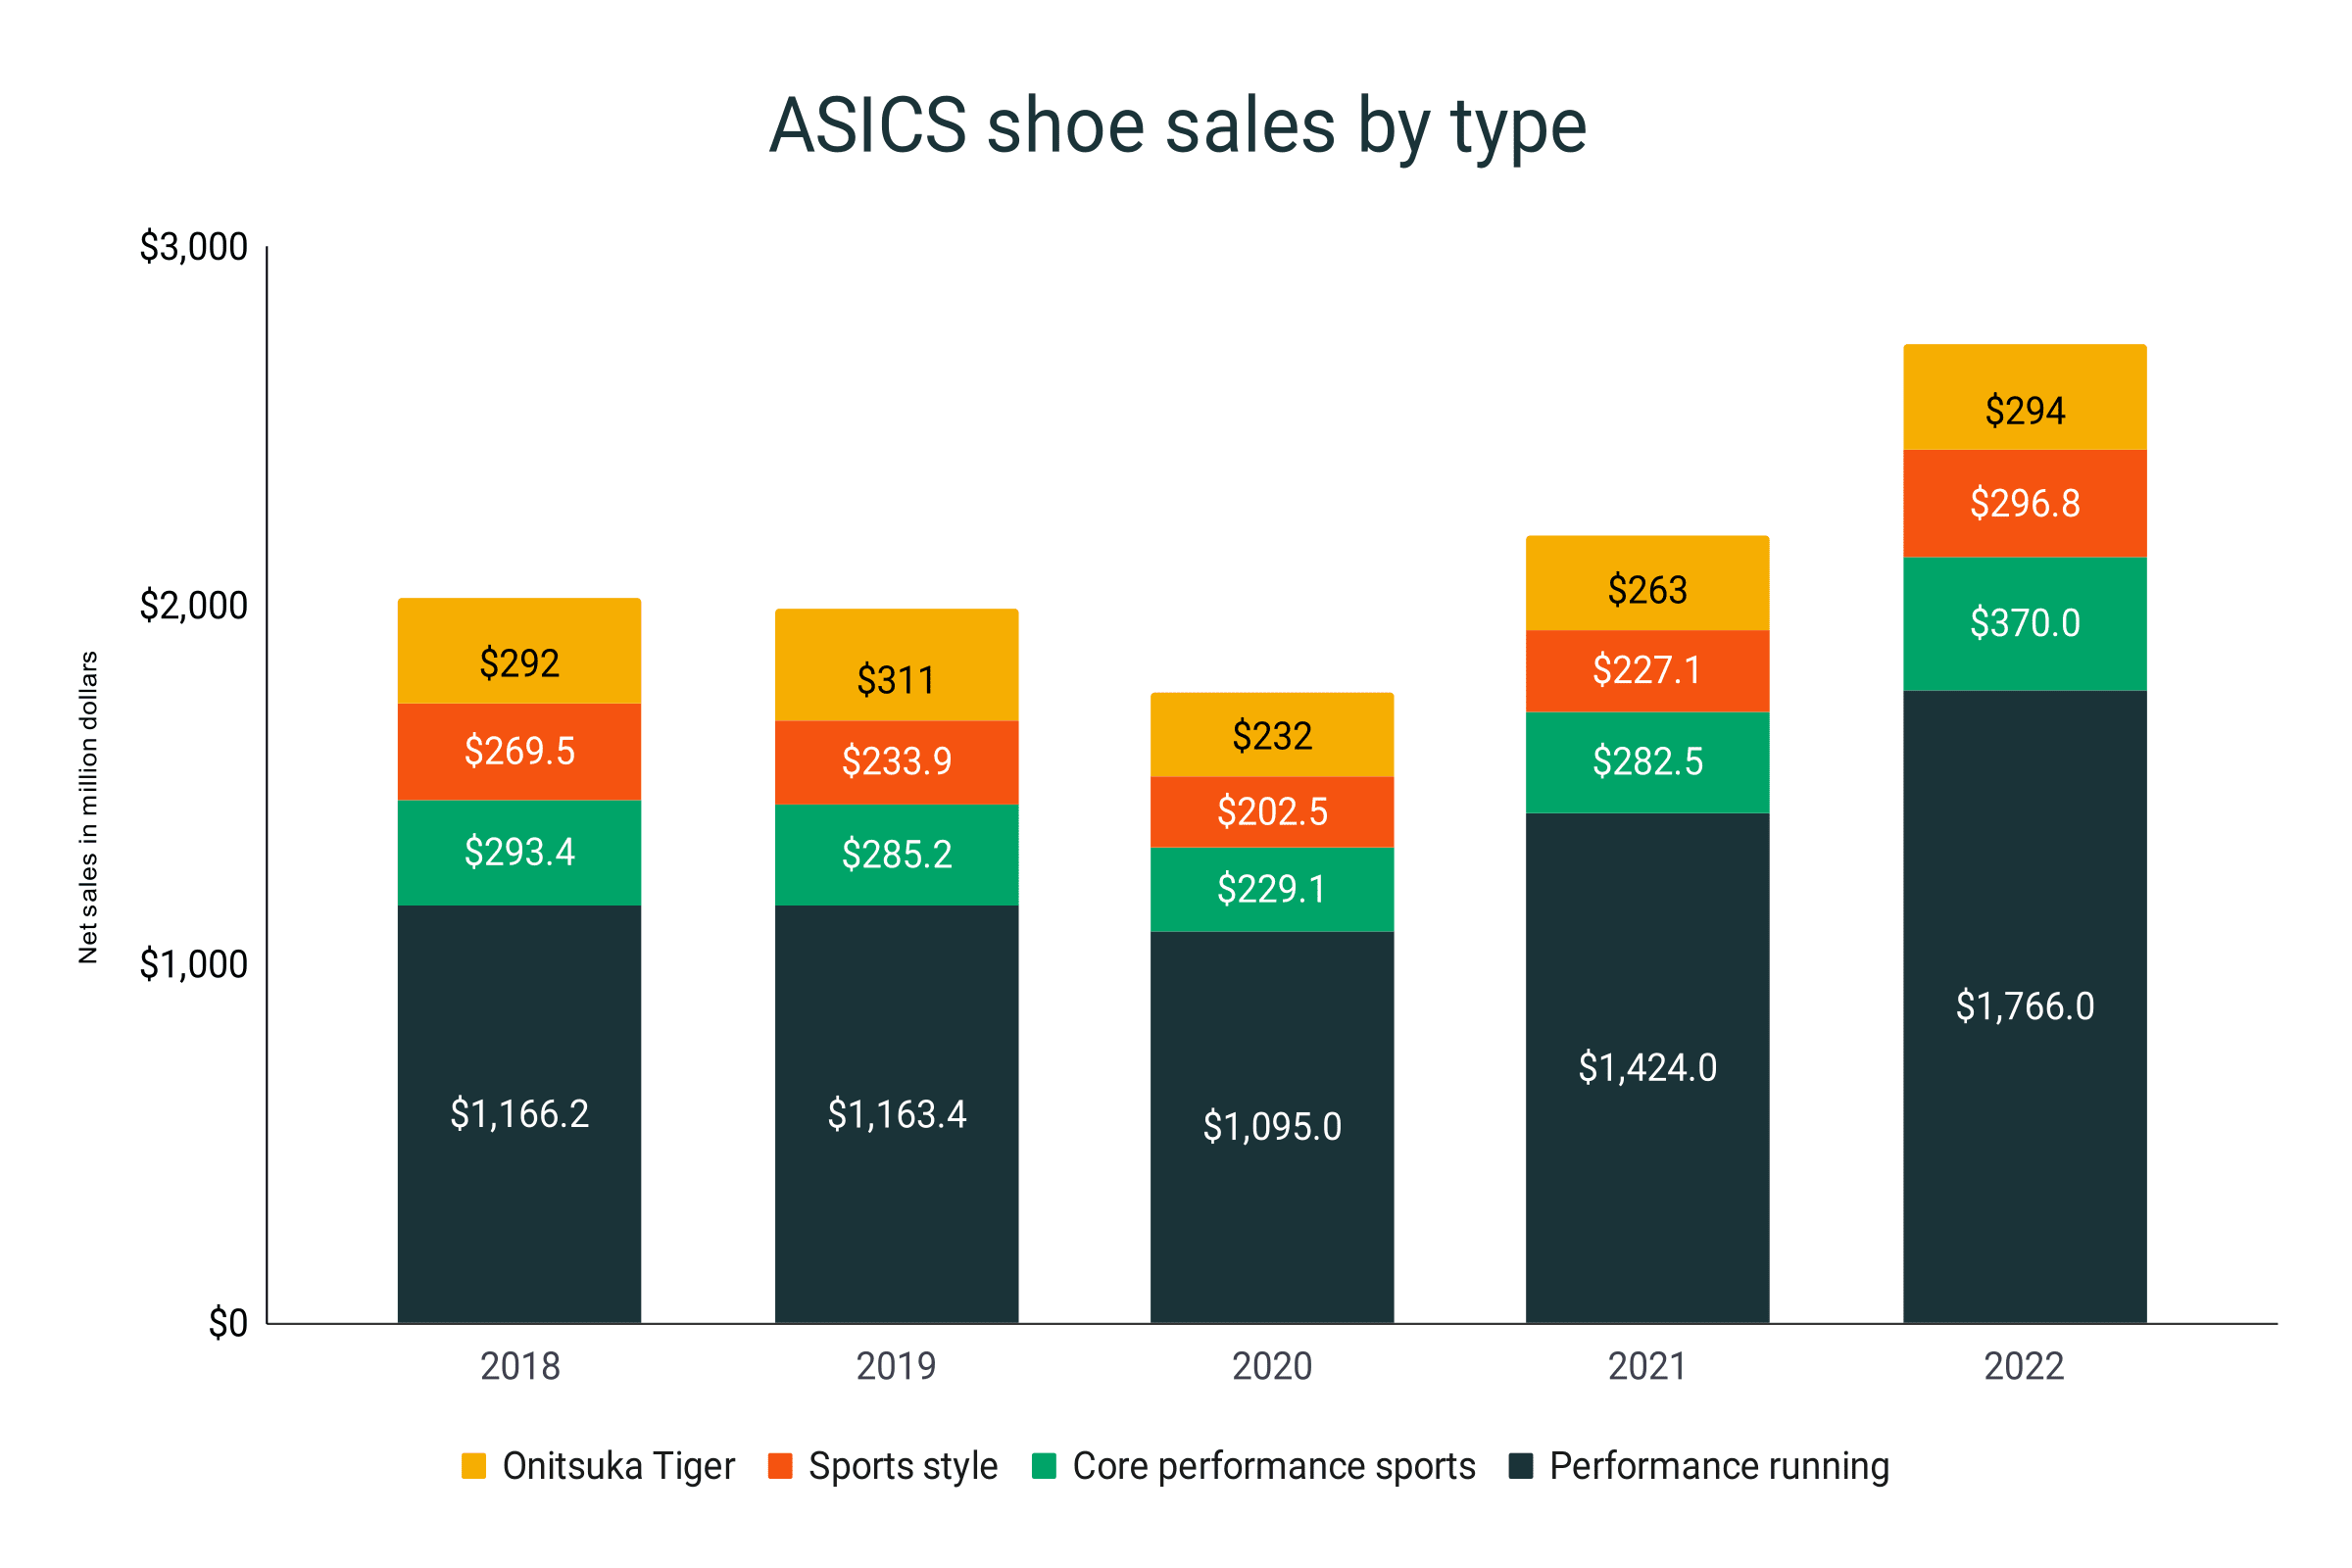
- Performance running and core performance sports shoes were the top sales contributors in 2022. The two managed to snag $1,766 million and $370 million, respectively.
- Notably, sports style shoes overtook Onitsuka Tiger for the first time in 5 years. Sports style footwear raked in $296.8 million versus the $294.1 million sales of Onitsuka Tiger.
- Despite the decline, the Europe, Middle East, and Africa (EMEA) region is the dominant ASICS market player with a 30% share in 2022. It is followed by North America and Greater China with 25.1% and 14.7%, respectively.
- Sales from performance running footwear are the top sales contributor in each region except for Japan. In 2022, core performance sports shoes pulled in $144.9 million while running shoes tallied $71.1 million.
- From its 0.89% global shoe market share in 2021, ASICS dipped further and settled to a 0.79% portion in 2022.
- 40% of all ASICS shoes were made in Vietnam.
- The average weight of ASICS shoes is 10.3 oz (290.7g) for men and 8.6 oz (244.8g) for women.
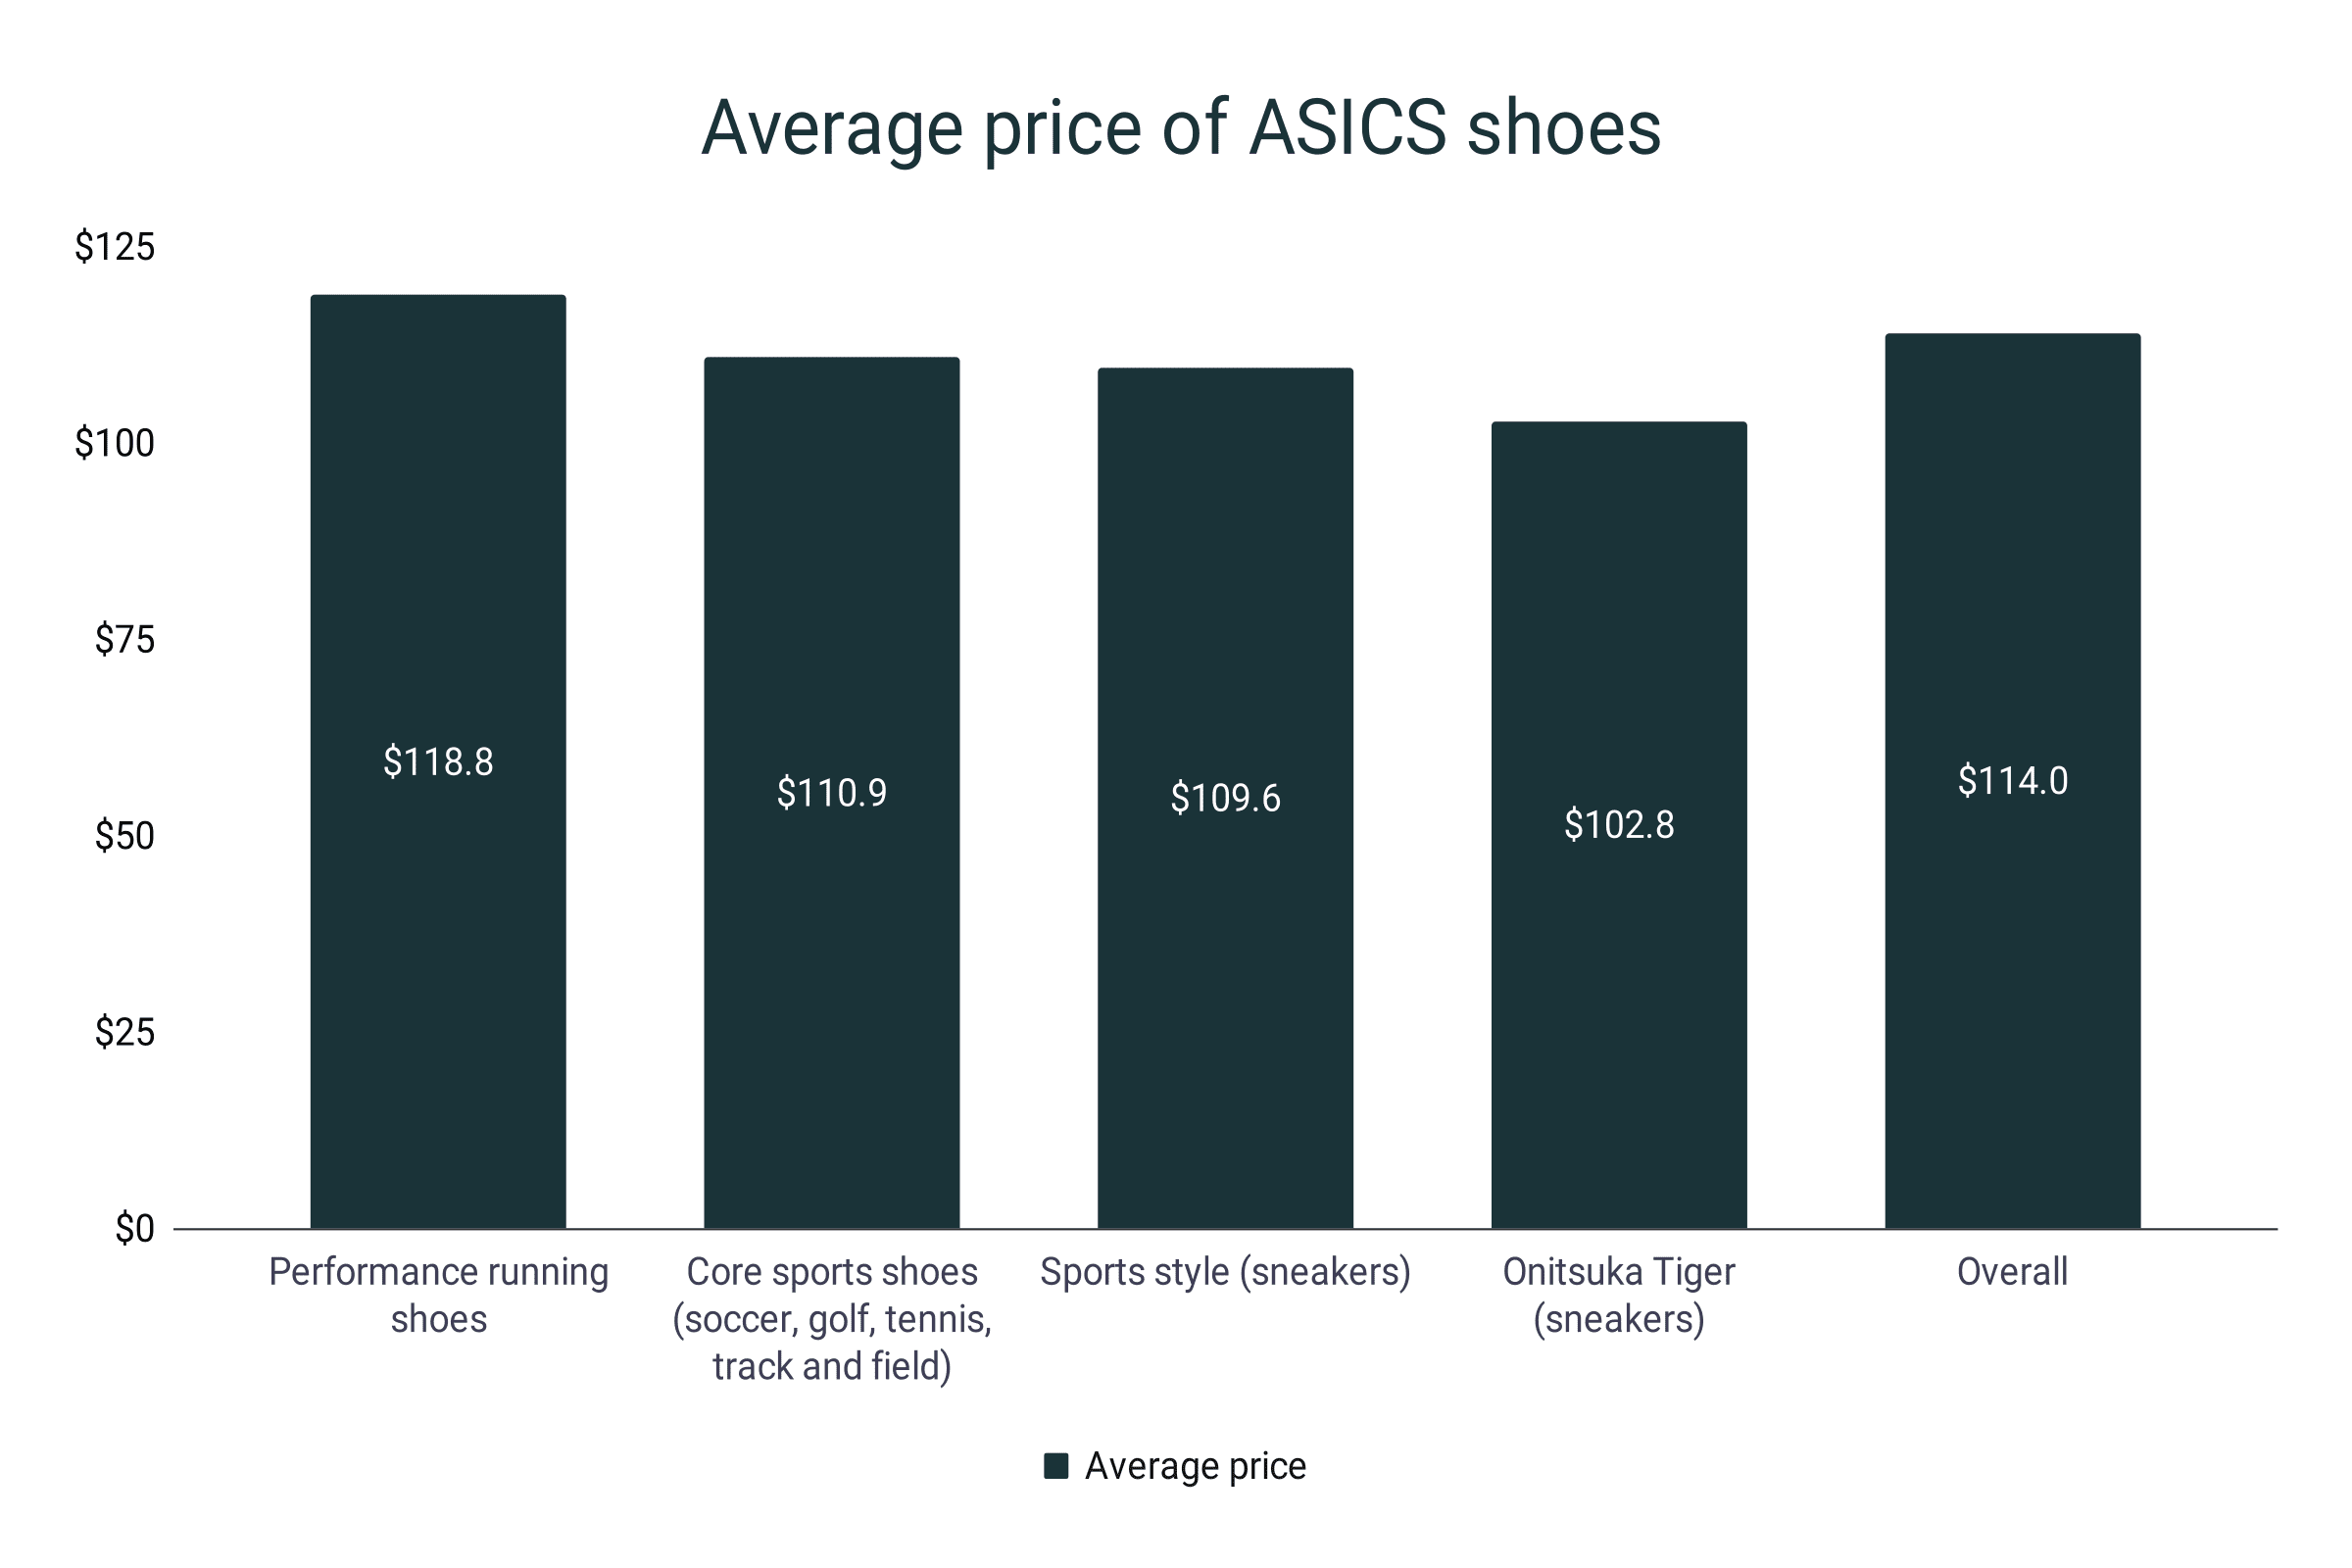
- On average, ASICS shoes retail for $114.
ASICS shoe revenue
- In 2022, ASICS accumulated $3 billion in footwear revenues.
- The company managed to climb 3.4% past its 2021 output of $2.9 billion.
- However, it is still lower than the $3.1 billion shoe revenue in 2017.
- ASICS suffered a series of losses from 2018-2020. The shoe brand endured a 6.5% and a 6.9% losses in 2018 and 2019, respectively.
- Then during the pandemic, ASICS plummeted by another 11.1%, capping with a $2.4 billion footwear revenue in 2020. This is the lowest footwear revenue of ASICS over the last 7 years.
- In 2016, the company tallied $2.8 billion in its shoe revenue.
- From 2016 to 2022, the brand has grown its footwear revenues by a meager 7.1%.
ASICS annual shoe revenue
|
Year |
Revenue in $ billion |
Year-on-year growth |
|
2016 |
$2.8 |
|
|
2017 |
$3.1 |
10.7% |
|
2018 |
$2.9 |
-6.5% |
|
2019 |
$2.7 |
-6.9% |
|
2020 |
$2.4 |
-11.1% |
|
2021 |
$2.9 |
20.8% |
|
2022 |
$3.0 |
3.4% |
ASICS shoe net sales
- In terms of net sales, ASICS closed 2022 with a $2.73 billion figure.
- This is 24.1% better than the $2.20 billion shoe net sales the previous year.
- After dealing with an 11.8% dip in 2020, ASICS experienced its biggest year-on-year growth in footwear sales in 2021. The shoe company enjoyed a 24.9% overall growth.
- ASICS generated $2.02 billion in 2018 and $1.99 billion in 2019, signifying a 1.4% decline.
- But looking at the big picture, between 2018 and 2022, ASICS was able to inflate its footwear sales by 35.1% in just 5 years.
- Furthermore, from being 76.4% of the company’s net sales in 2018, ASICS footwear bloated to an 82.3% share in 2022.
ASICS annual footwear sales
|
Year |
Net sales in $ billion |
Year-on-year growth |
|
2018 |
$2.02 |
|
|
2019 |
$1.99 |
-1.4% |
|
2020 |
$1.76 |
-11.8% |
|
2021 |
$2.20 |
24.9% |
|
2022 |
$2.73 |
24.1% |
ASICS shoe net sales by type
- Performance running shoes led the 2022 sales of ASICS. The segment garnered a total of $1,766 million in the same year.
- In 2021, about $1,424 million in sales was contributed by performance running shoes.
- The lowest output of ASICS running shoes was recorded in 2020 with $1,095 million net sales.
- With a $370 million figure, ASICS core performance sports shoes are the second biggest sales driver.
- During the pandemic, the sales from the core performance sports segment hit a five-year all-time low of $229.1 million.
- In 2018, the core performance sports footwear department of ASICS generated $293.4 million in sales. It suffered losses in 2019 and 2020 until fully recovering in 2022, breaching the $300 million mark for the first time.
- ASICS sports style shoe segment overtook Onitsuka Tiger as the 3rd biggest sales contributor in 2022. Sports style footwear accumulated $296.8 million compared to the $294.1 million sales of Onitsuka Tiger.
- Back in 2018, Onitsuka Tiger’s sales tallied $292.1 million while sports style shoes were at $269.5 million.
ASICS shoe sales by type in USD million
|
Year |
Performance running |
Core performance sports |
Sports style |
Onitsuka Tiger |
|
2018 |
$1,166.2 |
$293.4 |
$269.5 |
$292.1 |
|
2019 |
$1,163.4 |
$285.2 |
$233.9 |
$311.2 |
|
2020 |
$1,095.0 |
$229.1 |
$202.5 |
$231.9 |
|
2021 |
$1,424.0 |
$282.5 |
$227.1 |
$263.3 |
|
2022 |
$1,766.0 |
$370.0 |
$296.8 |
$294.1 |
ASICS shoe net sales by region
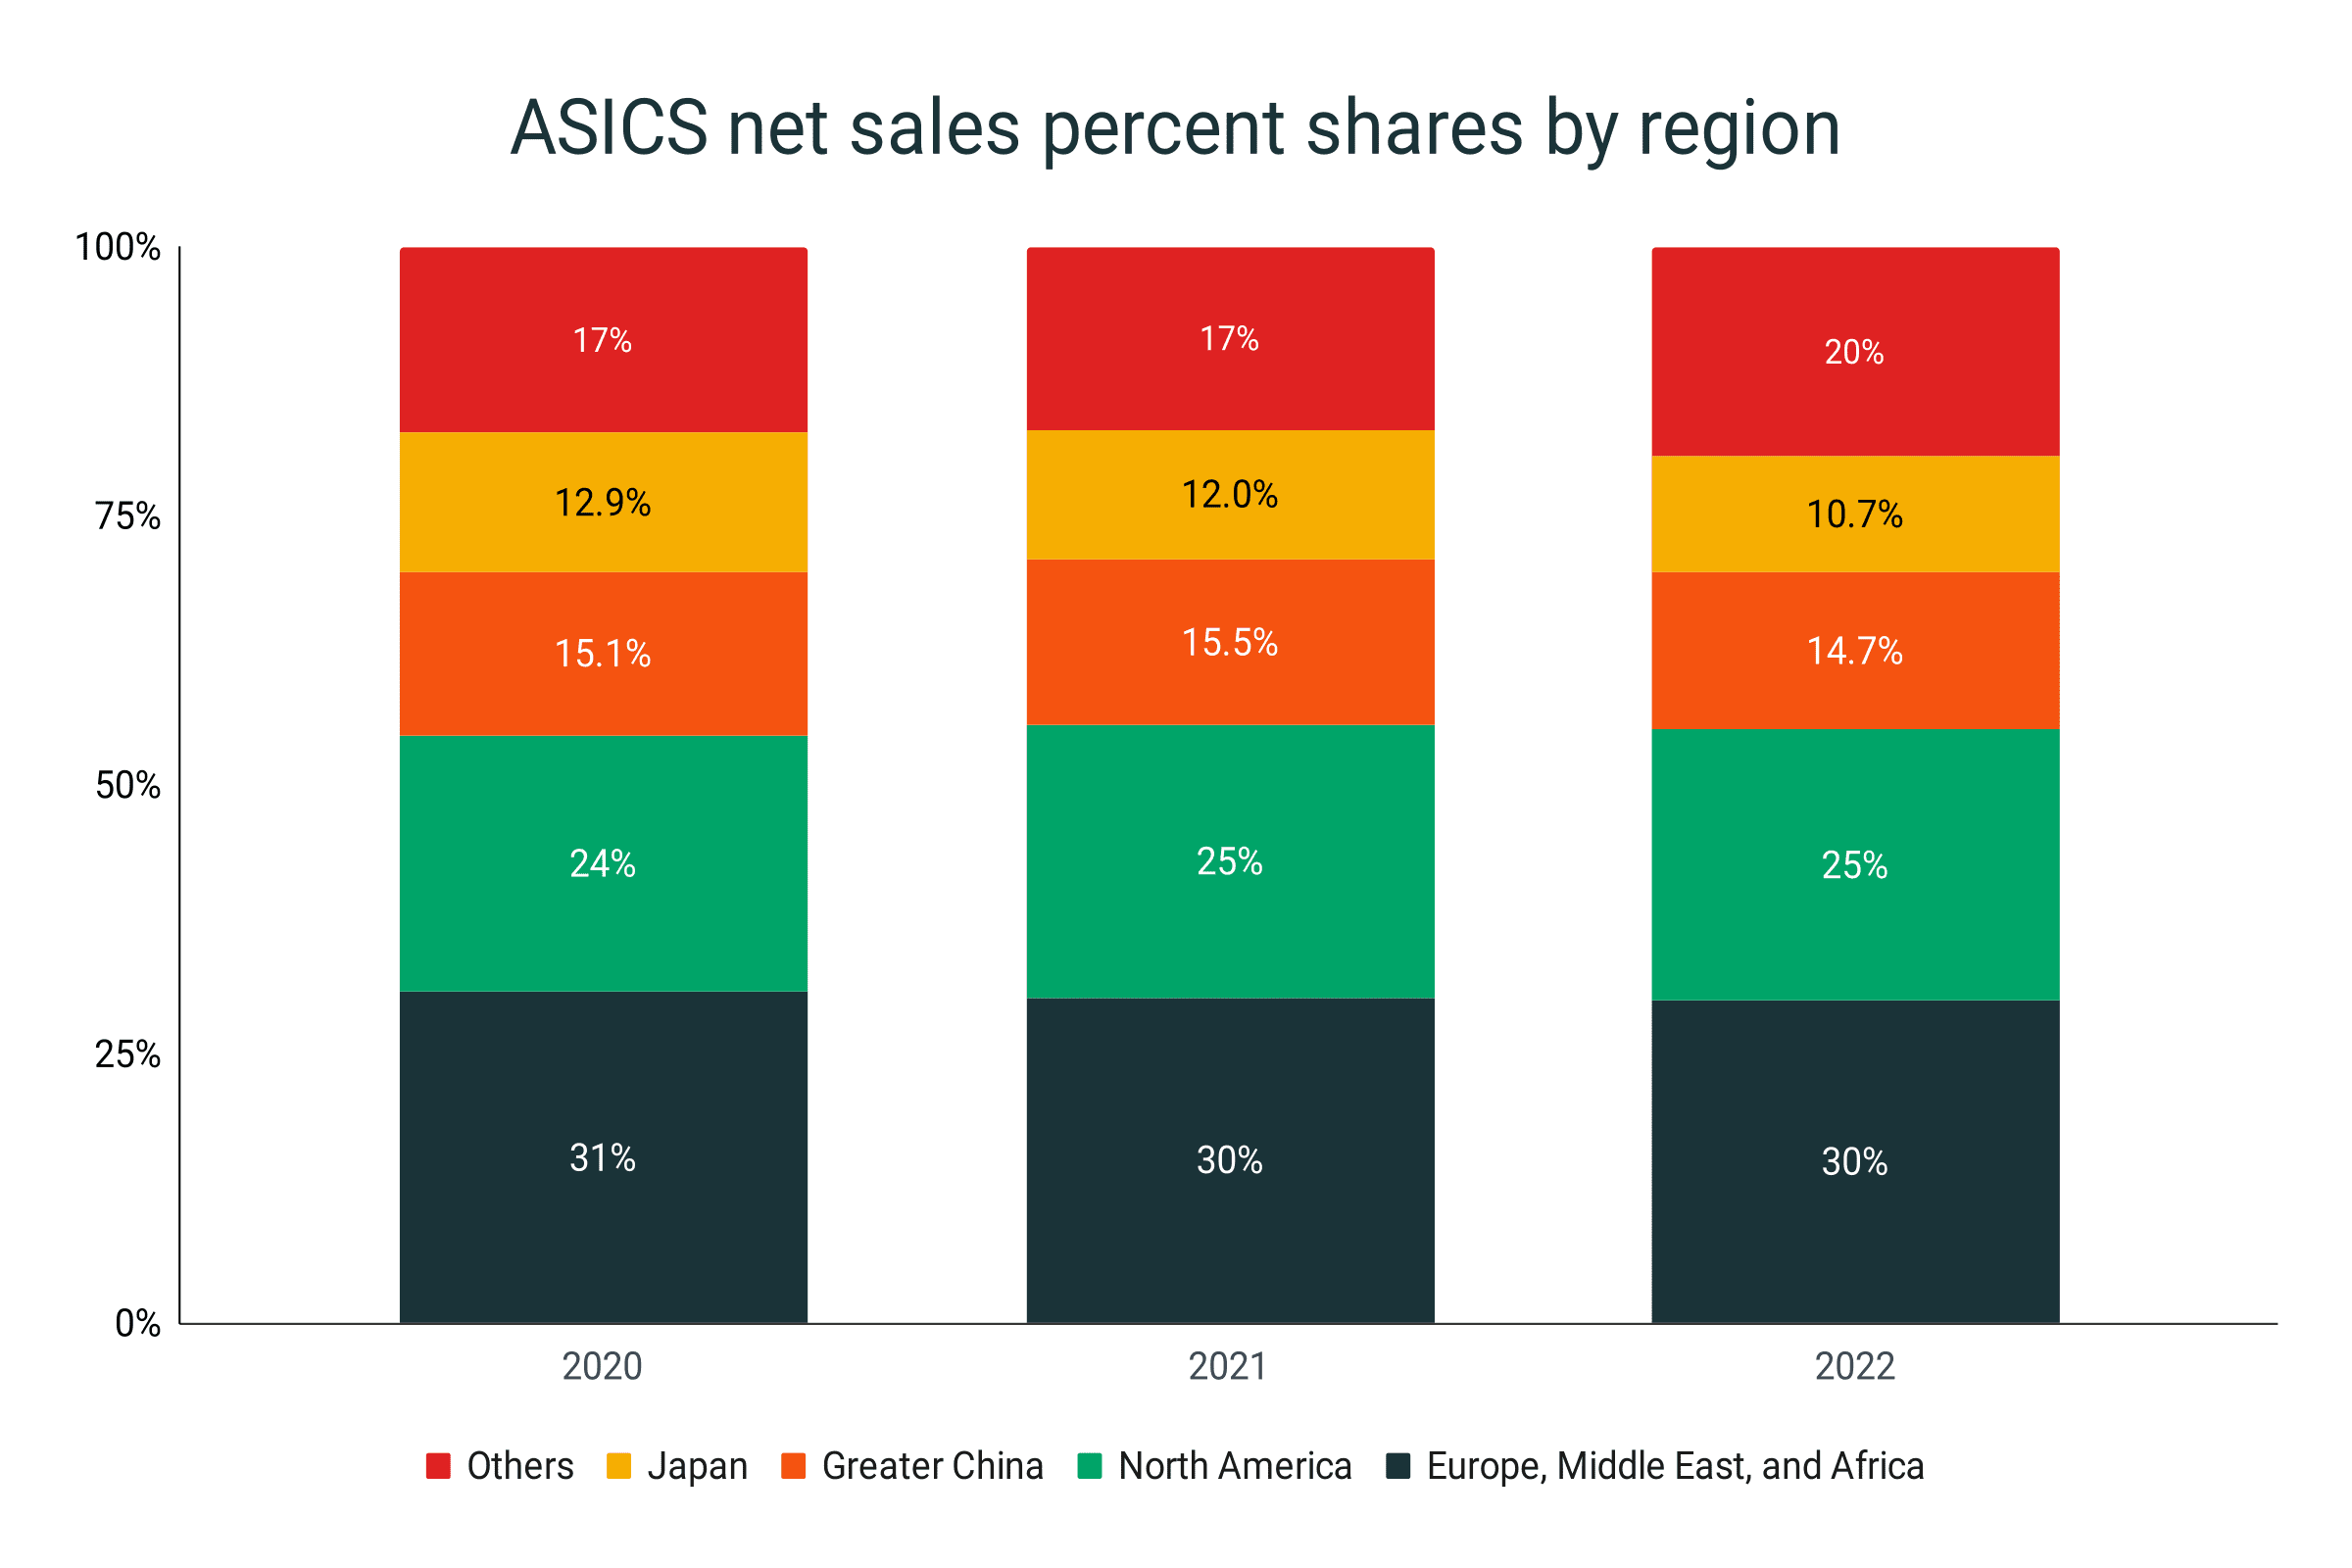
- The combined shoe sales from Europe, Middle East, and Africa (EMEA) region, took up 30% of the entire shoe net sales of the company in 2022.
- However, compared to its output in the previous years, the EMEA region’s net sales share saw a downward trend. The region had 30.7% and 30.3% in 2020 and 2021, respectively.
- Consistently, the North American market is the second biggest market player for ASICS. In 2022, it contributed 25.1% of its footwear net sales.
- Although this is lower than the 25.2% share in 2021, it is nonetheless a better showing than the 23.9% in 2020.
- Meanwhile, the percentage share of the Greater China market also saw a decline. From a 15.1% portion in 2020, it plummeted to 14.7% by the end of 2022.
- Surprisingly, Japan’s contribution to the overall shoe sales of ASICS is also experiencing a rapid decline. In 2022, it only managed to hold 10.7% of the sales.
- Previously, Japan’s net shoe sales percentage share was 12% for 2021 and 12.9% in 2020.
- On the other hand, other emerging markets are slowly catching up with the bigger market players. From a 17% figure in 2021, it has now climbed to 19.5% footing by 2022.
ASICS net sales percent shares by region
|
Year |
Europe, Middle East, and Africa |
North America |
Greater China |
Japan |
Others |
|
2020 |
30.7% |
23.9% |
15.1% |
12.9% |
17.3% |
|
2021 |
30.3% |
25.2% |
15.5% |
12.0% |
17.0% |
|
2022 |
30.0% |
25.1% |
14.7% |
10.7% |
19.5% |
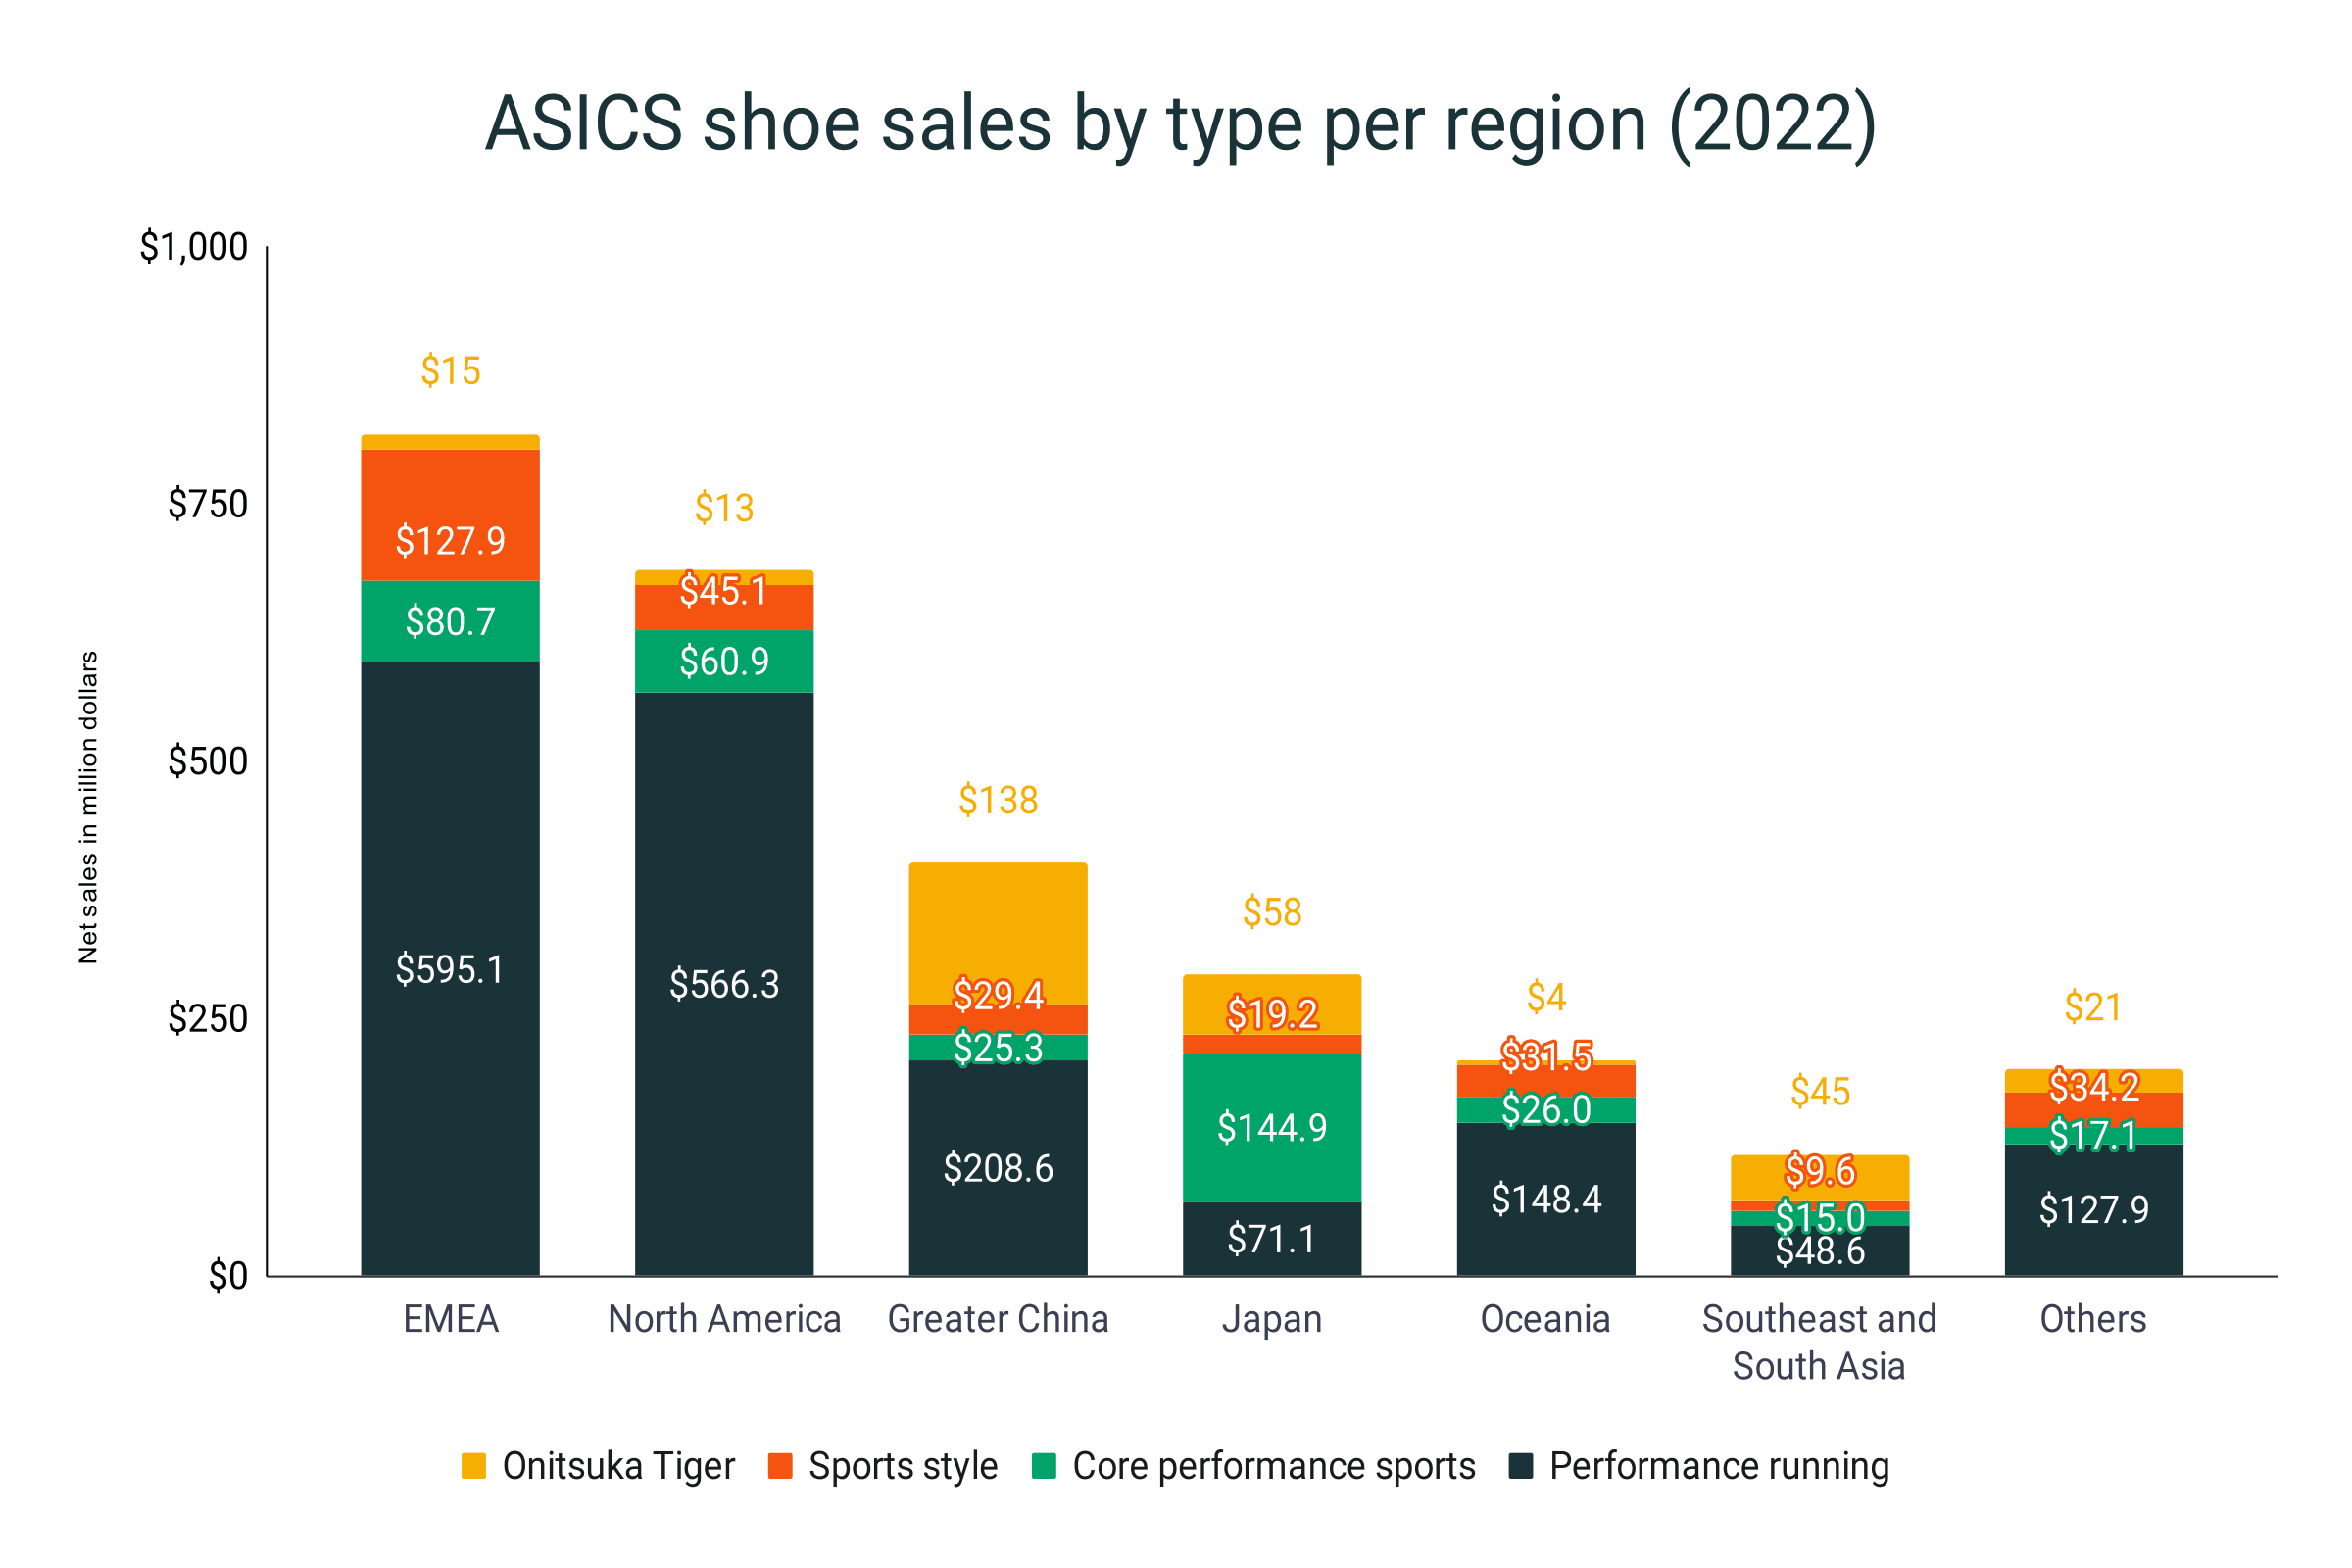
- In 2022, EMEA tallied $818.7 million in total footwear sales. The key players were performance running and sports style shoes which contributed $595.1 million and $127.9 million, respectively.
- The North American market, which generated a total of $685.3 million in shoe sales, is slightly different. Running and core performance shoes were the top two market drivers with $566.3 million and $60.9 million, respectively.
- Running shoes and Onitsuka Tiger were the dominant sales contributors in the Greater China market. The two pulled in $208.6 million and $139.2 million, respectively, in 2022.
- Core performance shoes were the top sales contributor in Japan. In 2022, the segment raked in $144.9 million.
- Oceania accumulated a total footwear sales of $210 million.
- Southeast and South Asia combined garnered $118.3 million in shoe sales by the end of 2022.
- Meanwhile, other emerging markets totaled $200.4 million in the same year.
ASICS shoe sales by type per region (2022)
|
Shoe type |
Performance running |
Core performance sports |
Sports style |
Onitsuka Tiger |
Total |
|
EMEA |
$595.1 |
$80.7 |
$127.9 |
$15.0 |
$818.7 |
|
North America |
$566.3 |
$60.9 |
$45.1 |
$13.0 |
$685.3 |
|
Greater China |
$208.6 |
$25.3 |
$29.4 |
$138.2 |
$401.5 |
|
Japan |
$71.1 |
$144.9 |
$19.2 |
$57.5 |
$292.7 |
|
Oceania |
$148.4 |
$26.0 |
$31.5 |
$4.1 |
$210.0 |
|
Southeast and South Asia |
$48.6 |
$15.0 |
$9.6 |
$45.1 |
$118.3 |
|
Others |
$127.9 |
$17.1 |
$34.2 |
$21.2 |
$200.4 |
ASICS shoe market share
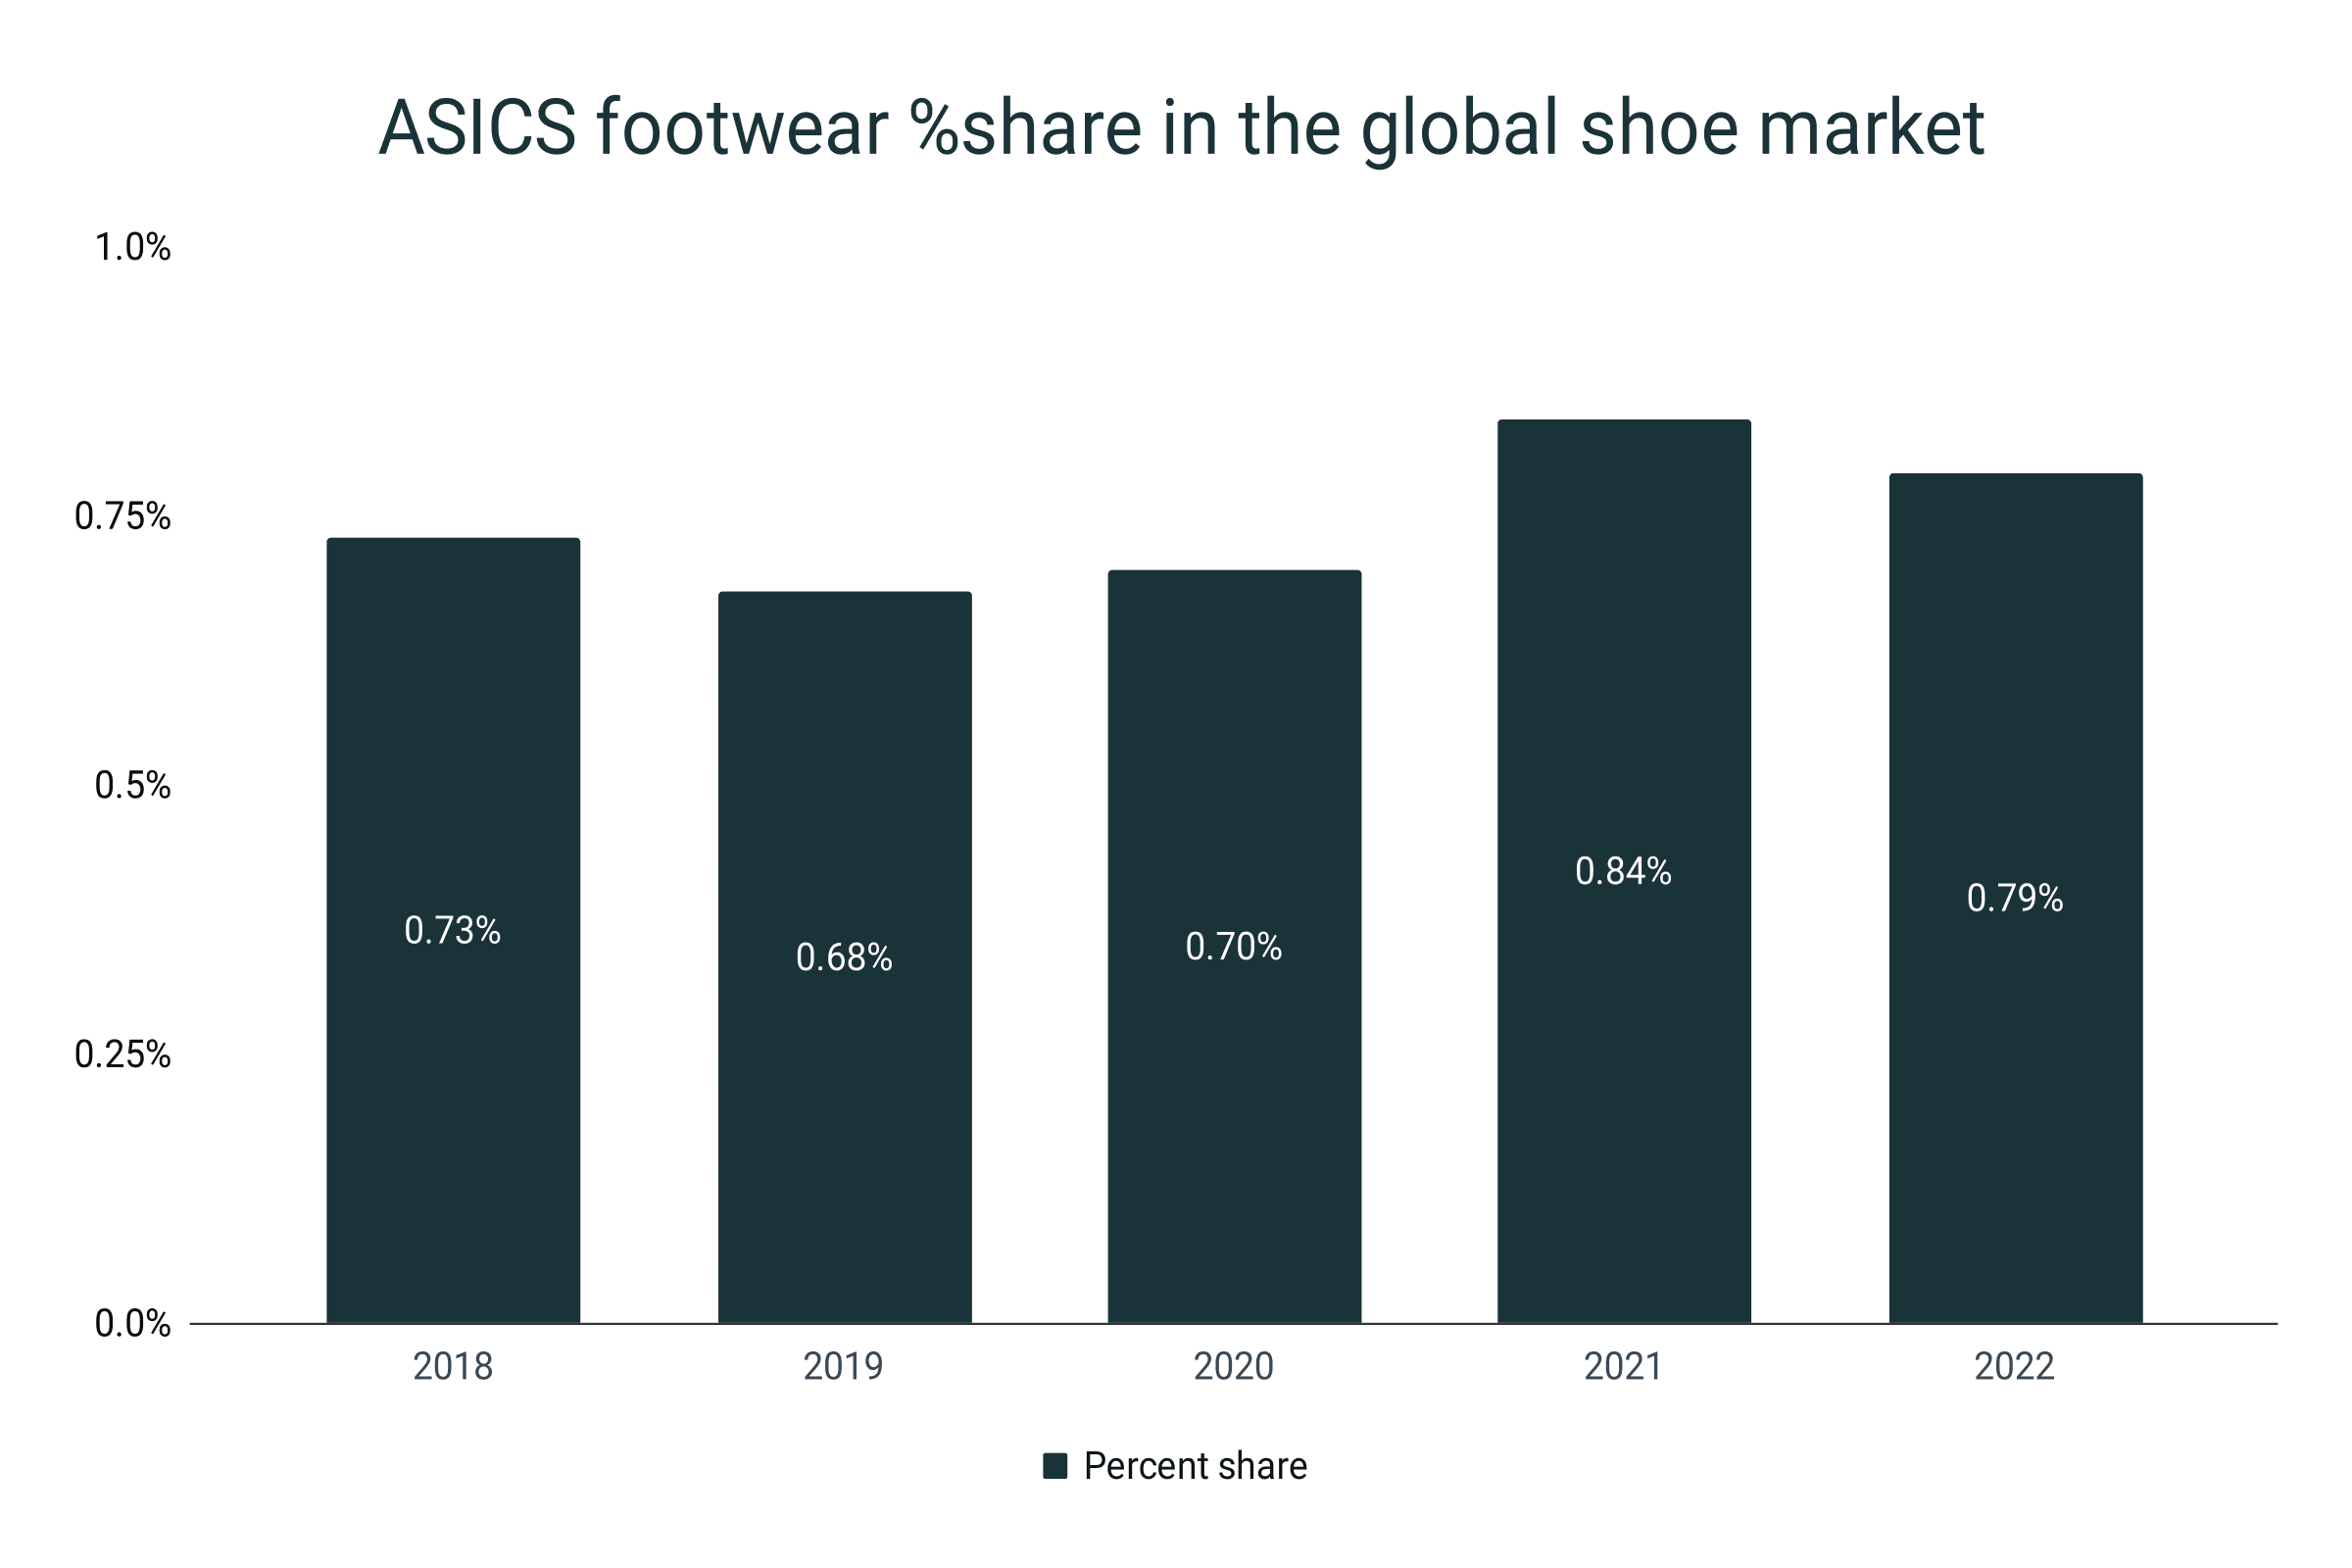
- Globally, ASICS held a 0.79% share of the entire shoe industry in 2022.
- This is lower than the 0.84% showing in 2021. This 2021 number is also the best output of the company over the last 5 years.
- From 2018 to 2020, ASICS occupied 0.73%, 0.68%, and 0.70% of the global footwear market.
- The five-year average for the ASICS global shoe market portion is 0.75%.
- In the United States, ASICS holds about 4% of the athletic footwear market.
- Back in 2014, the company’s share in the US athletic shoe market was 4.2%.
ASICS footwear %share in the global shoe market
|
Year |
Percent share |
|
2018 |
0.73% |
|
2019 |
0.68% |
|
2020 |
0.70% |
|
2021 |
0.84% |
|
2022 |
0.79% |
ASICS shoe production
- 40% of all ASICS shoes are made in Vietnam.
- Data from 2017 says that 50% of ASICS shoes were for men and another 50% were for women.
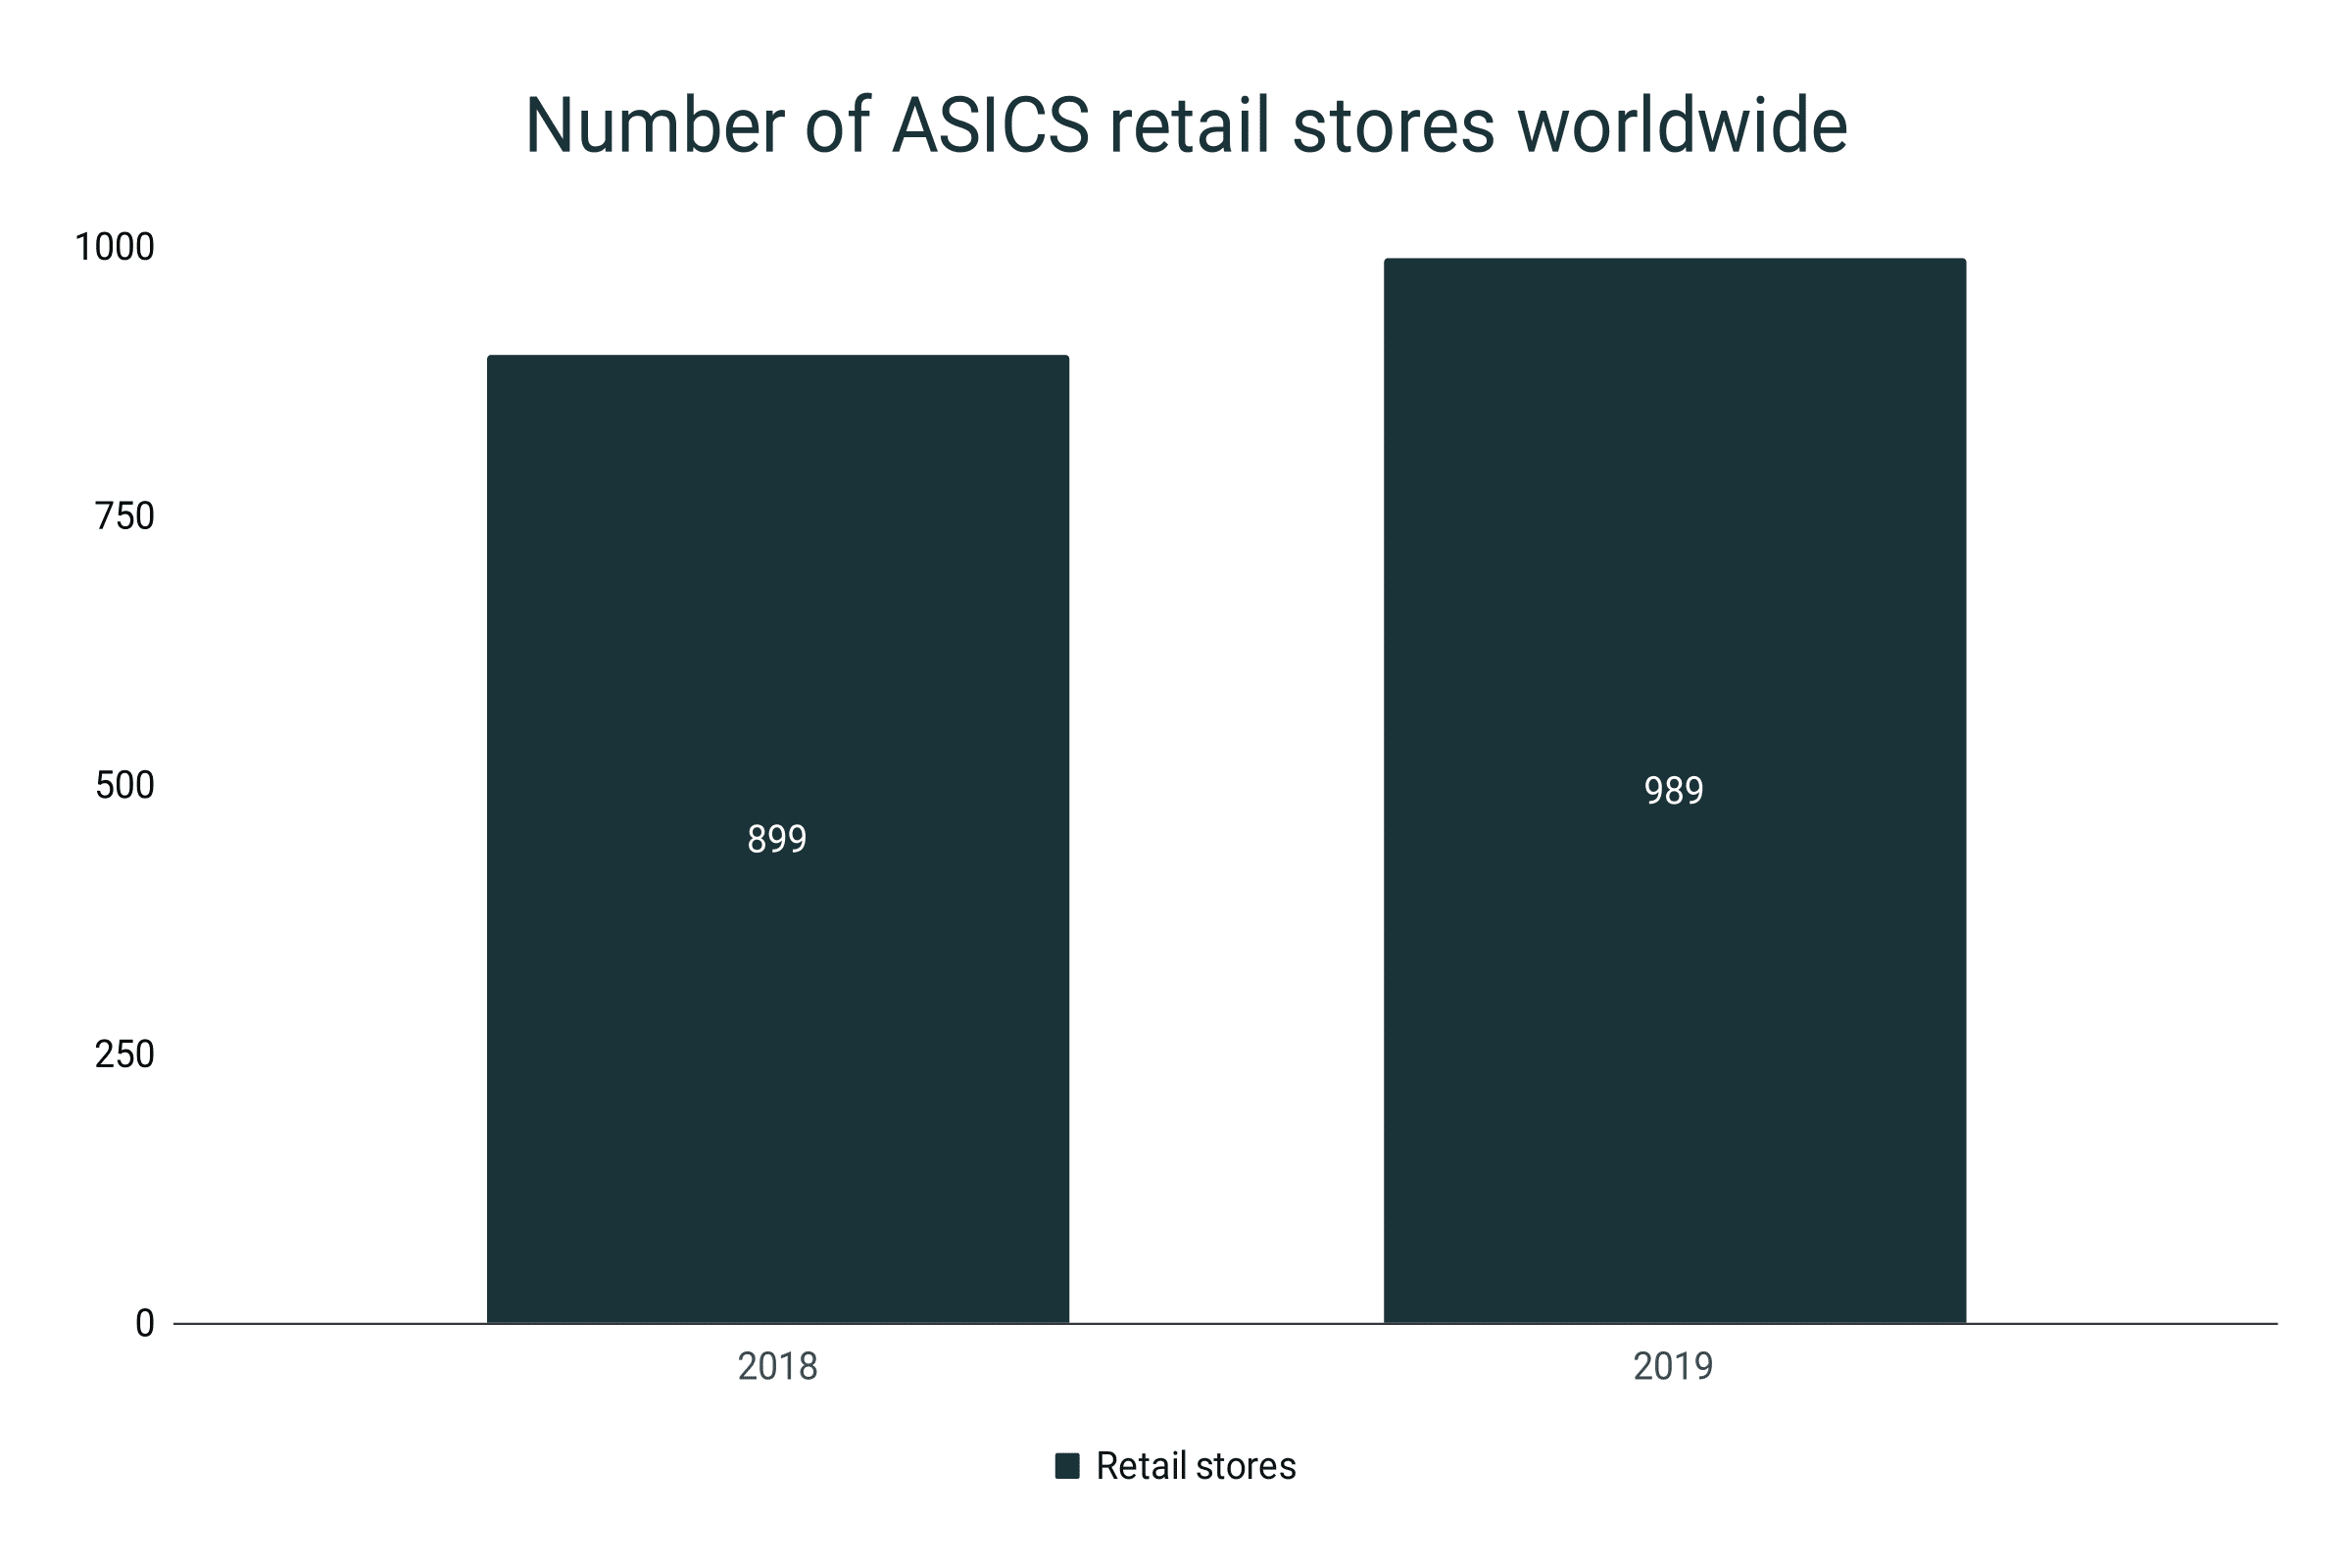
- In 2019, about 989 ASICS retail stores were active worldwide.
- This is a 10% growth compared to the 899 retail stores in 2018.
- As of 2023, about 484 ASICS stores are present in the United Kingdom alone.
Number of ASICS retail stores worldwide
|
Year |
Retail stores |
Growth |
|
2018 |
899 |
|
|
2019 |
989 |
10% |
Average weight of ASICS shoes
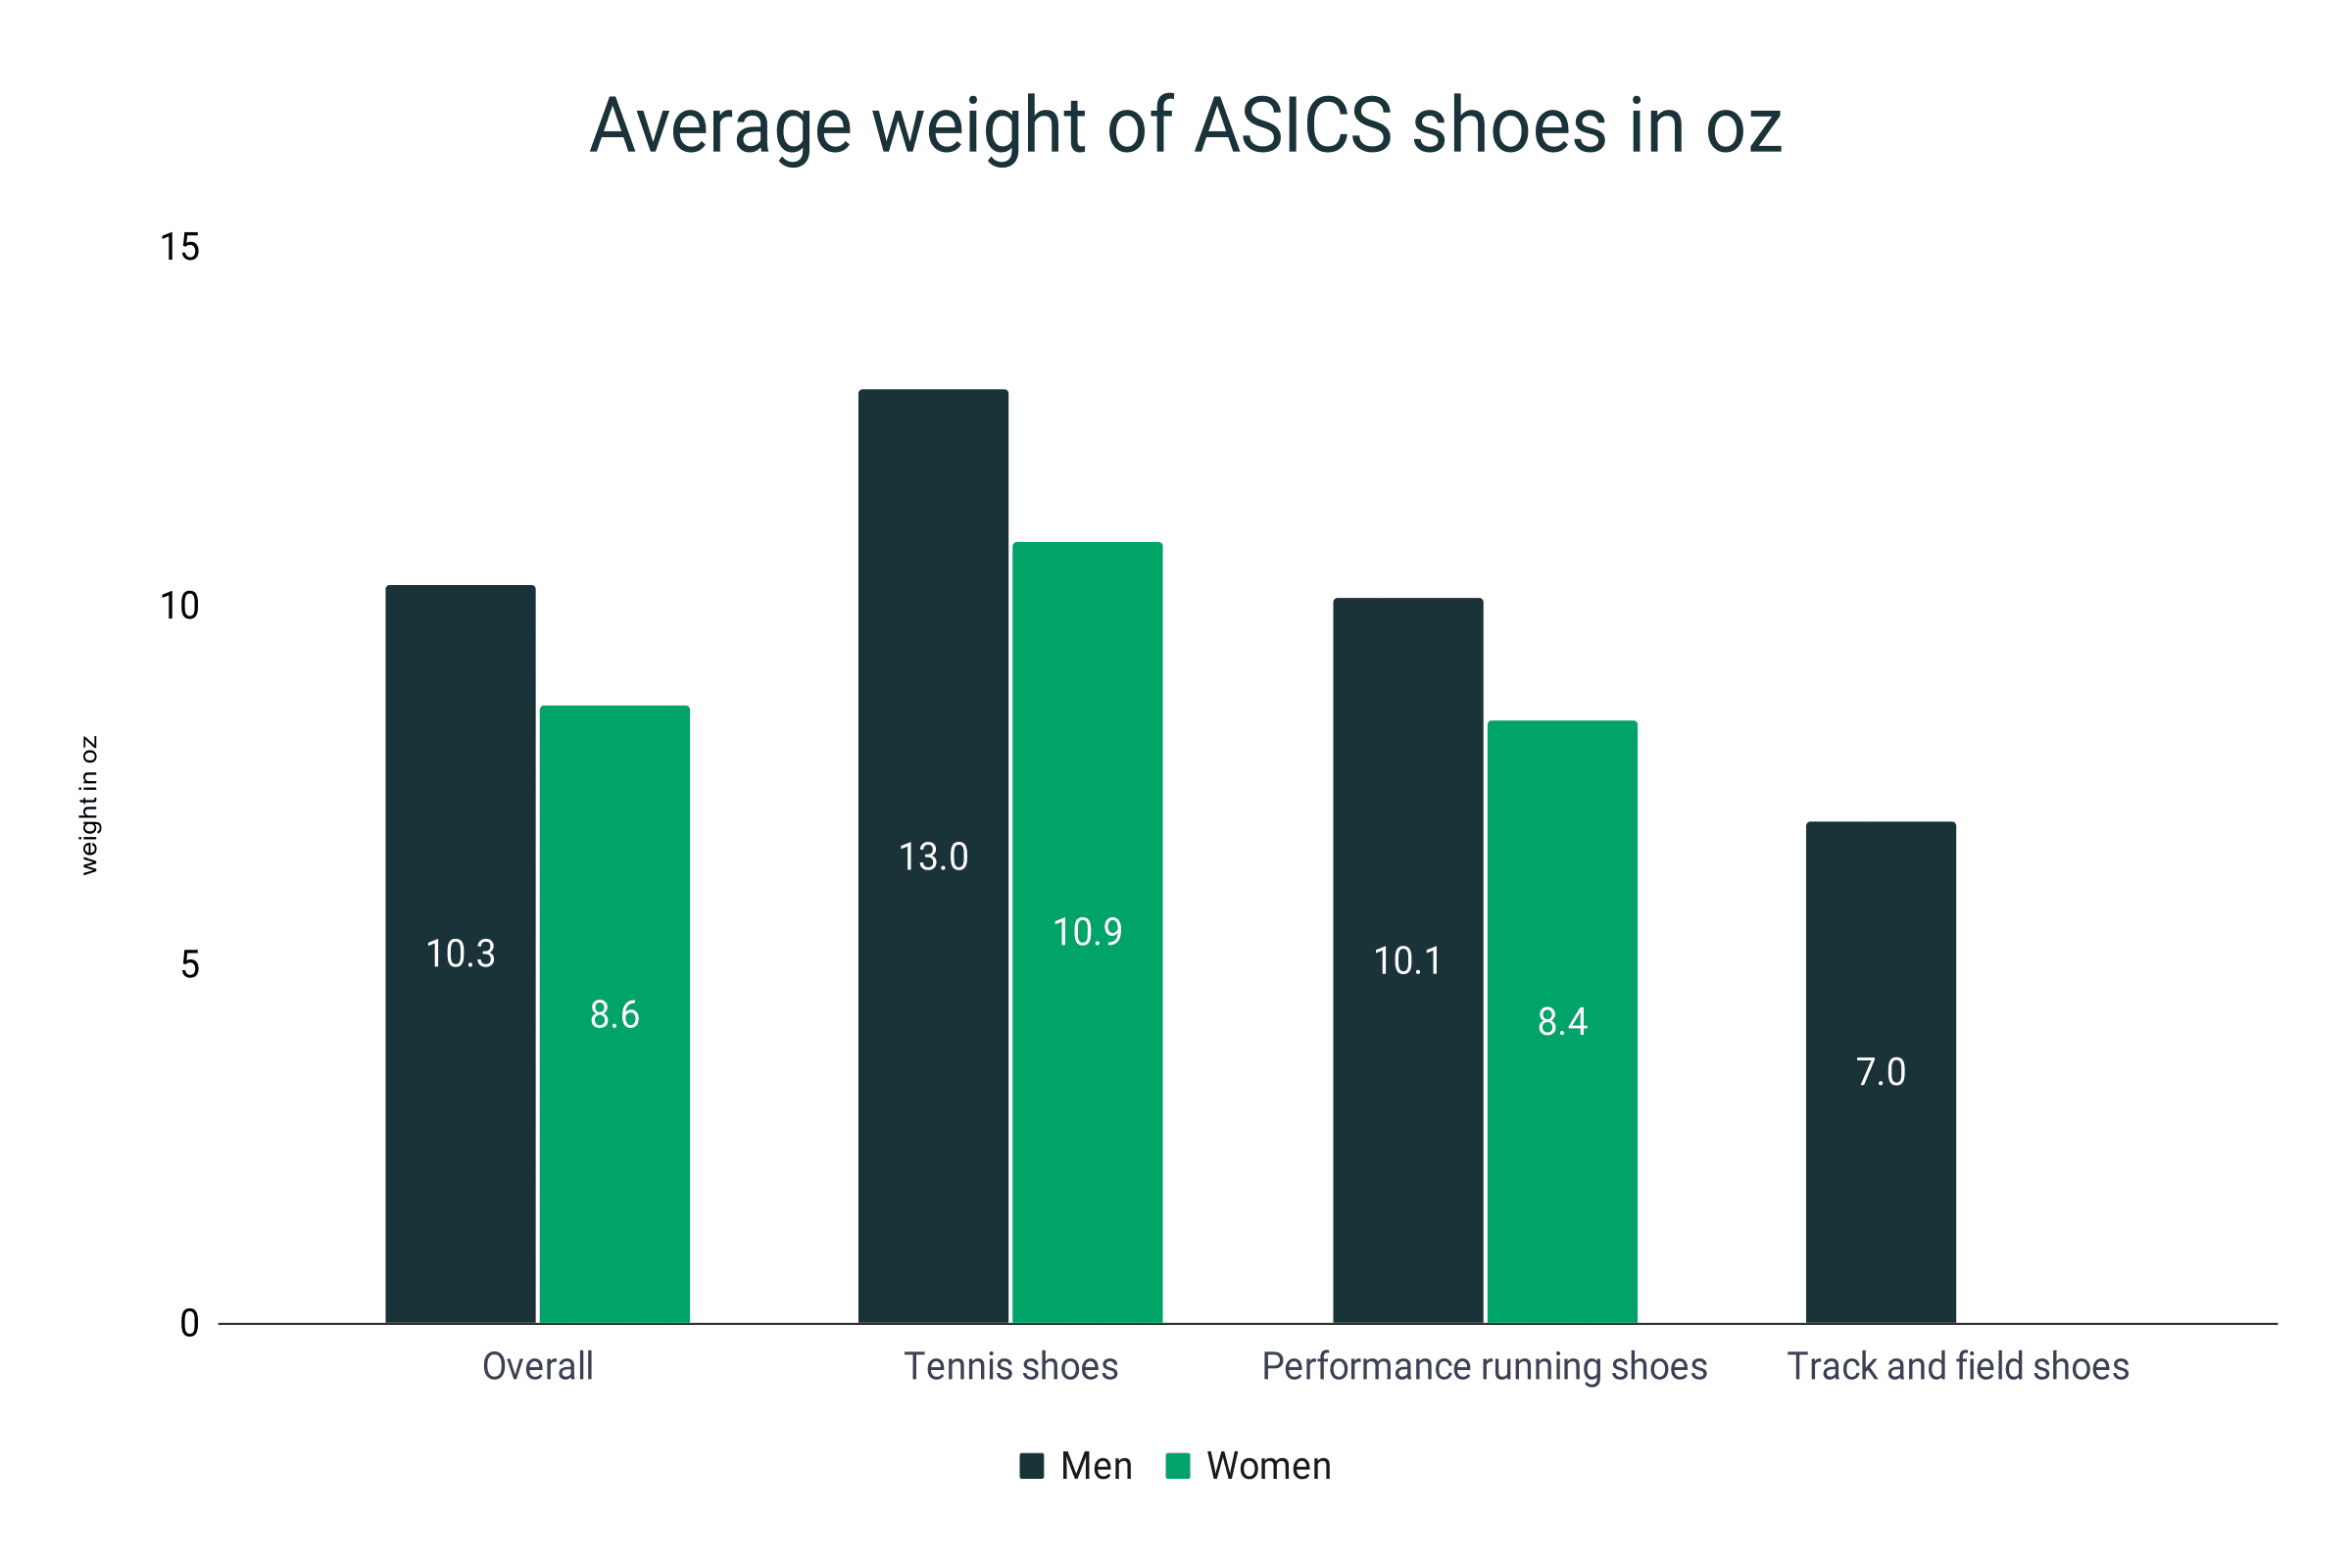
- The average weight of ASICS shoes for men is 10.3 oz (290.7g).
- Meanwhile, for women, it is 8.6 oz(244.8g)
- In terms of tennis shoes, the mean weight is 13 oz (368.4g) for men and 10.9 oz (308.9g) for women.
- Men’s running shoes from ASICS weigh 10.1 oz (286.3g) on average.
- On the other hand, ASICS women’s performance running shoes have a mean weight of 8.4 oz (239.2g).
- Track and field shoes from ASICS average about 7 oz (199.7g) by weight.
Average weight of ASICS shoes in oz
|
Type |
Men |
Women |
|
Overall |
10.3 |
8.6 |
|
Tennis shoes |
13 |
10.9 |
|
Performance running shoes |
10.1 |
8.4 |
|
Track and field shoes |
7 |
No data |
Average ASICS shoe prices in 2023
- Based on the RunRepeat database, the overall average price of all ASICS shoes (including Onitsuka Tiger) in 2023 is $114.
- The running shoes, on the other hand, have a retail average of $118.8.
- The combined average cost of various core sports shoes on the database is $110.9.
- Meanwhile, ASICS sports style sneakers retail for $109.6 on average.
- Onitsuka Tiger sneakers have a mean price tag of $102.8.
Average price of ASICS shoes
|
Shoe type |
Average price |
|
Performance running shoes |
$118.8 |
|
Core sports shoes (soccer, golf, tennis, track and field) |
$110.9 |
|
Sports style (sneakers) |
$109.6 |
|
Onitsuka Tiger (sneakers) |
$102.8 |
|
Overall |
$114.0 |
