The State of Trail Running 2022
NEW: The State of US Marathons 2025
This report covers trail running race participation from 1984 to 2022. It includes 15.6 million race results from 116.947 races in 127 countries. It’s the most extensive report on trail running participation ever conducted. The report was done in collaboration with World Athletics.
For journalists or academia: reach out to jens@runrepeat.com for questions, and feel free to use data, charts, and quotes from the report.
For further reading, check out The State of Running with World Athletics (WA) and The State of Ultra Running with the International Association of Ultrarunners (IAU).
Key conclusions
- Trail running has grown 231% in the last 10 years.
- Covid-19 cut trail running participation by 97% comparing April 2020 with April 2019.
- Despite a strong comeback in race participation, 2022 has had 15% fewer finishers than in 2019.
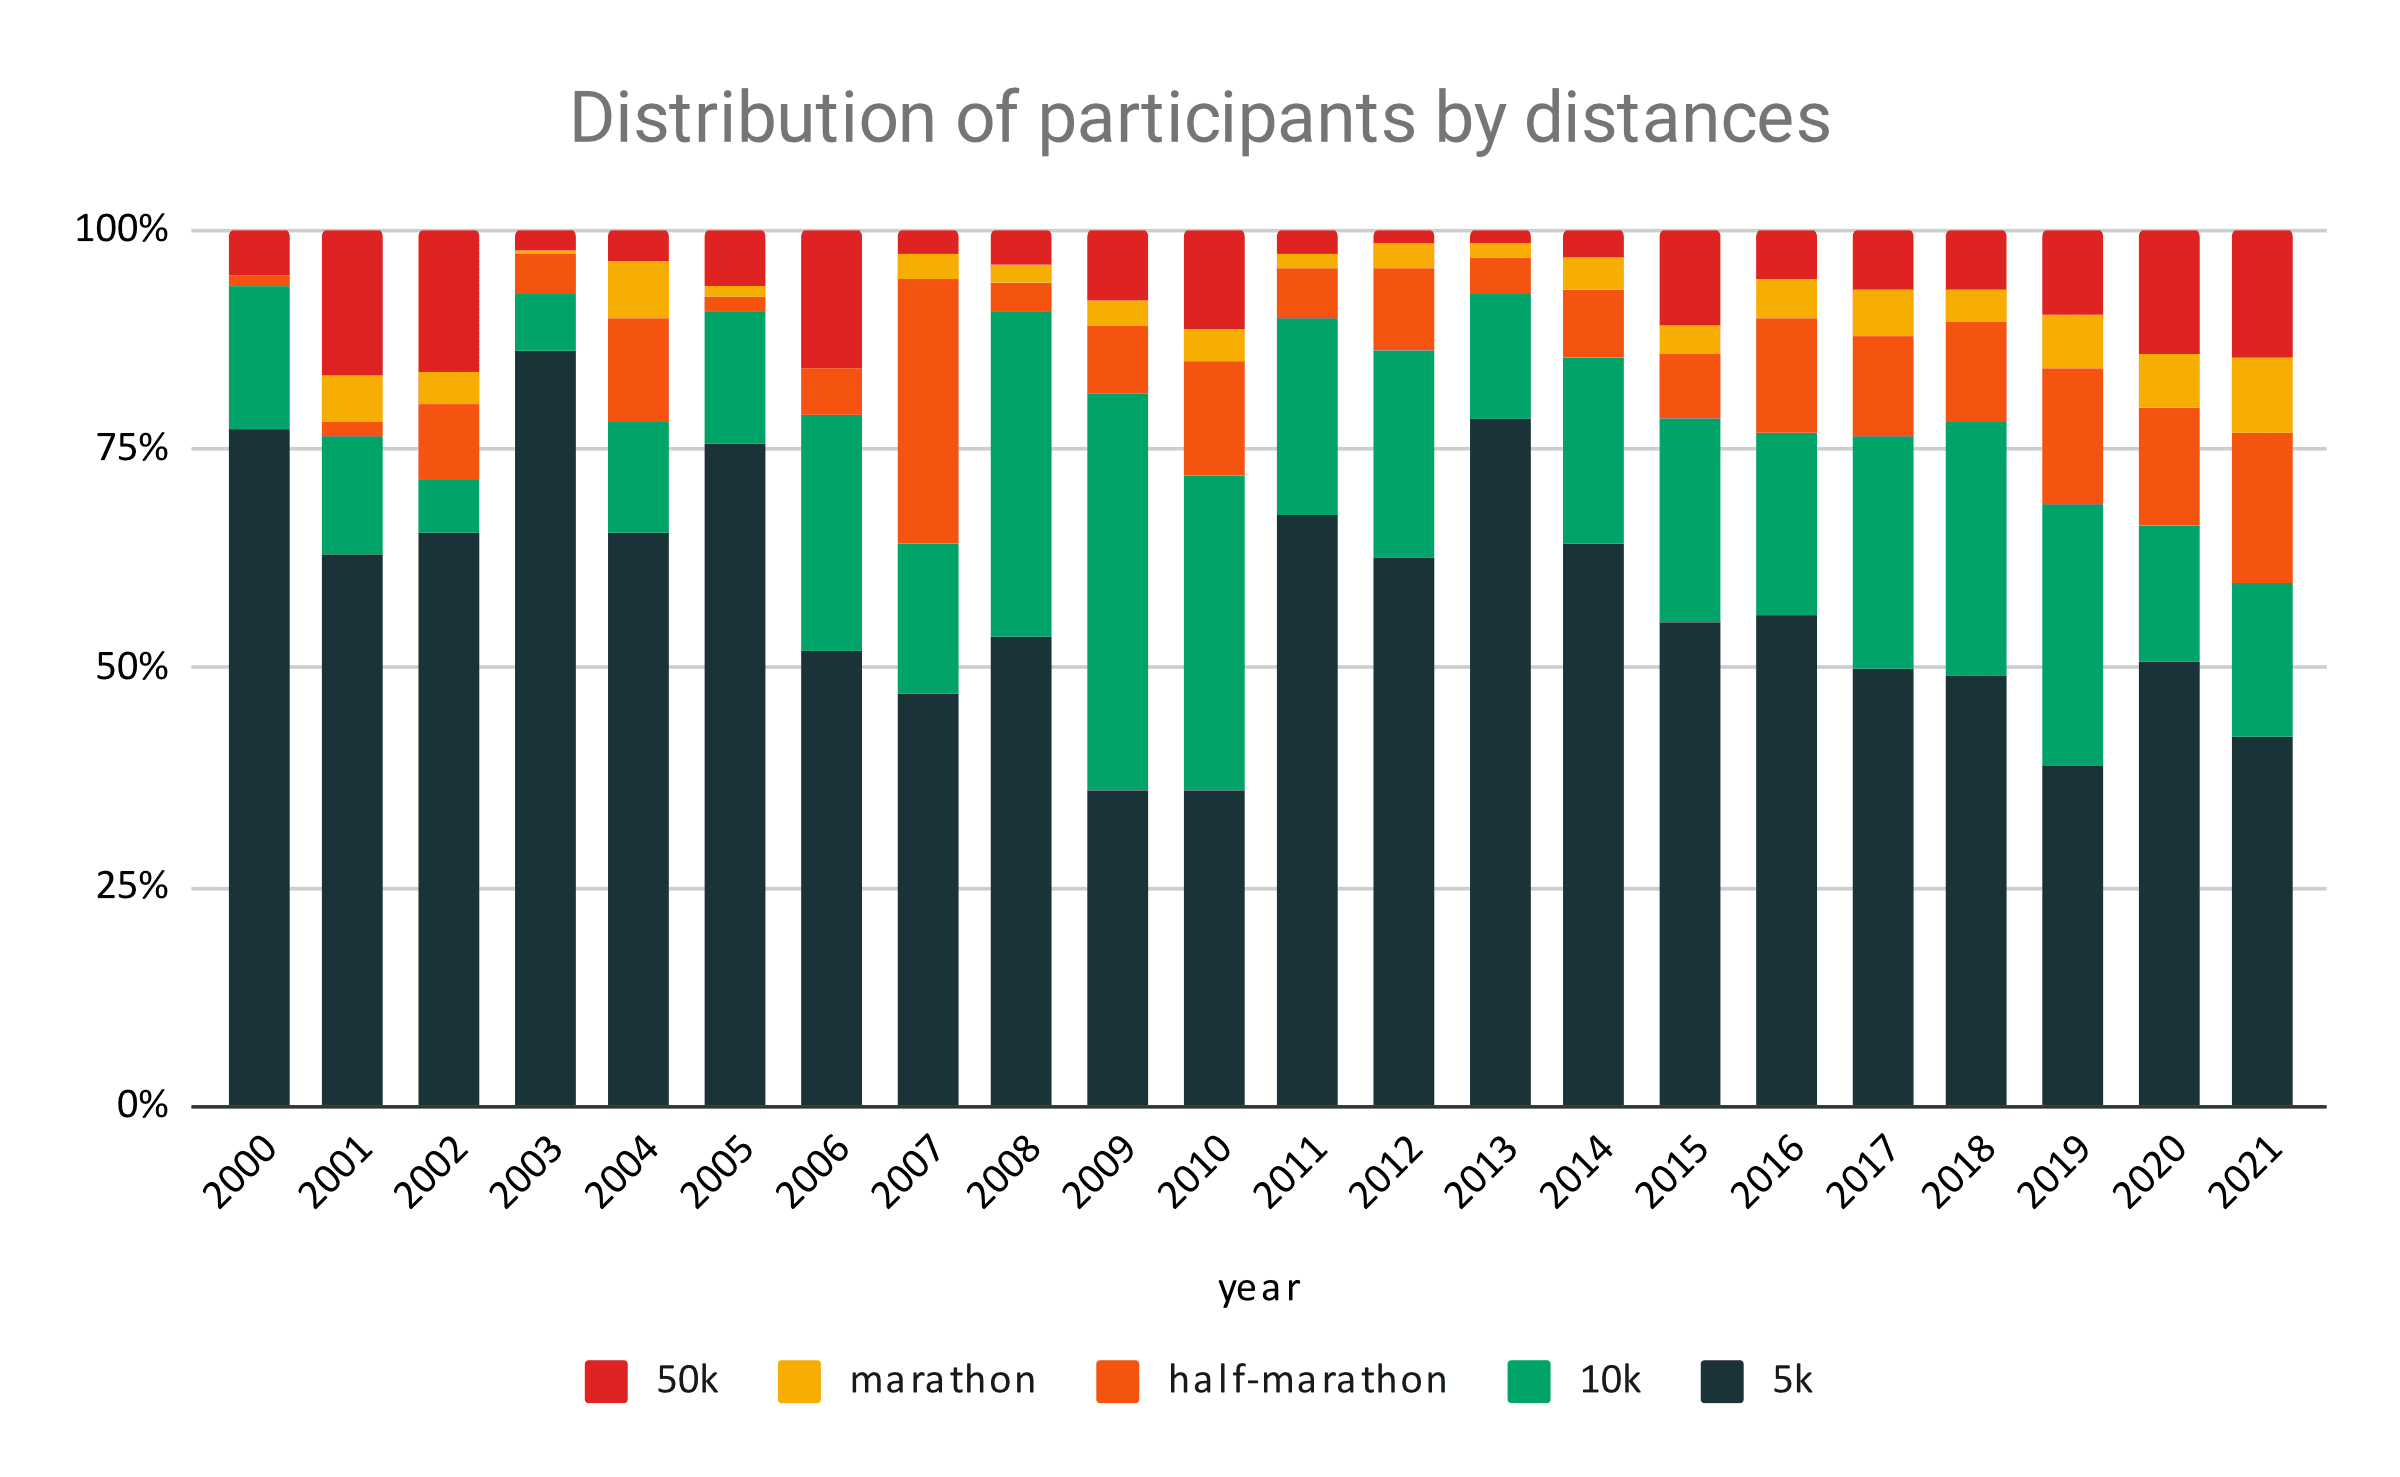
- Races are getting longer than ever. The 5k distance used to account for 75% of all races, now it accounts for only 45%. Trail races are on average 24.63 km long, which is 140% longer than road races.
- Trail running is unique compared to road running by having an extreme diversity in distances, whereas road running is centred a lot around the classic 5k, 10k, half marathon, and marathon.
- Races are getting bigger. In 1984, 72% of all runners finished a race with less than 500 participants. Today that number is just 12%.
- Trail running races have 91% fewer participants per race compared to road running races, so while the races are getting bigger, they’re still smaller than road races.
- Small races (<500 participants) have grown 629% in the last 10 years, whereas big races have grown 5252% in the same time period.
- The pace differences between men and women decrease as the distance increases, and at distances above 195 miles, women are actually faster than men.
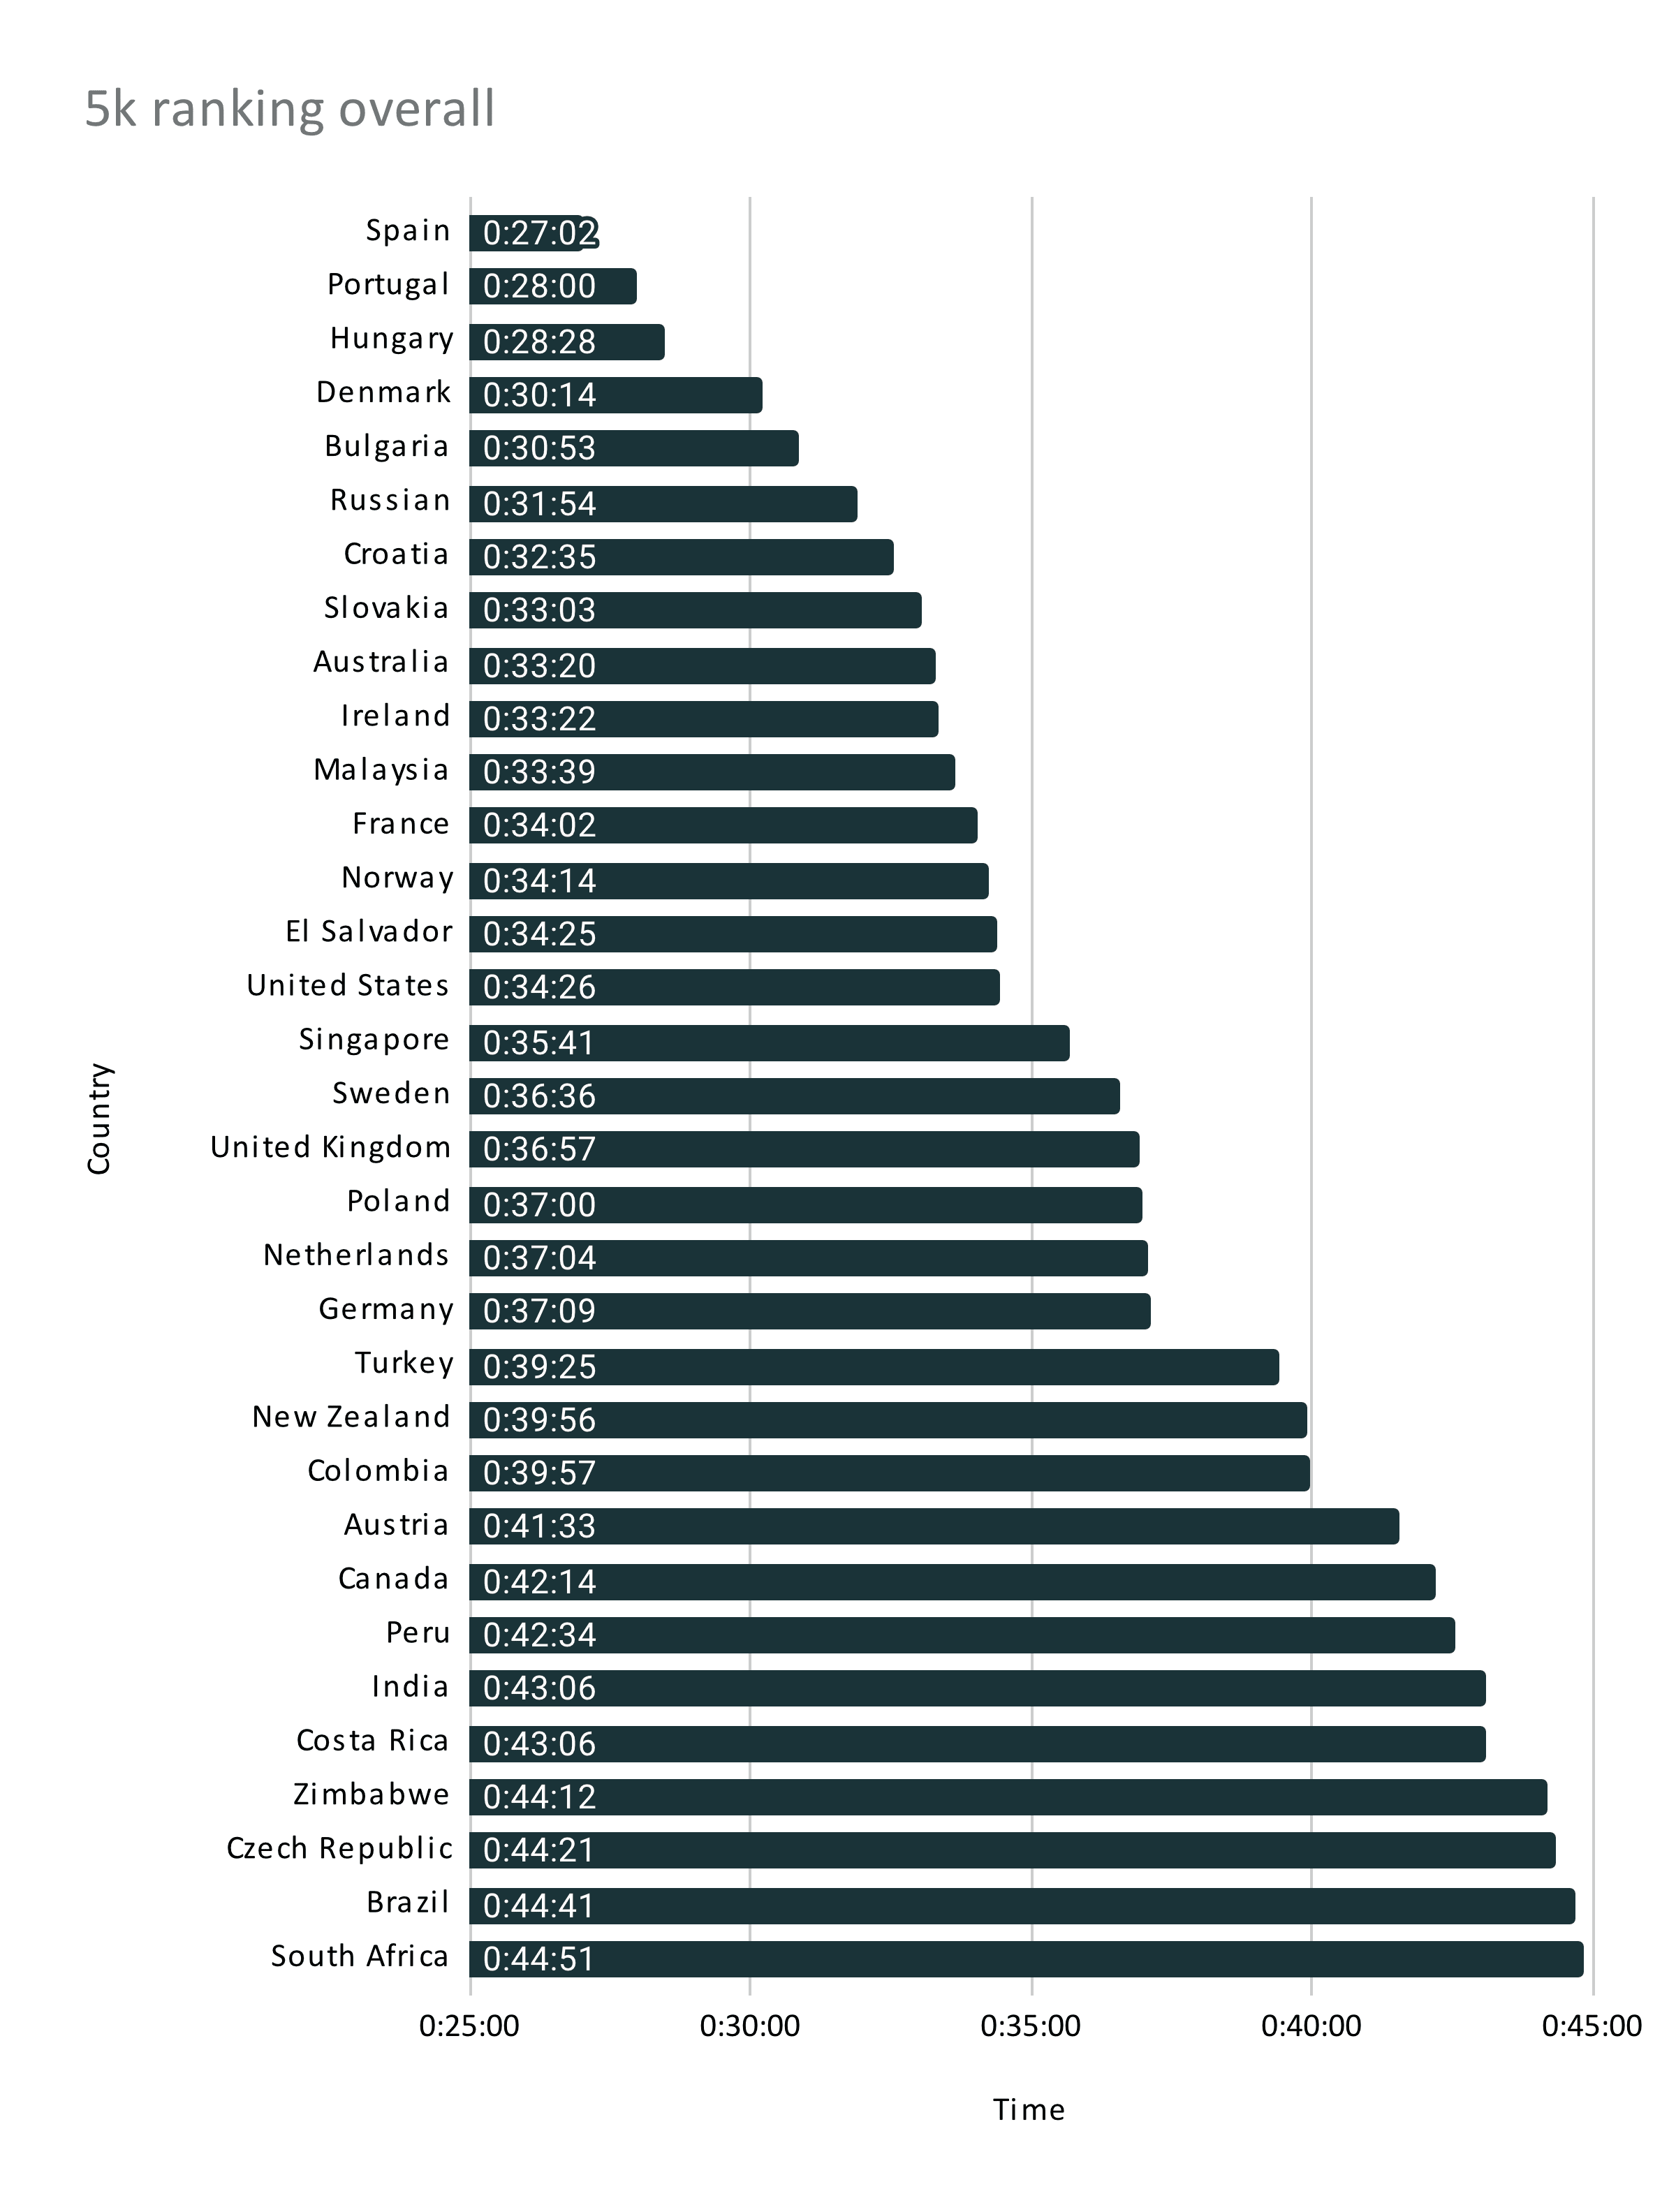
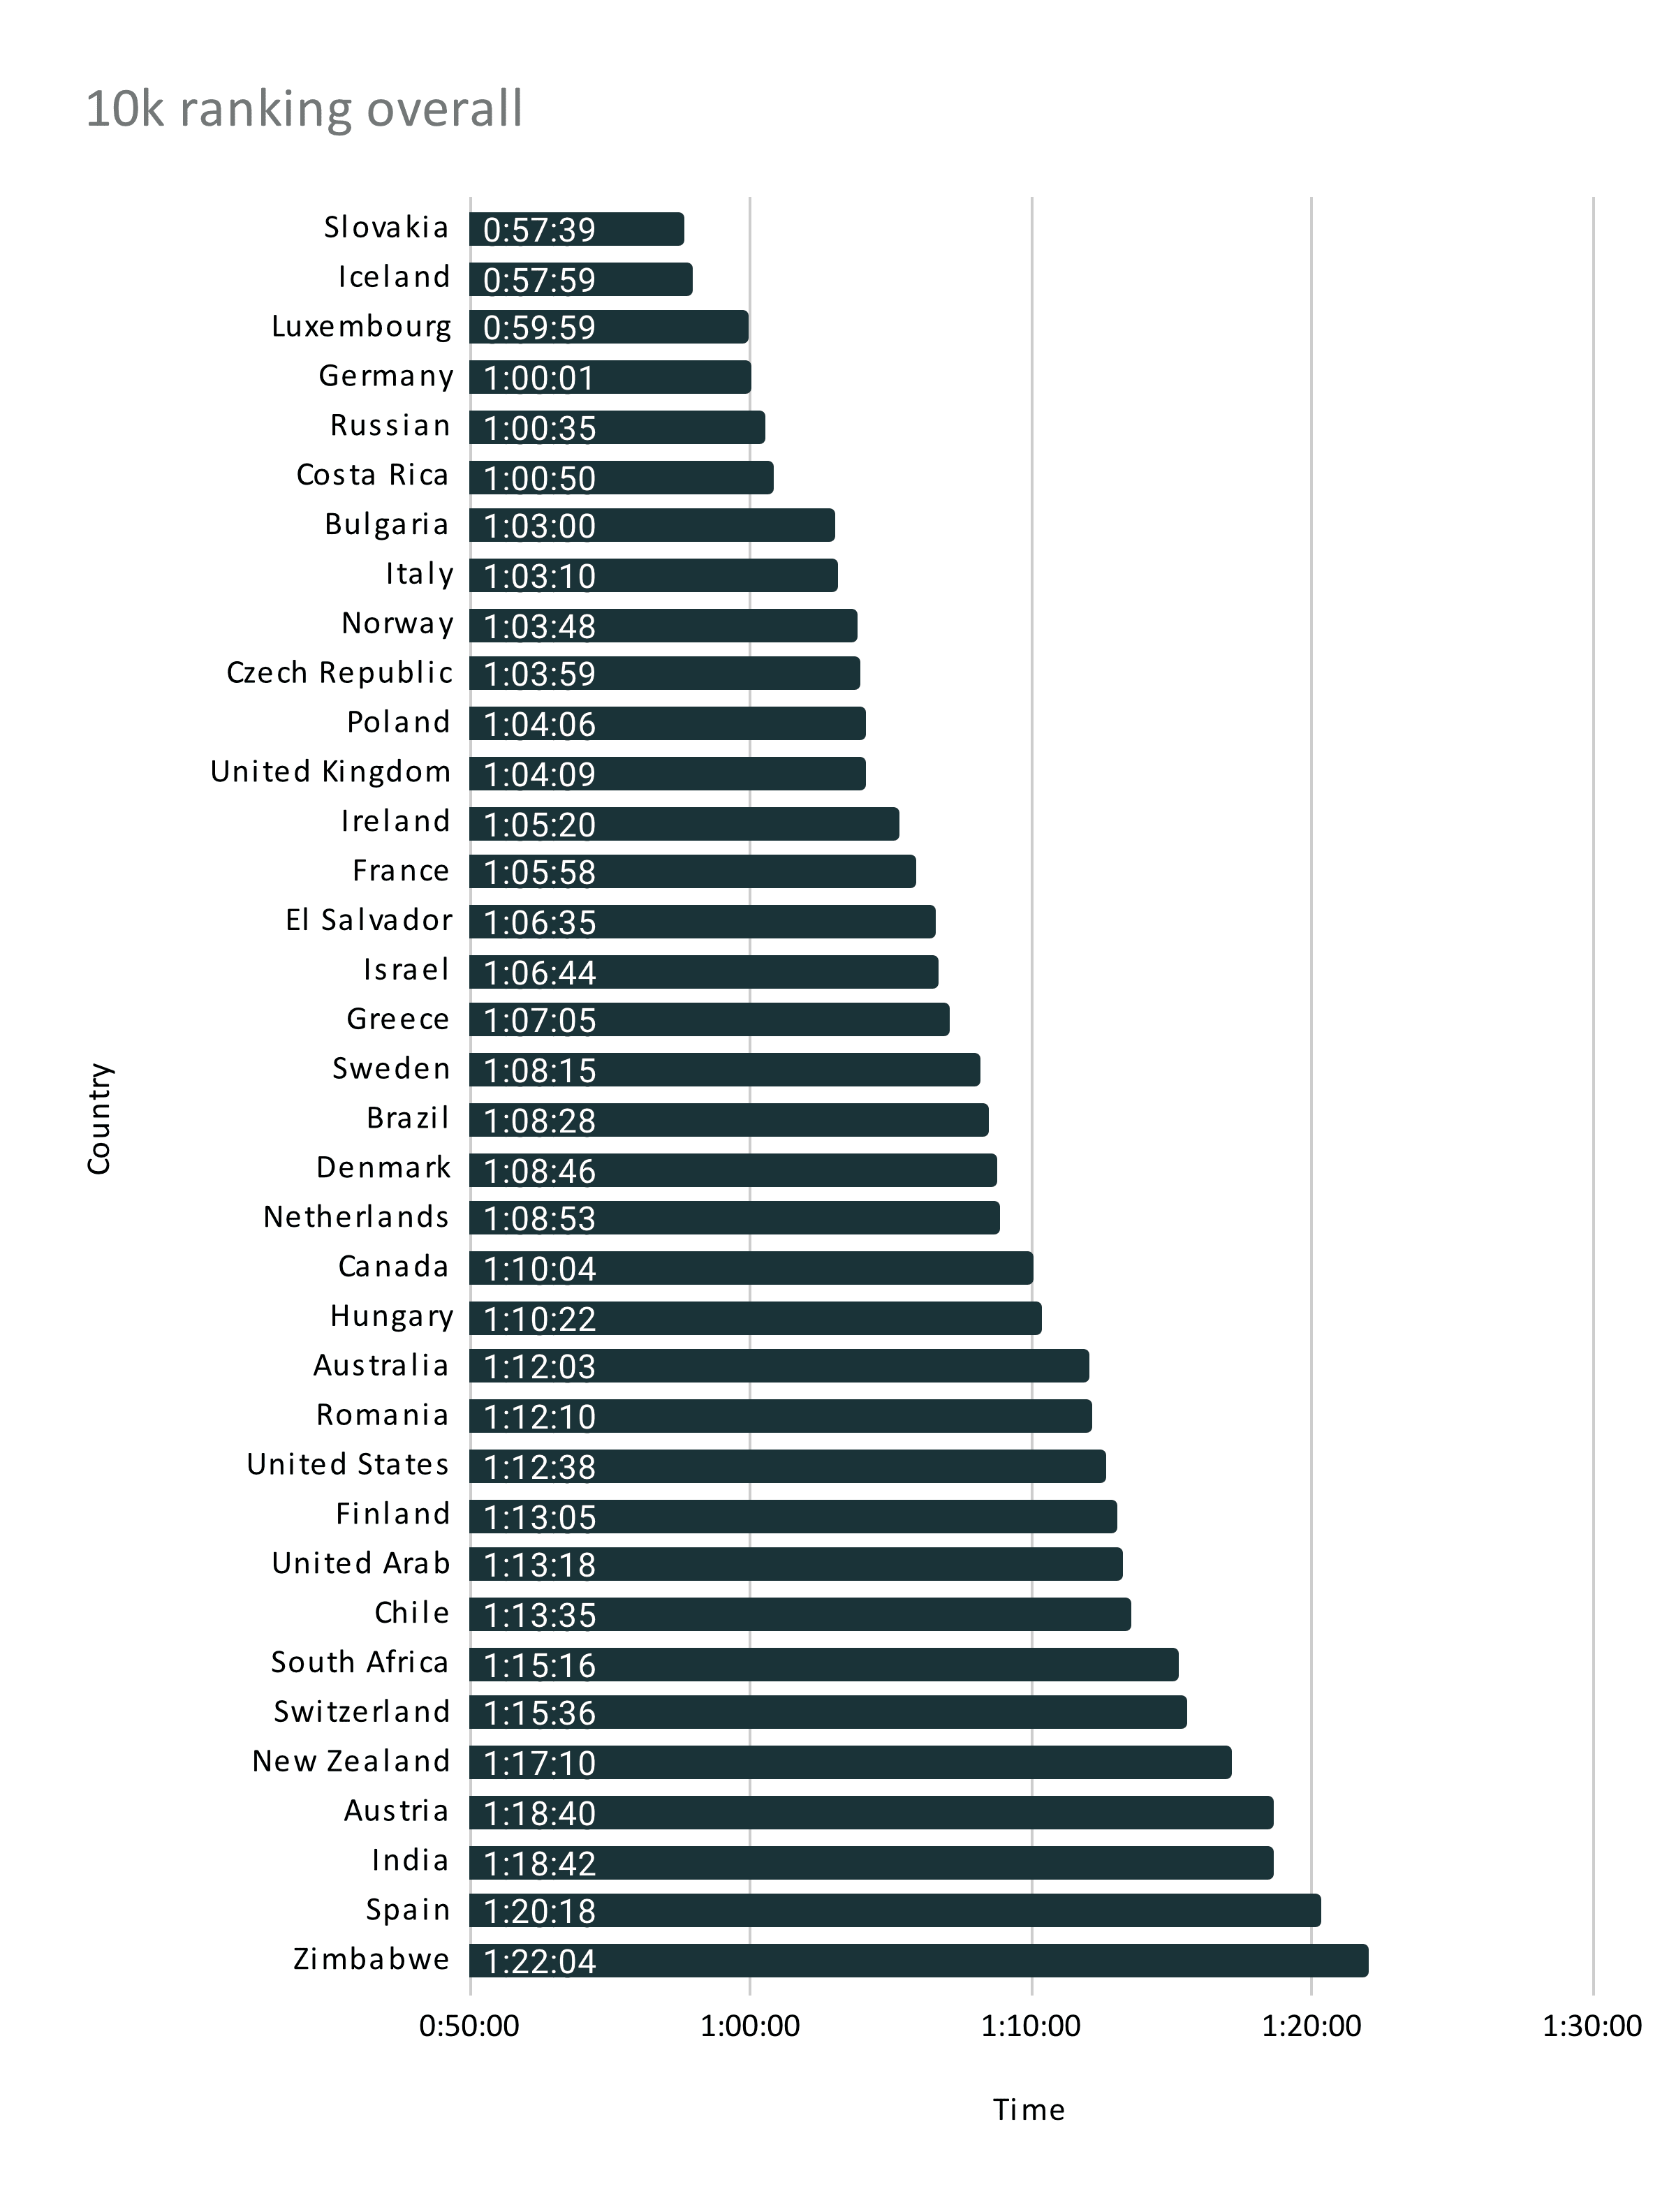
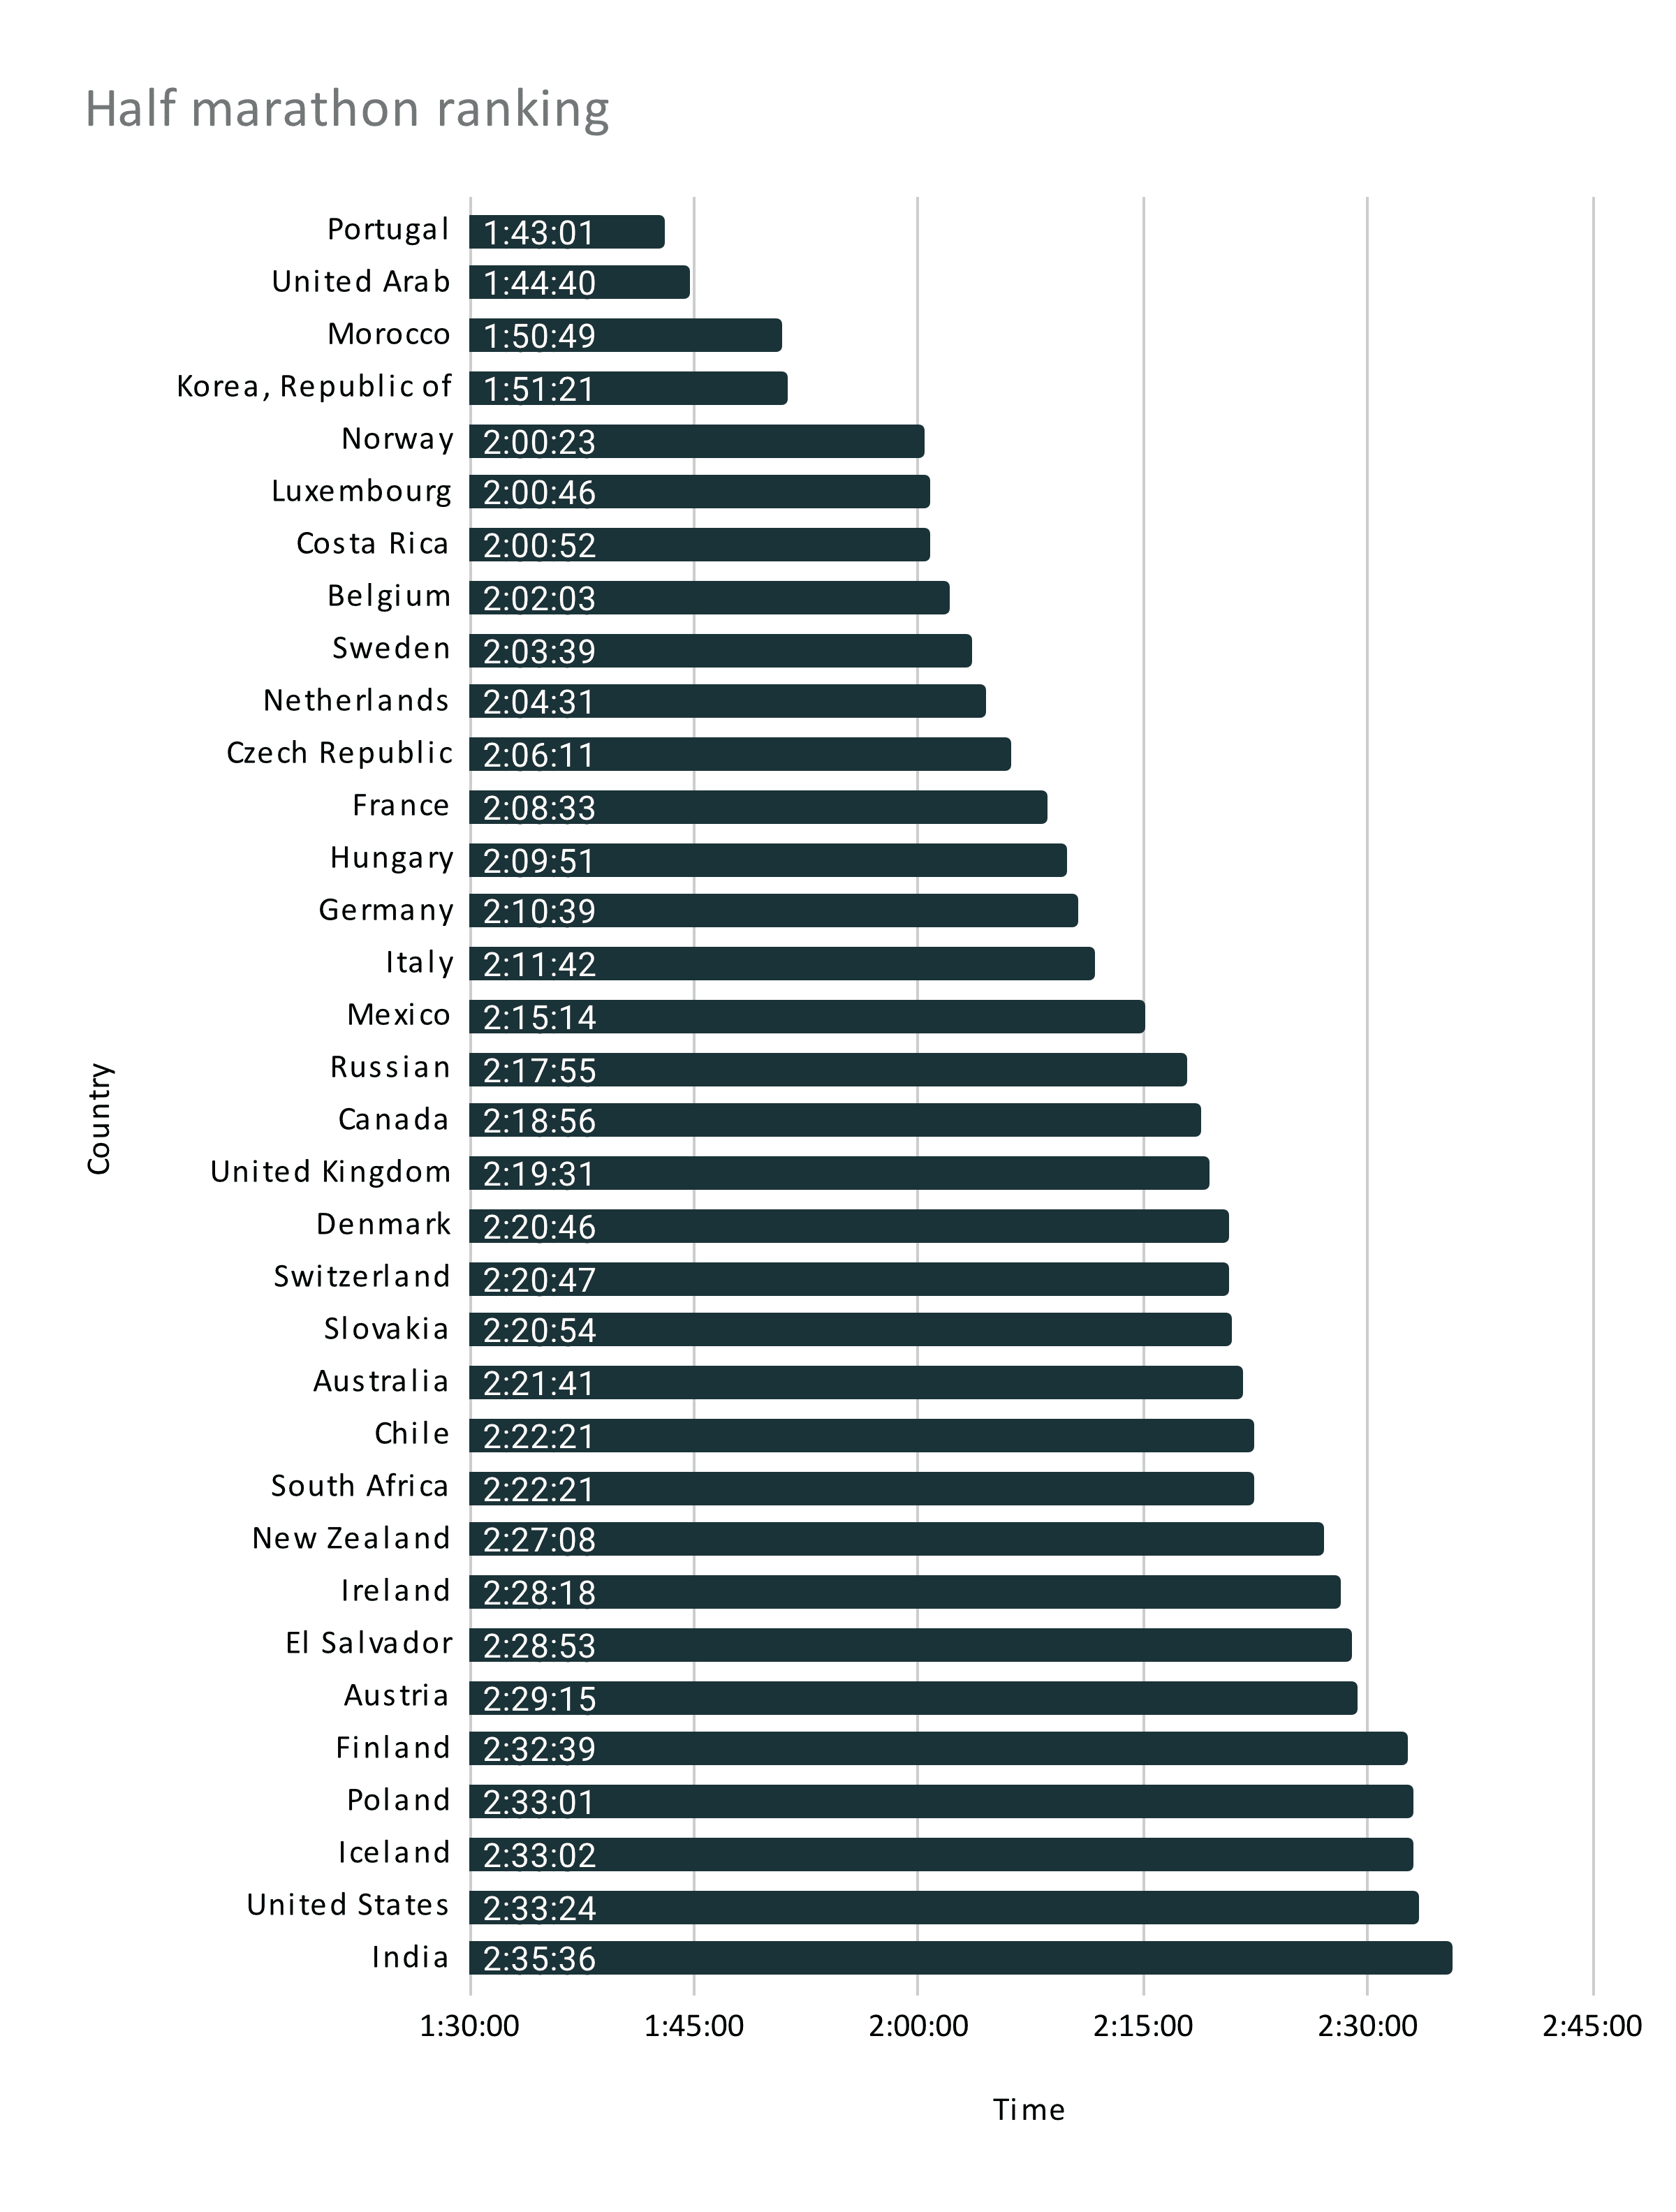
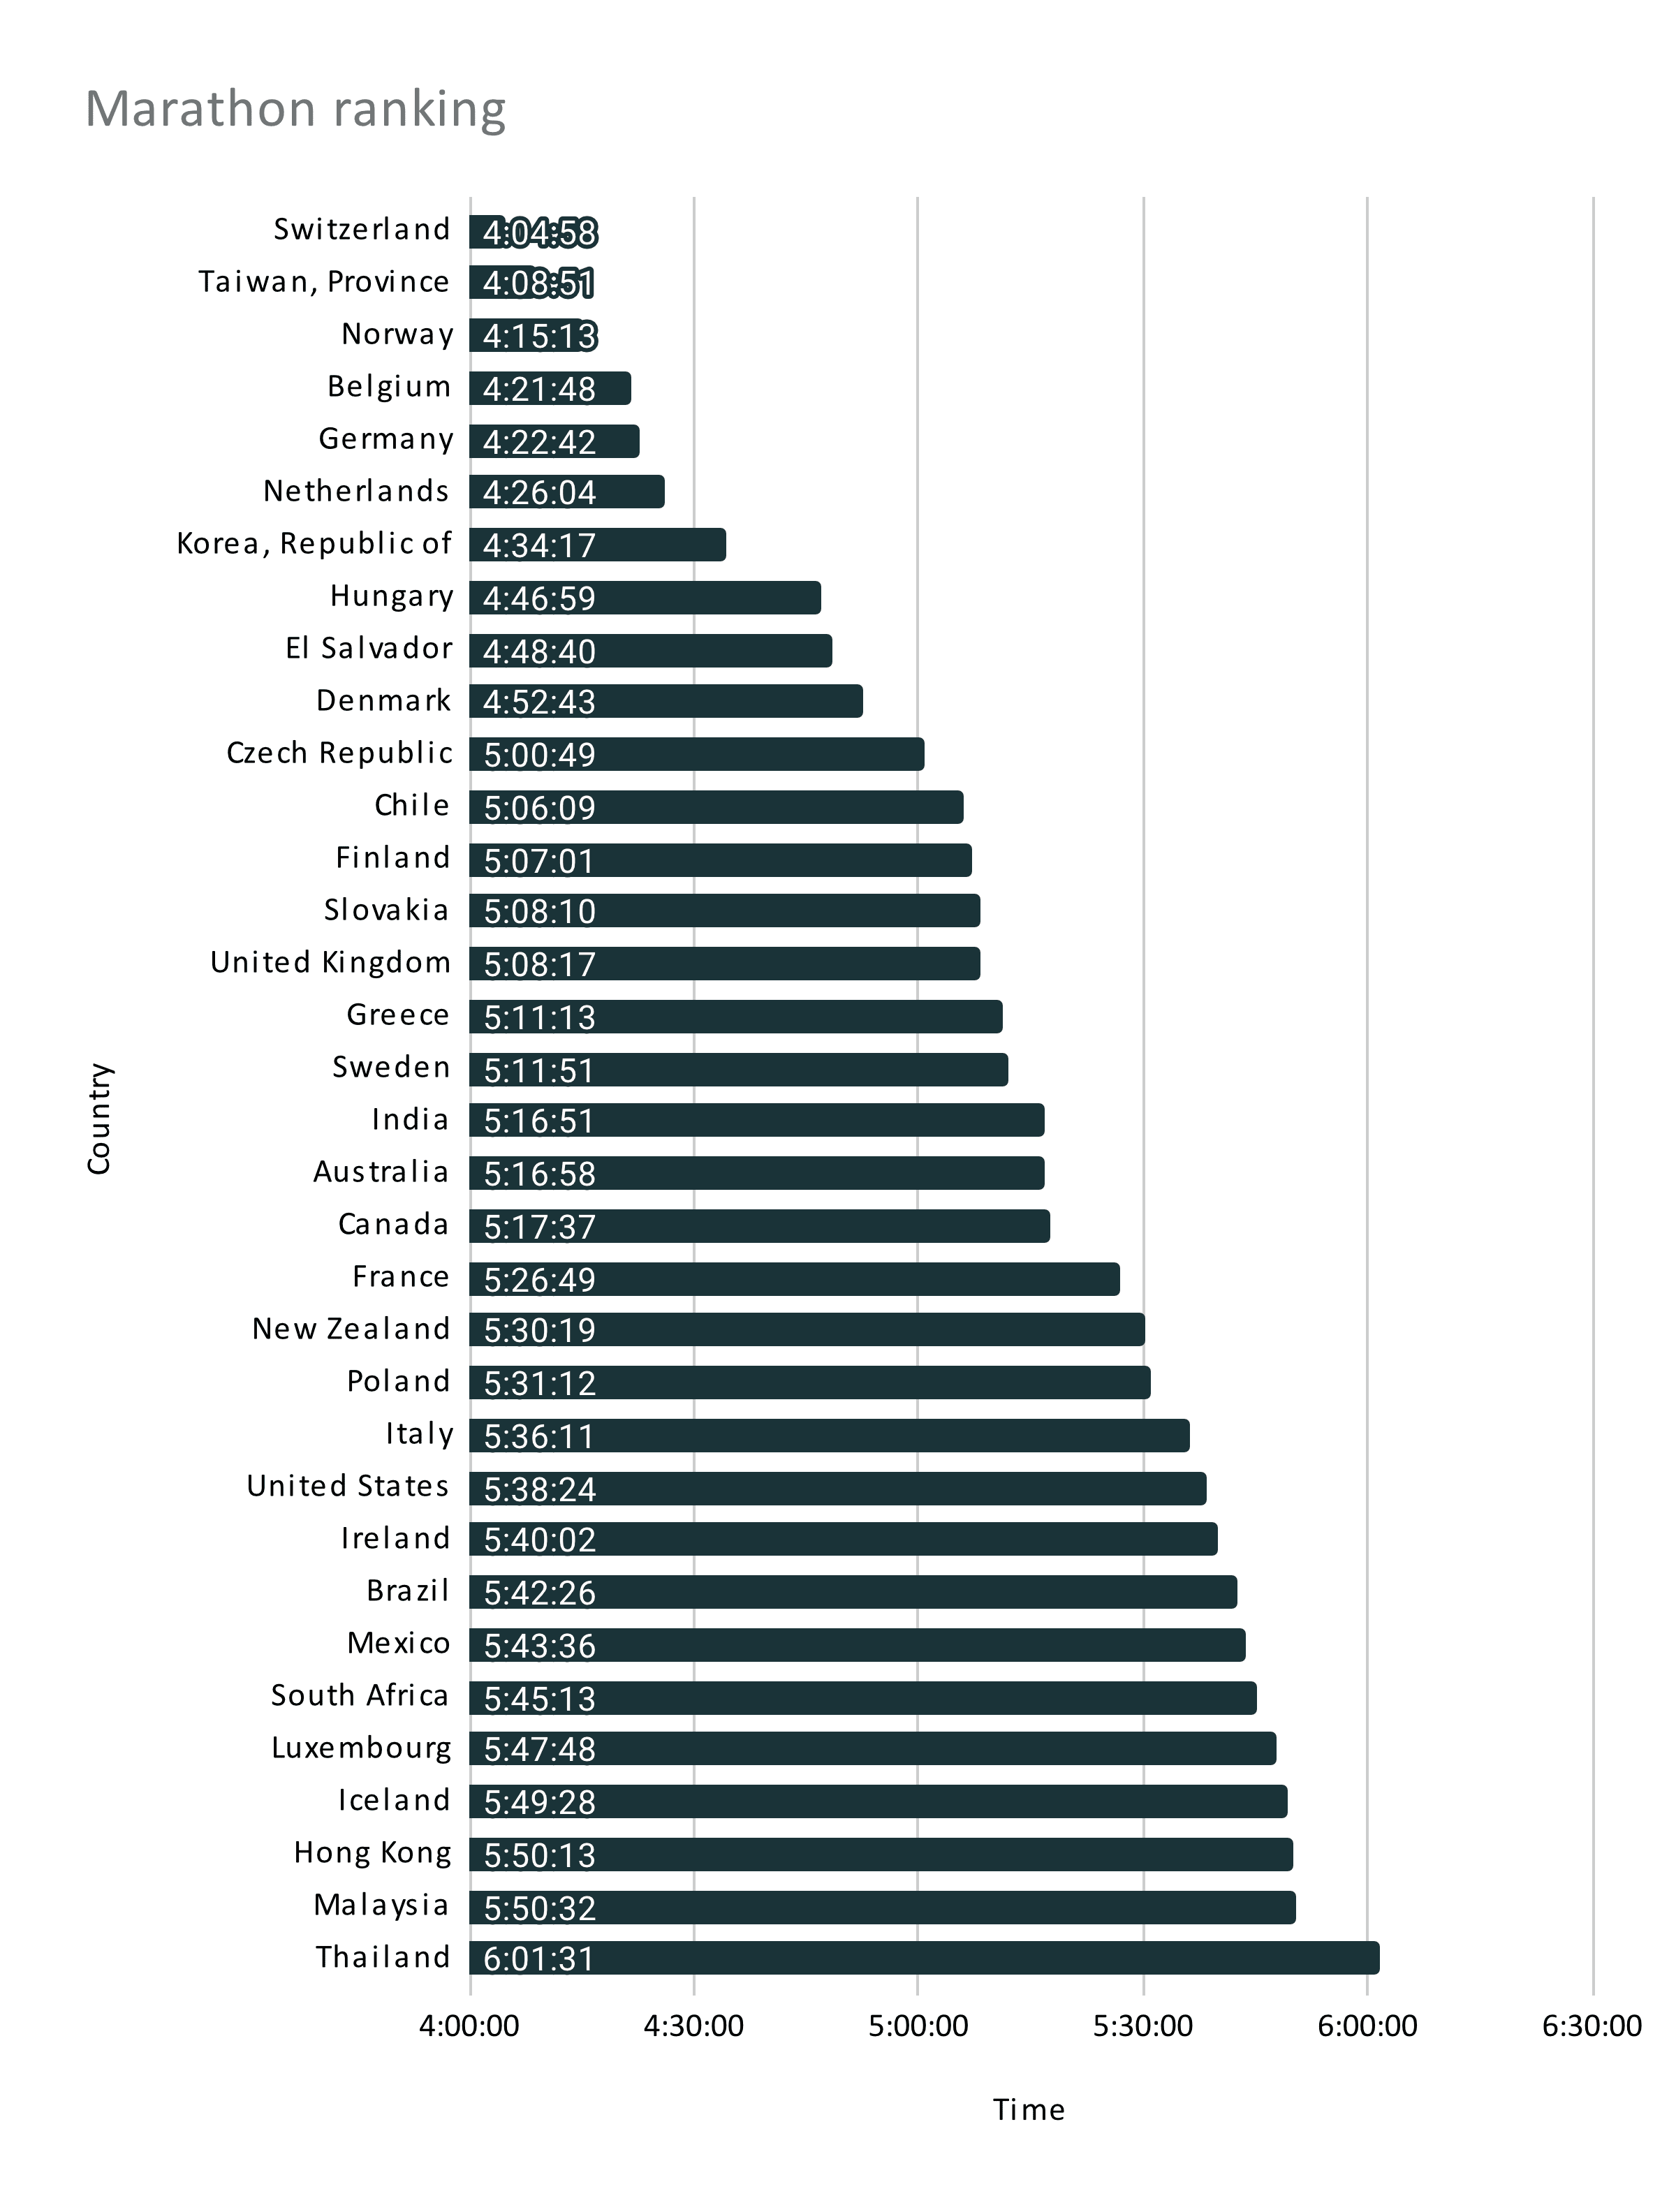
- The World’s fastest countries are as follows. 5k: Spain, 10k: Slovakia, Half marathon: Portugal, Marathon: Switzerland.
- Trail runners have never been older with an average age of 39.5 years old.
- Female participation has grown from 13% in 1997 to 46% in 2022.
- Men are generally attracted to longer distances.
- 3 countries have more female than male participants (Canada, New Zealand, Argentina)
Methodology and data
- Elite runners have been excluded. The analysis is of recreational runners.
- Walks and “walk/run for charity” races have been excluded.
- Trail races with elements of obstacle course races and other nontraditional races have been excluded.
- Data collection was done in collaboration with dozens of partners, race organisers, and local trail organisations as well as publicly available information.
- For parts of the analysis, we focus only on recent years where data is more solid. Data from the early years must be interpreted with a grain of salt.
- Trail running is known for using non-traditional distances. We have included any distance, including distances beyond the marathon.
- The total database of race results is 15,653,063 finishers. We did not include race participants who did not finish.
- The race results are spread across 116,947 races in 127 countries.
- Data from Western Europe and America is solid, whereas data from other regions have been harder to obtain.
- Dates from 1984 to 2022, however for yearly analysis data, we include data just until 2021 to get data for a full year.
Trail running participation trends
For every 1 trail runner, there are 5.3 road runners
While trail running is the little brother of running, its growing popularity cannot be overlooked, and today trail running accounts for 15.8% of all race finishes.
Trail running growing 231% in the last 10 years
Like ultra running, which is most often done in trail conditions, trail running has experienced massive growth since 1984.
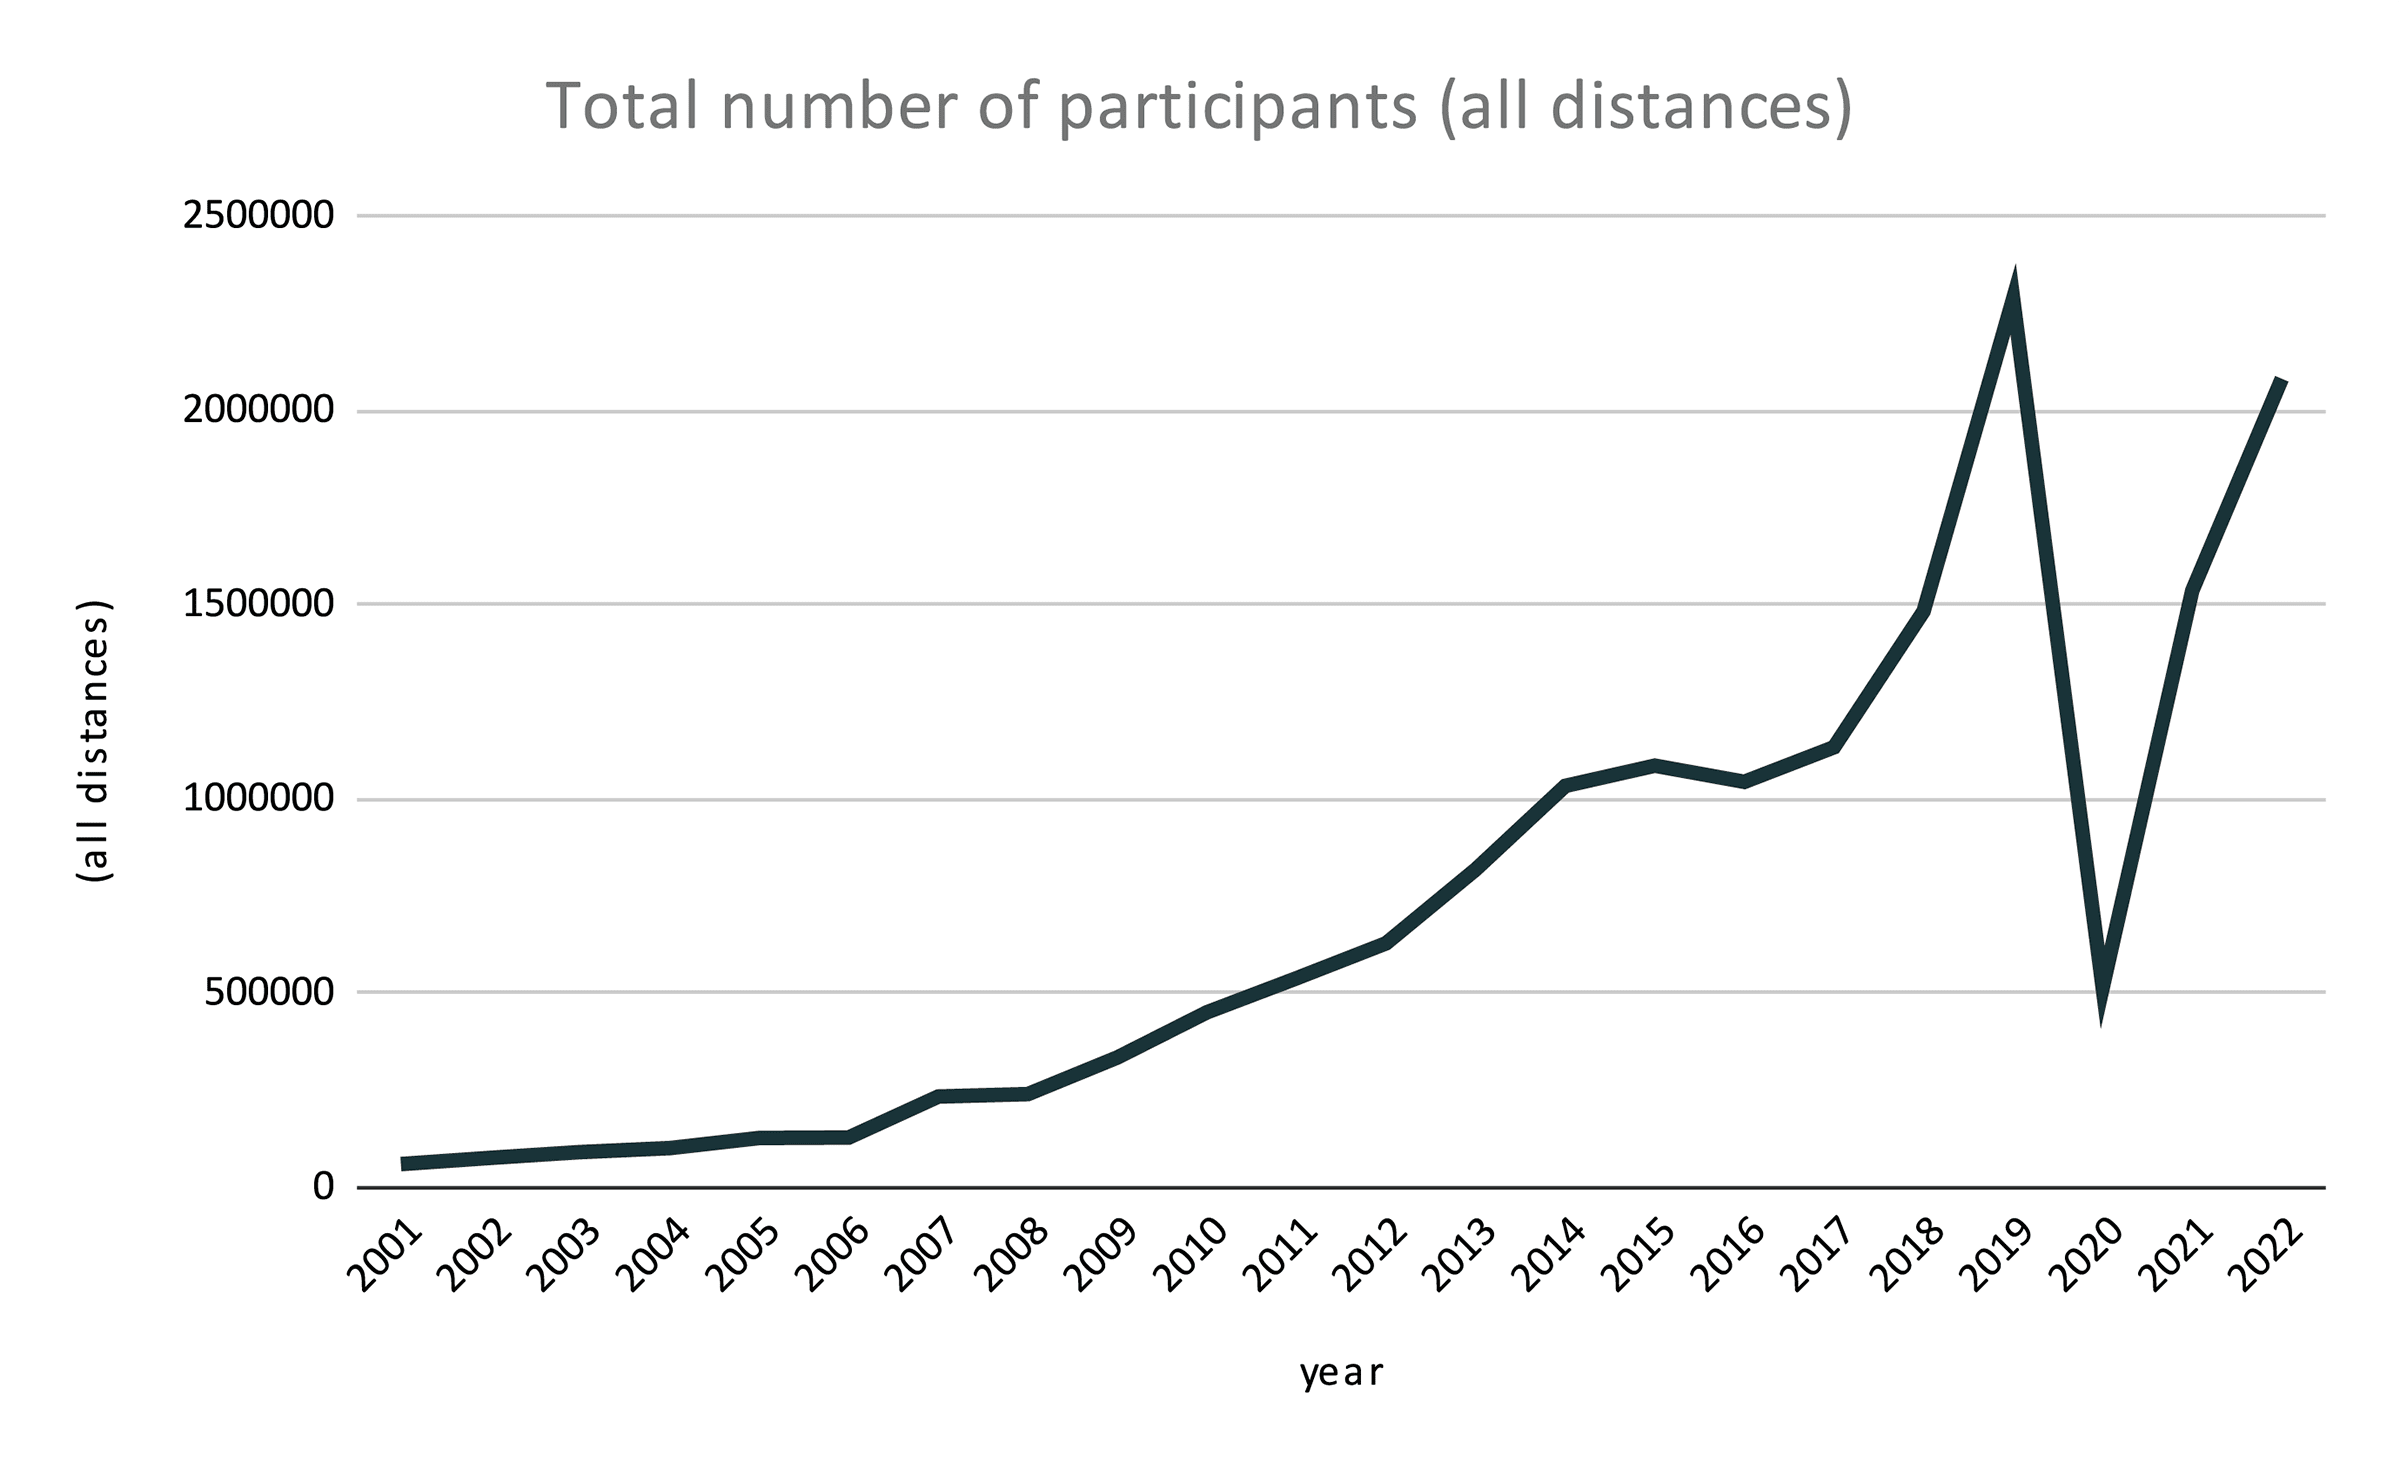
The chart below shows the growth since 2001 (most reliable data).
In the past 20 years, trail running has grown by 2394%, and using the most recent 2022 data, trail running has grown by 231% in the past 10 years.

Covid-19 and trail running
Zooming in at the last 8 years and including data from 2022, we see how trail running peaked in interest in 2018 and 2019. During those two years, the growth was 30.8% and 54.18% compared to the previous years. Covid-19 put an end to this.
In 2020 trail running was down by 77.4% overall, and down 97% in April 2020 compared to April 2019.
In 2021 it bounced back, growing 198%, but from a much lower base. Not enough to catch up with 2019 levels.
In 2022 the growth compared to 2021 has been 106% higher.
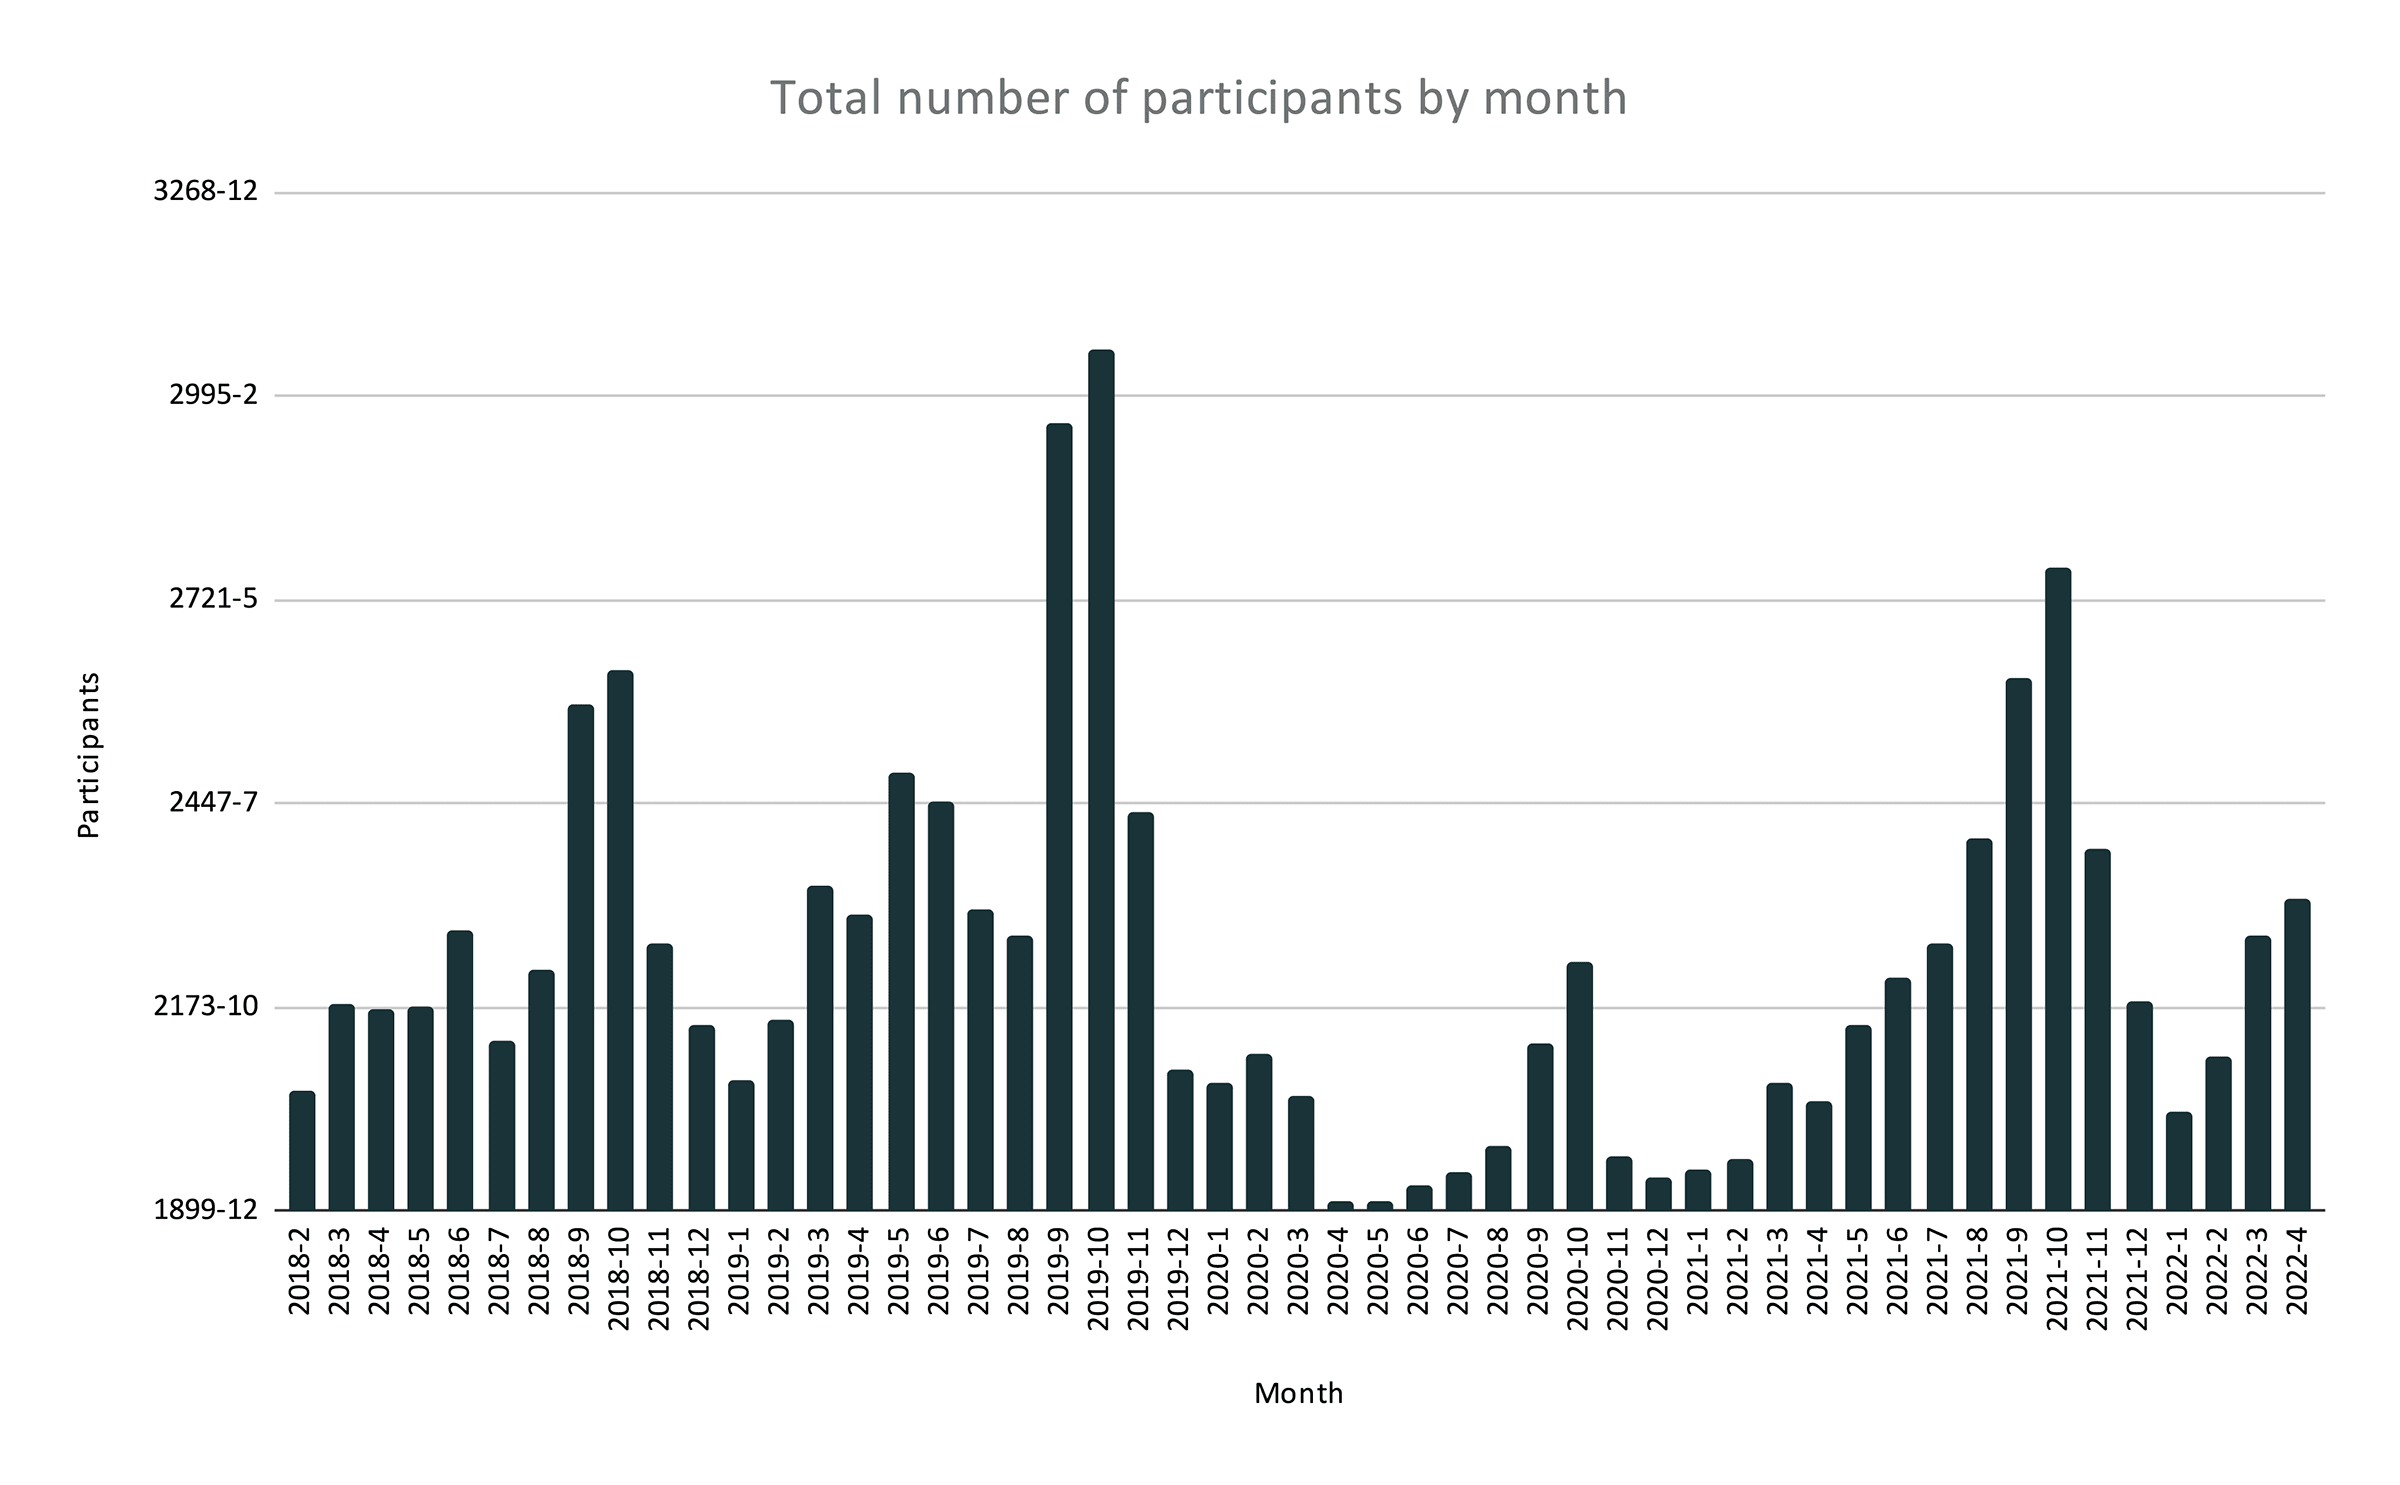
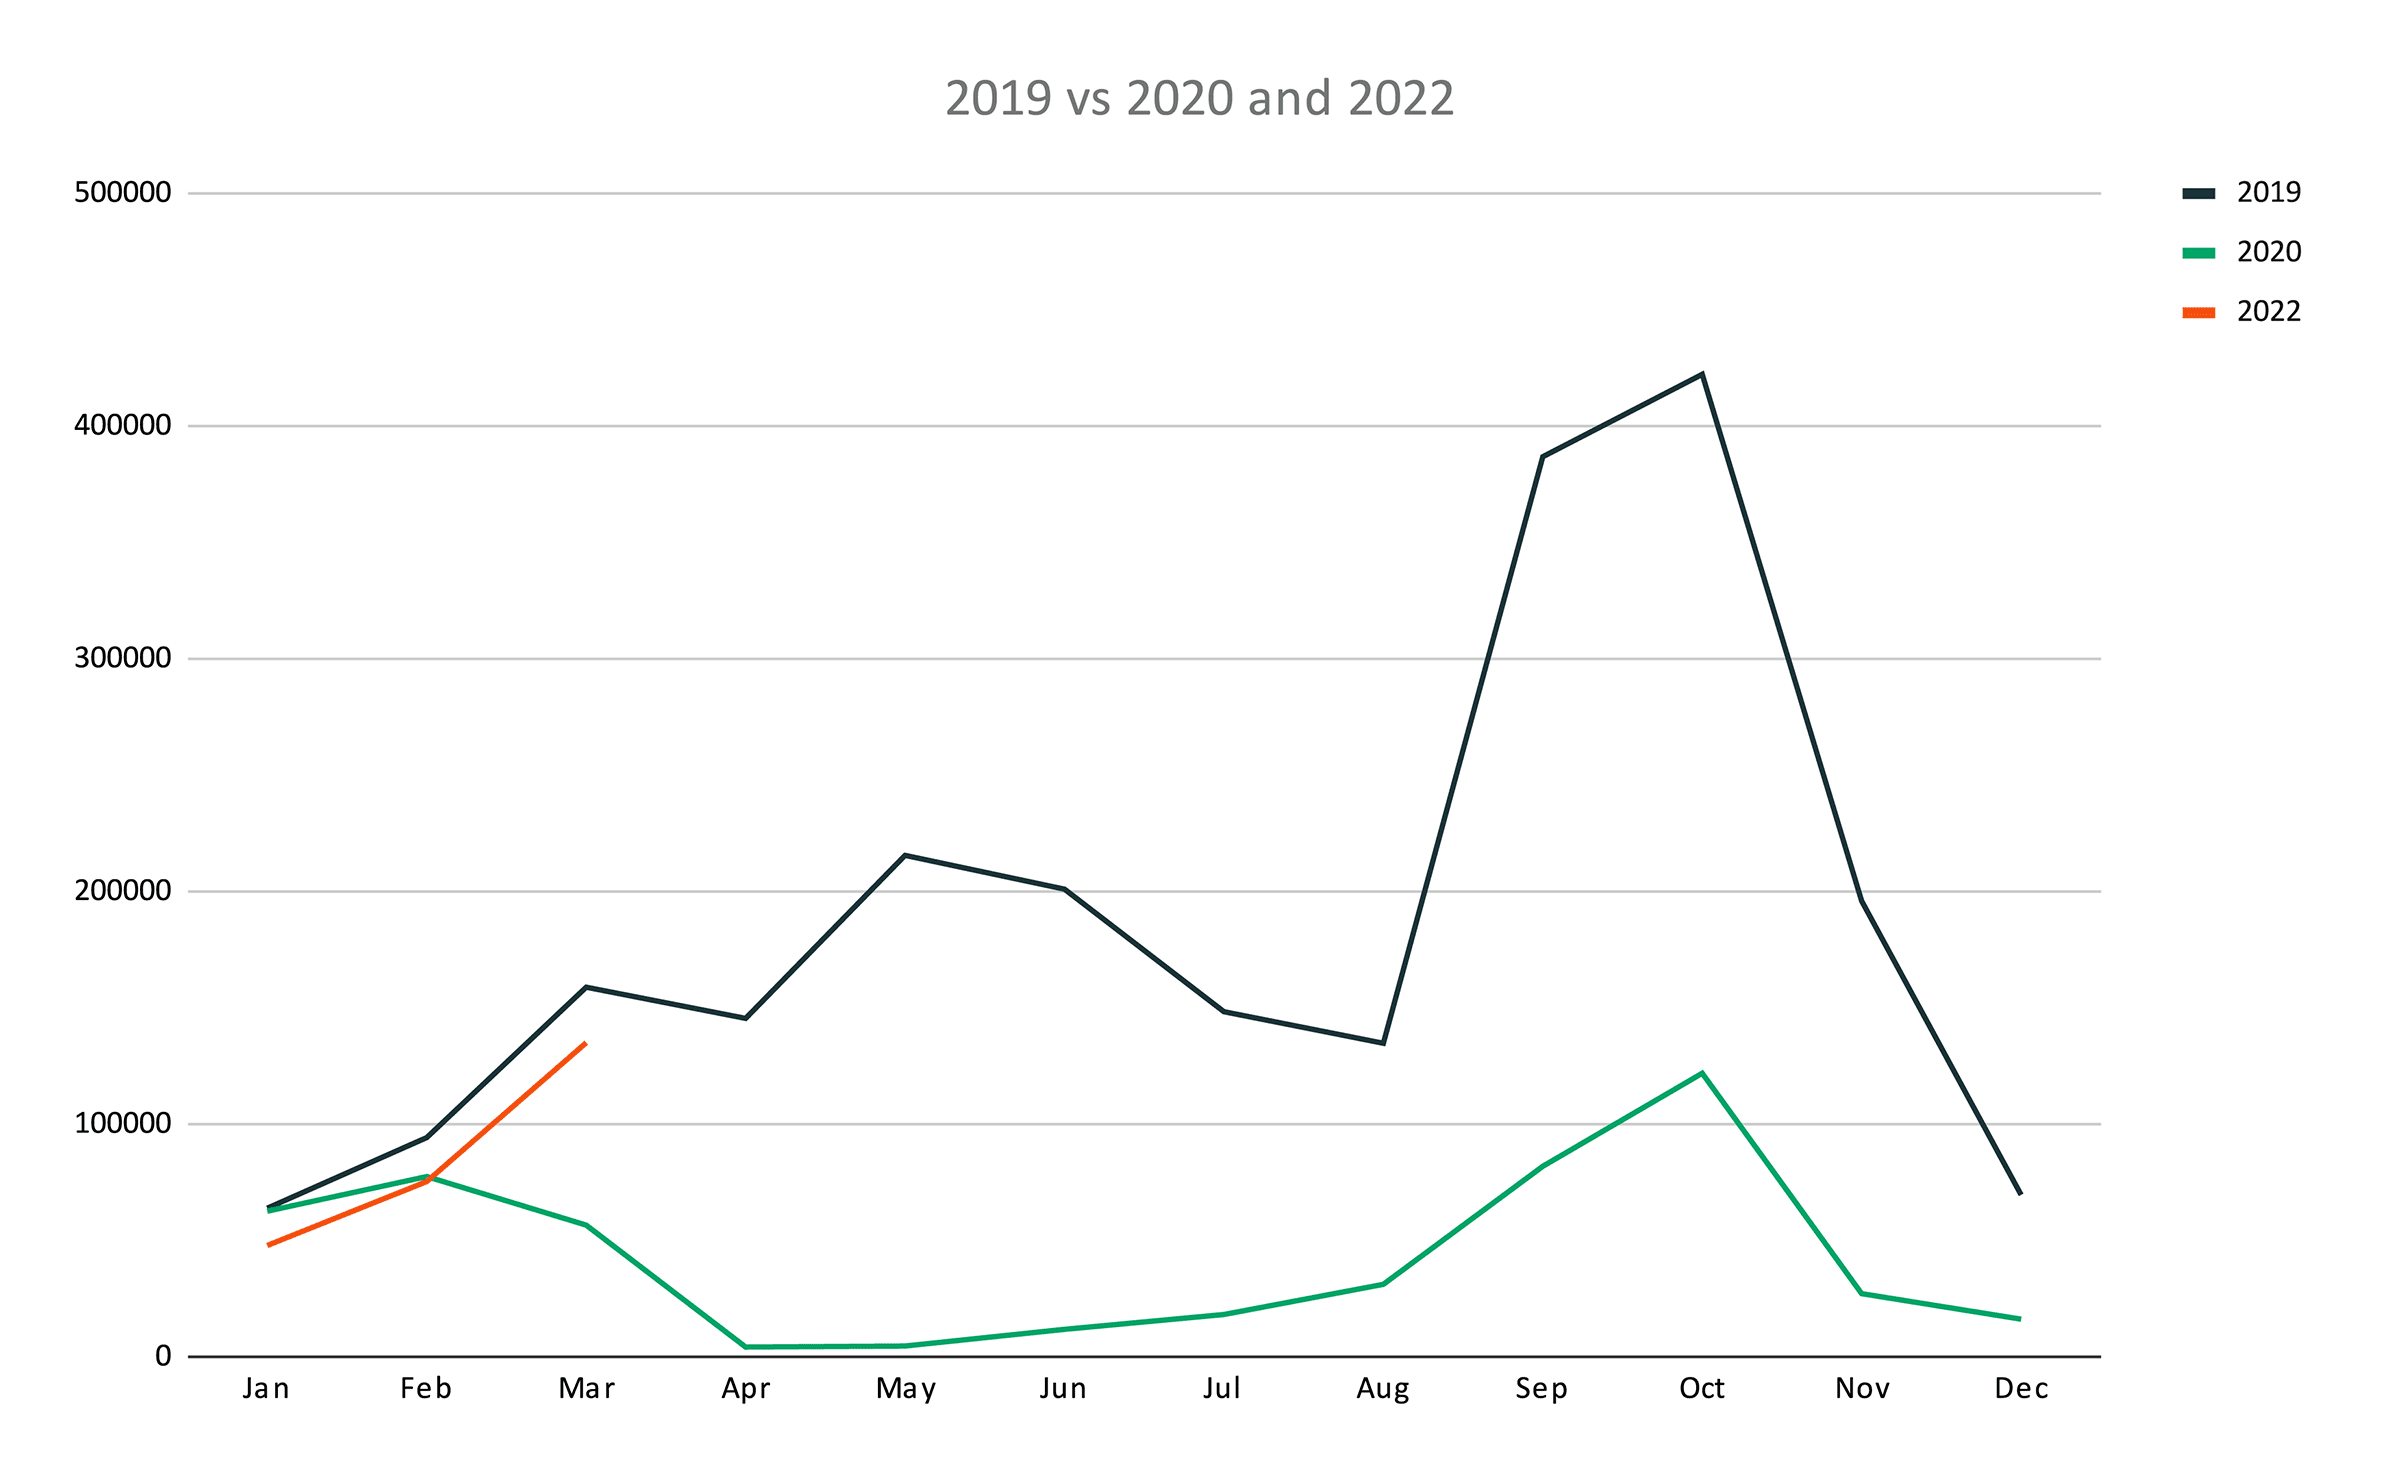
In the chart below, you’ll find monthly participation over the past 4 years.
- Black line = 2019 = regular trail running season. Grows towards spring, stable throughout summer, peaks in autumn, then low in winter.
- Green line = 2020 = huge decline from March when covid-19 hit.
- Red line = 2021 = a somewhat stable season globally despite it being much lower than the 2019 season.
So far, 2022 is 106% stronger than 2021. However, this is still not enough to catch up with the strong season of 2019. Compared to 2019, 2022 is still 15% behind. We believe that by the end of 2022, participation is back to normal.
The most popular distance
The 5k trail race is by far the most popular distance in trail running. It accounts for 17% of race finishers. The 2nd most popular distance is the 10k trail race at 9.4% of participation.
Change in popularity of distances
For simplicity reasons, this analysis looks only at the 5 most popular distances in trail running.
In 2000 more than 75% of all races were 5k races. In the following 21 years, that trend slowly decreased and in 2022 only 45% of races are 5k races.
The trend is clear. Trail races are getting longer and longer.
Also, in trail running, more people finish distances beyond the marathon, than the actually marathon distance itself. This is very different to road running.
Differences in race distances between trail and road running
While the 5k and the 10k are the most popular distances, one thing that sets trail running apart from traditional road running is that the distance varies greatly.
In traditional road running, the 5k and the 10k account for 51.5% of all race results, whereas for trail running, they account for only 26.4% combined.
Another difference is that in trail running, the popular distances are generally longer than the popular distances in road running. Looking at the 10 most popular road distances, the average distance is 10.27 km, whereas for trail running the number is 24.63 km (+140% longer).
Big trail races are taking over, proportionally
In 1984, 72% of all runners finished in a race with fewer than 500 participants. Today, only 12% of runners finish a small race with less than 500 participants.
Naturally, when a sport gets bigger, also more participants per race becomes possible.
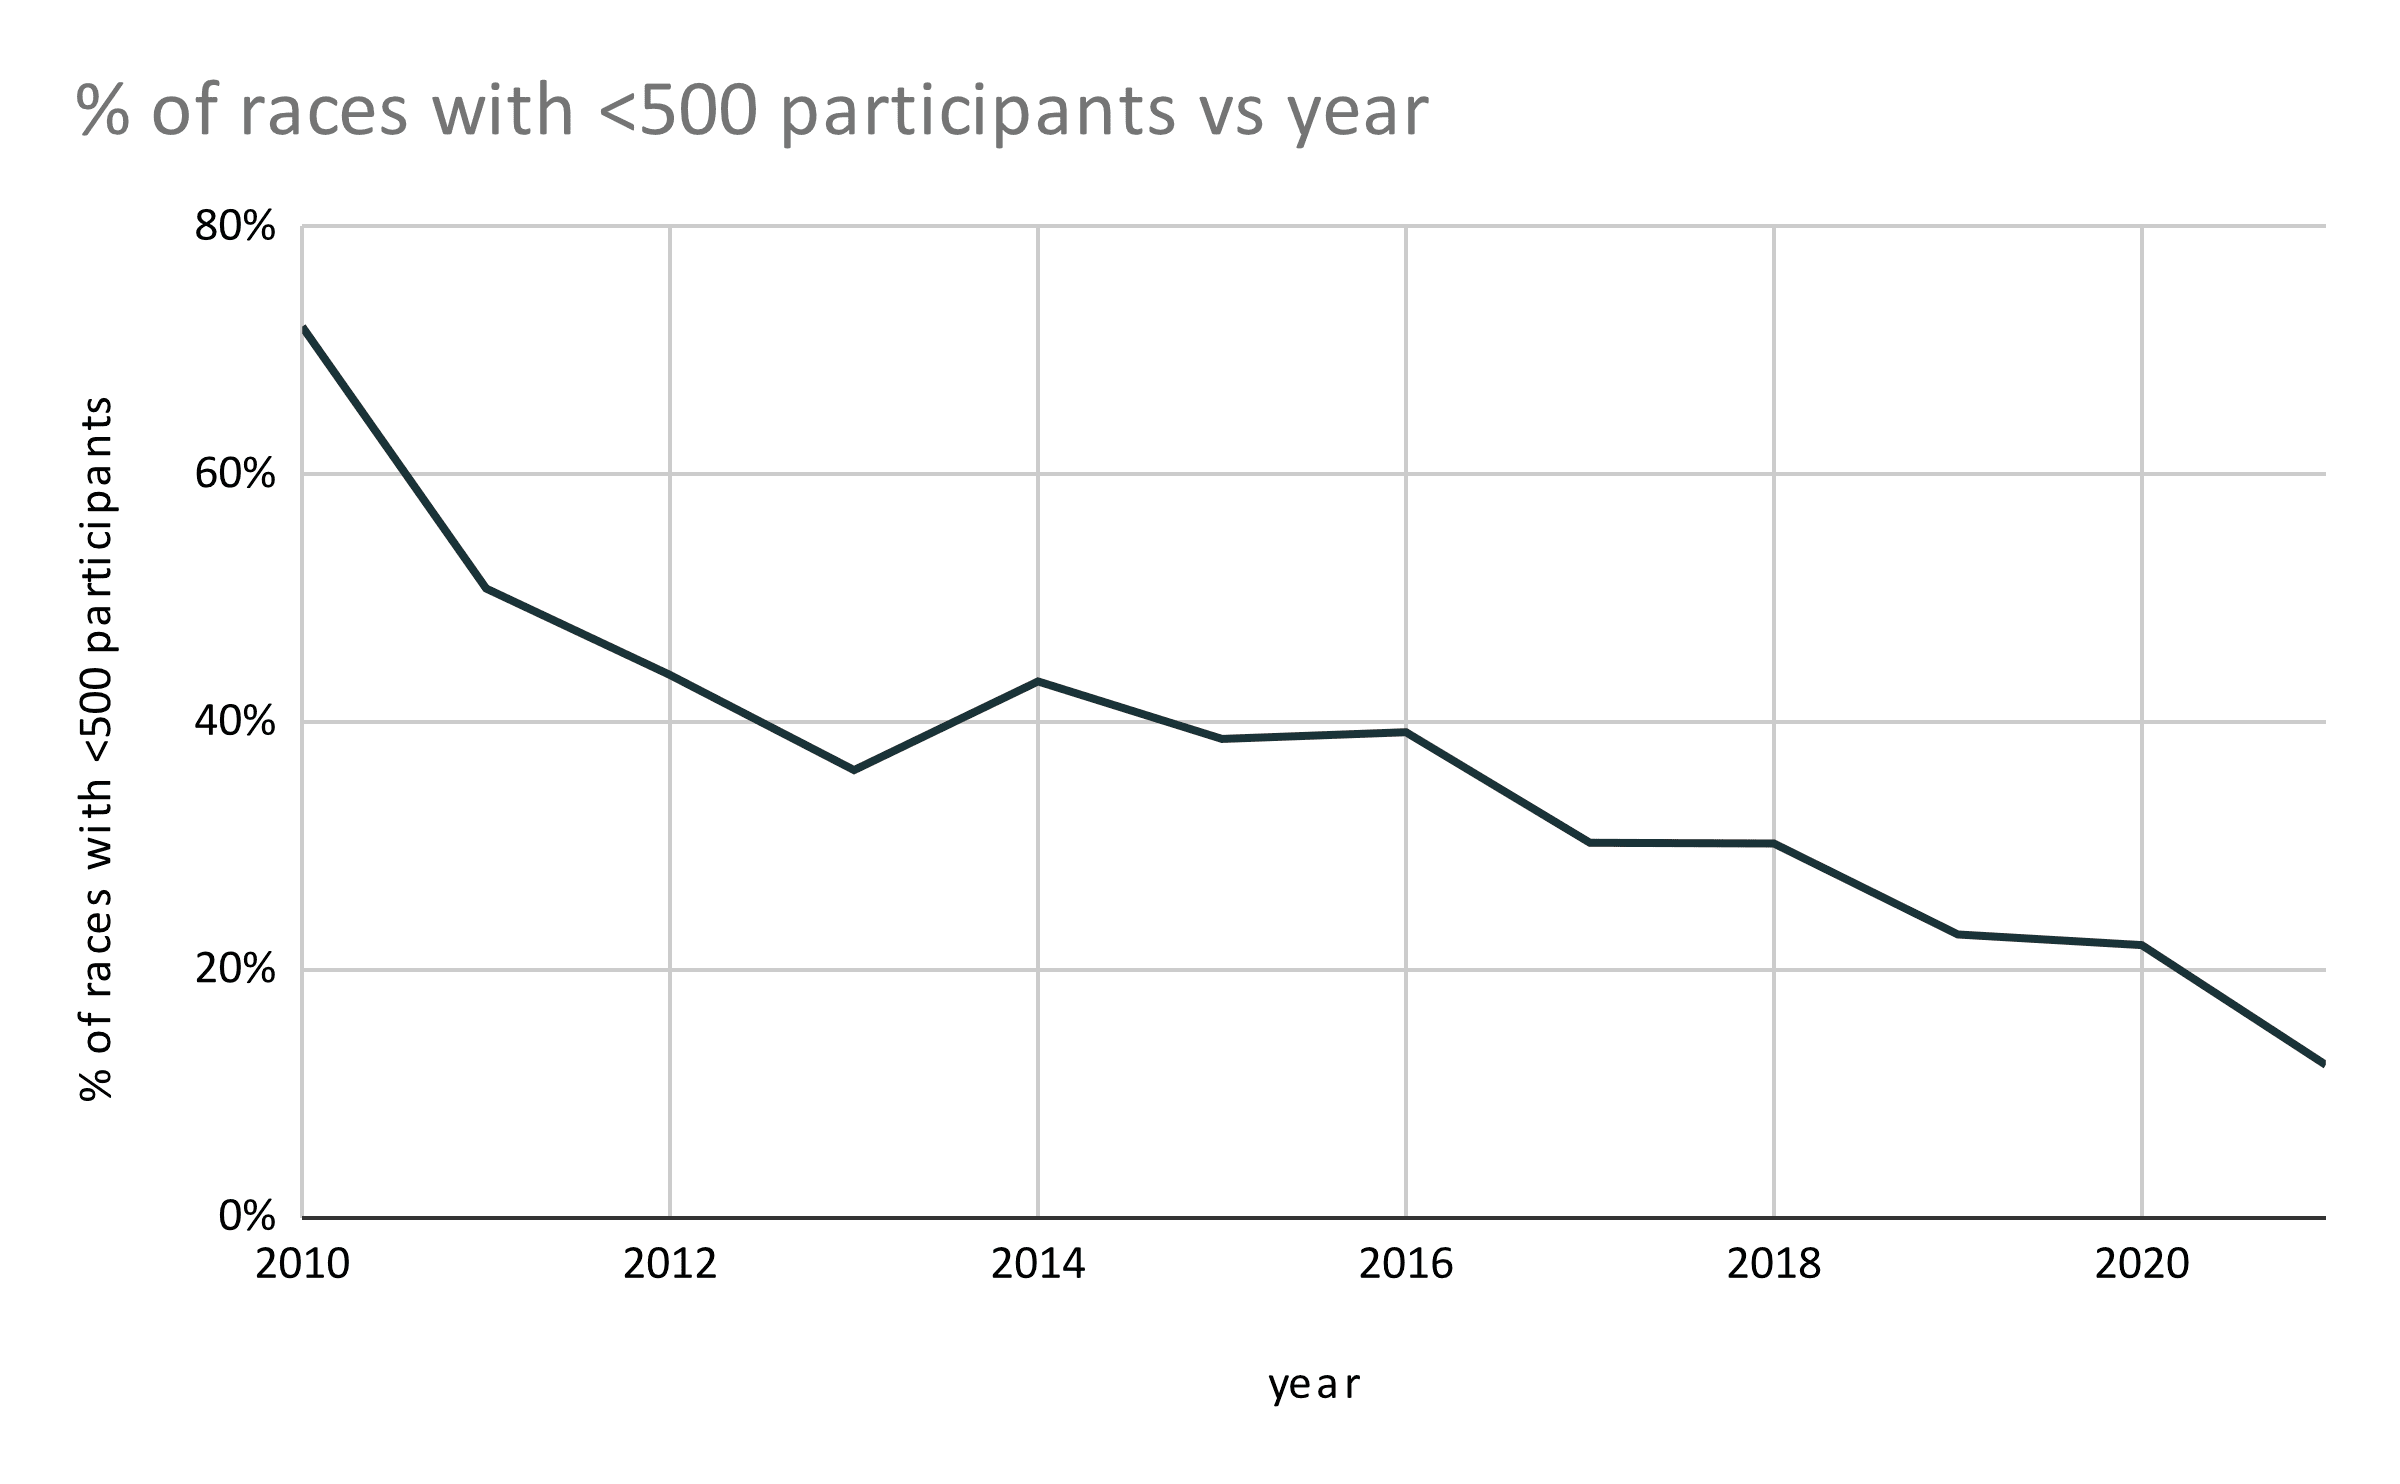
This trend however is proportional, and while the big races account for most finishes in 2022, the small races have still grown tremendously.
Looking at the past 10 years the growth in participation looks as follows:
- Small races: +629%
- Large races: +5252%
Trail running is still significantly smaller than road running. In 2018 numbers:
- Road running had 7.90 million participants
- Trail running had 1.48 million participants
With this trend, it’s also obvious that trail running will have fewer participants per race. This remain (part of) the beauty of trail running: few participants per race.
An average trail race has 133 participants per race throughout the years, whereas road running races had 1541 participants on average. That’s 1058% more.
Looking at this proportionally to the number of participants, it’s still clear that trail running has the chart of many races with few participants. However, the trend is moving towards big races.
Finish time analysis in trail running events
Since 2012, trail runners have got faster and faster. This is a surprise, given we’ve previously shown how American runners are consistently getting slower and slower.
Like what we found in The State of Ultra Running, the pace difference between men and women decreases as the distance increases.
We actually found that in:
- 50 mile races women are 3.7% slower
- 100 mile races women are 0.5% slower
- Above 195 miles, women are 0.6% FASTER than men
The World’s fastest trail-running nations
The following section looks into the finish times at the most popular distances among recreational runners.
World’s fastest 5k trail runners
Spain comes first at 27:02 followed by Portugal and Hungary.
World’s fastest 10k trail runners
For the 10k rankings, Slovakia has the fastest runners with an average finish time of 57:39, only 20 seconds faster than Iceland, which comes second.
World’s fastest half marathon trail runners
At the half marathon distance, Portugal comes first in 1:43:01
World’s fastest marathon trail runners
And in the marathon ranking, we again see Switzerland ranking #1 as the world's fastest trail running nation.
Pace analysis
What’s interesting in the pace analysis is that generally, we would assume that the longer you run, the slower you’ll run. A 100m sprinter is faster than a 100-mile runner.
However, while this is the case on an individual basis, it’s different when you look at the entire population. 5k trail runners, the shortest distance we’re looking at, are slower than 10k, half marathon, and marathon trail runners.
While we don’t know for sure, we hypothesise that the 5k is beginner friendly and attracts a lot of new runners which in itself is a great thing.
Only 50k (and longer) distances are slower than the 5k runners for some age groups.
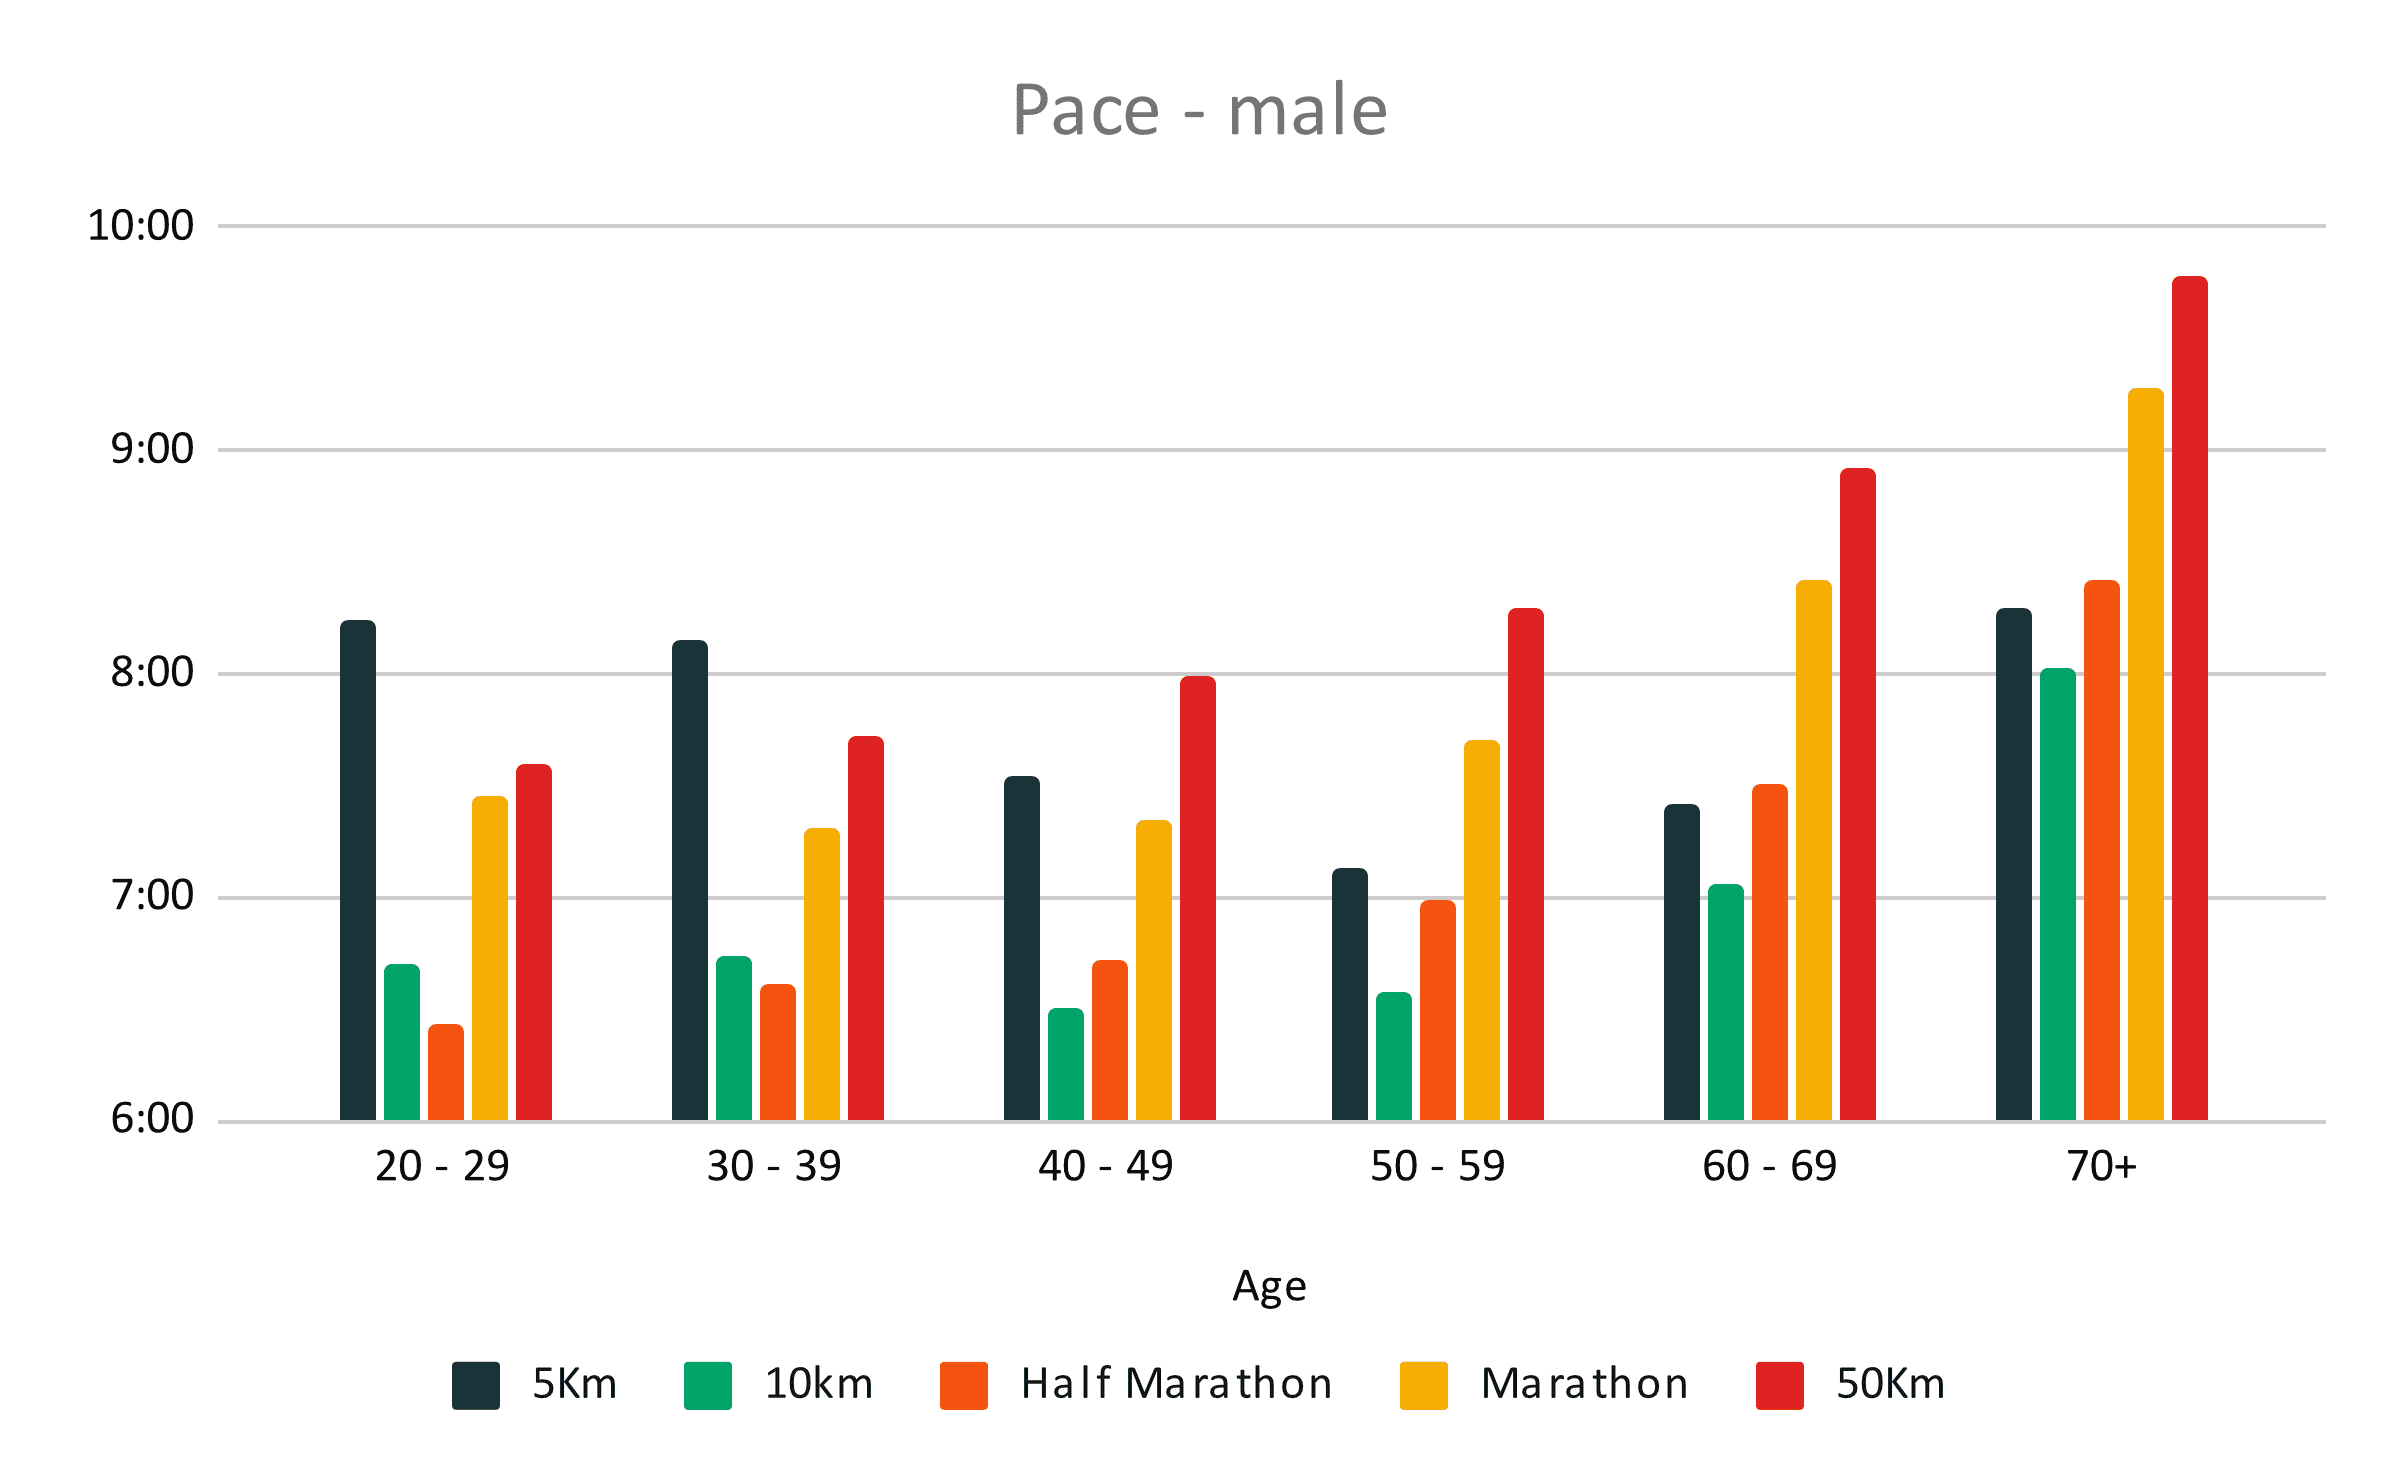
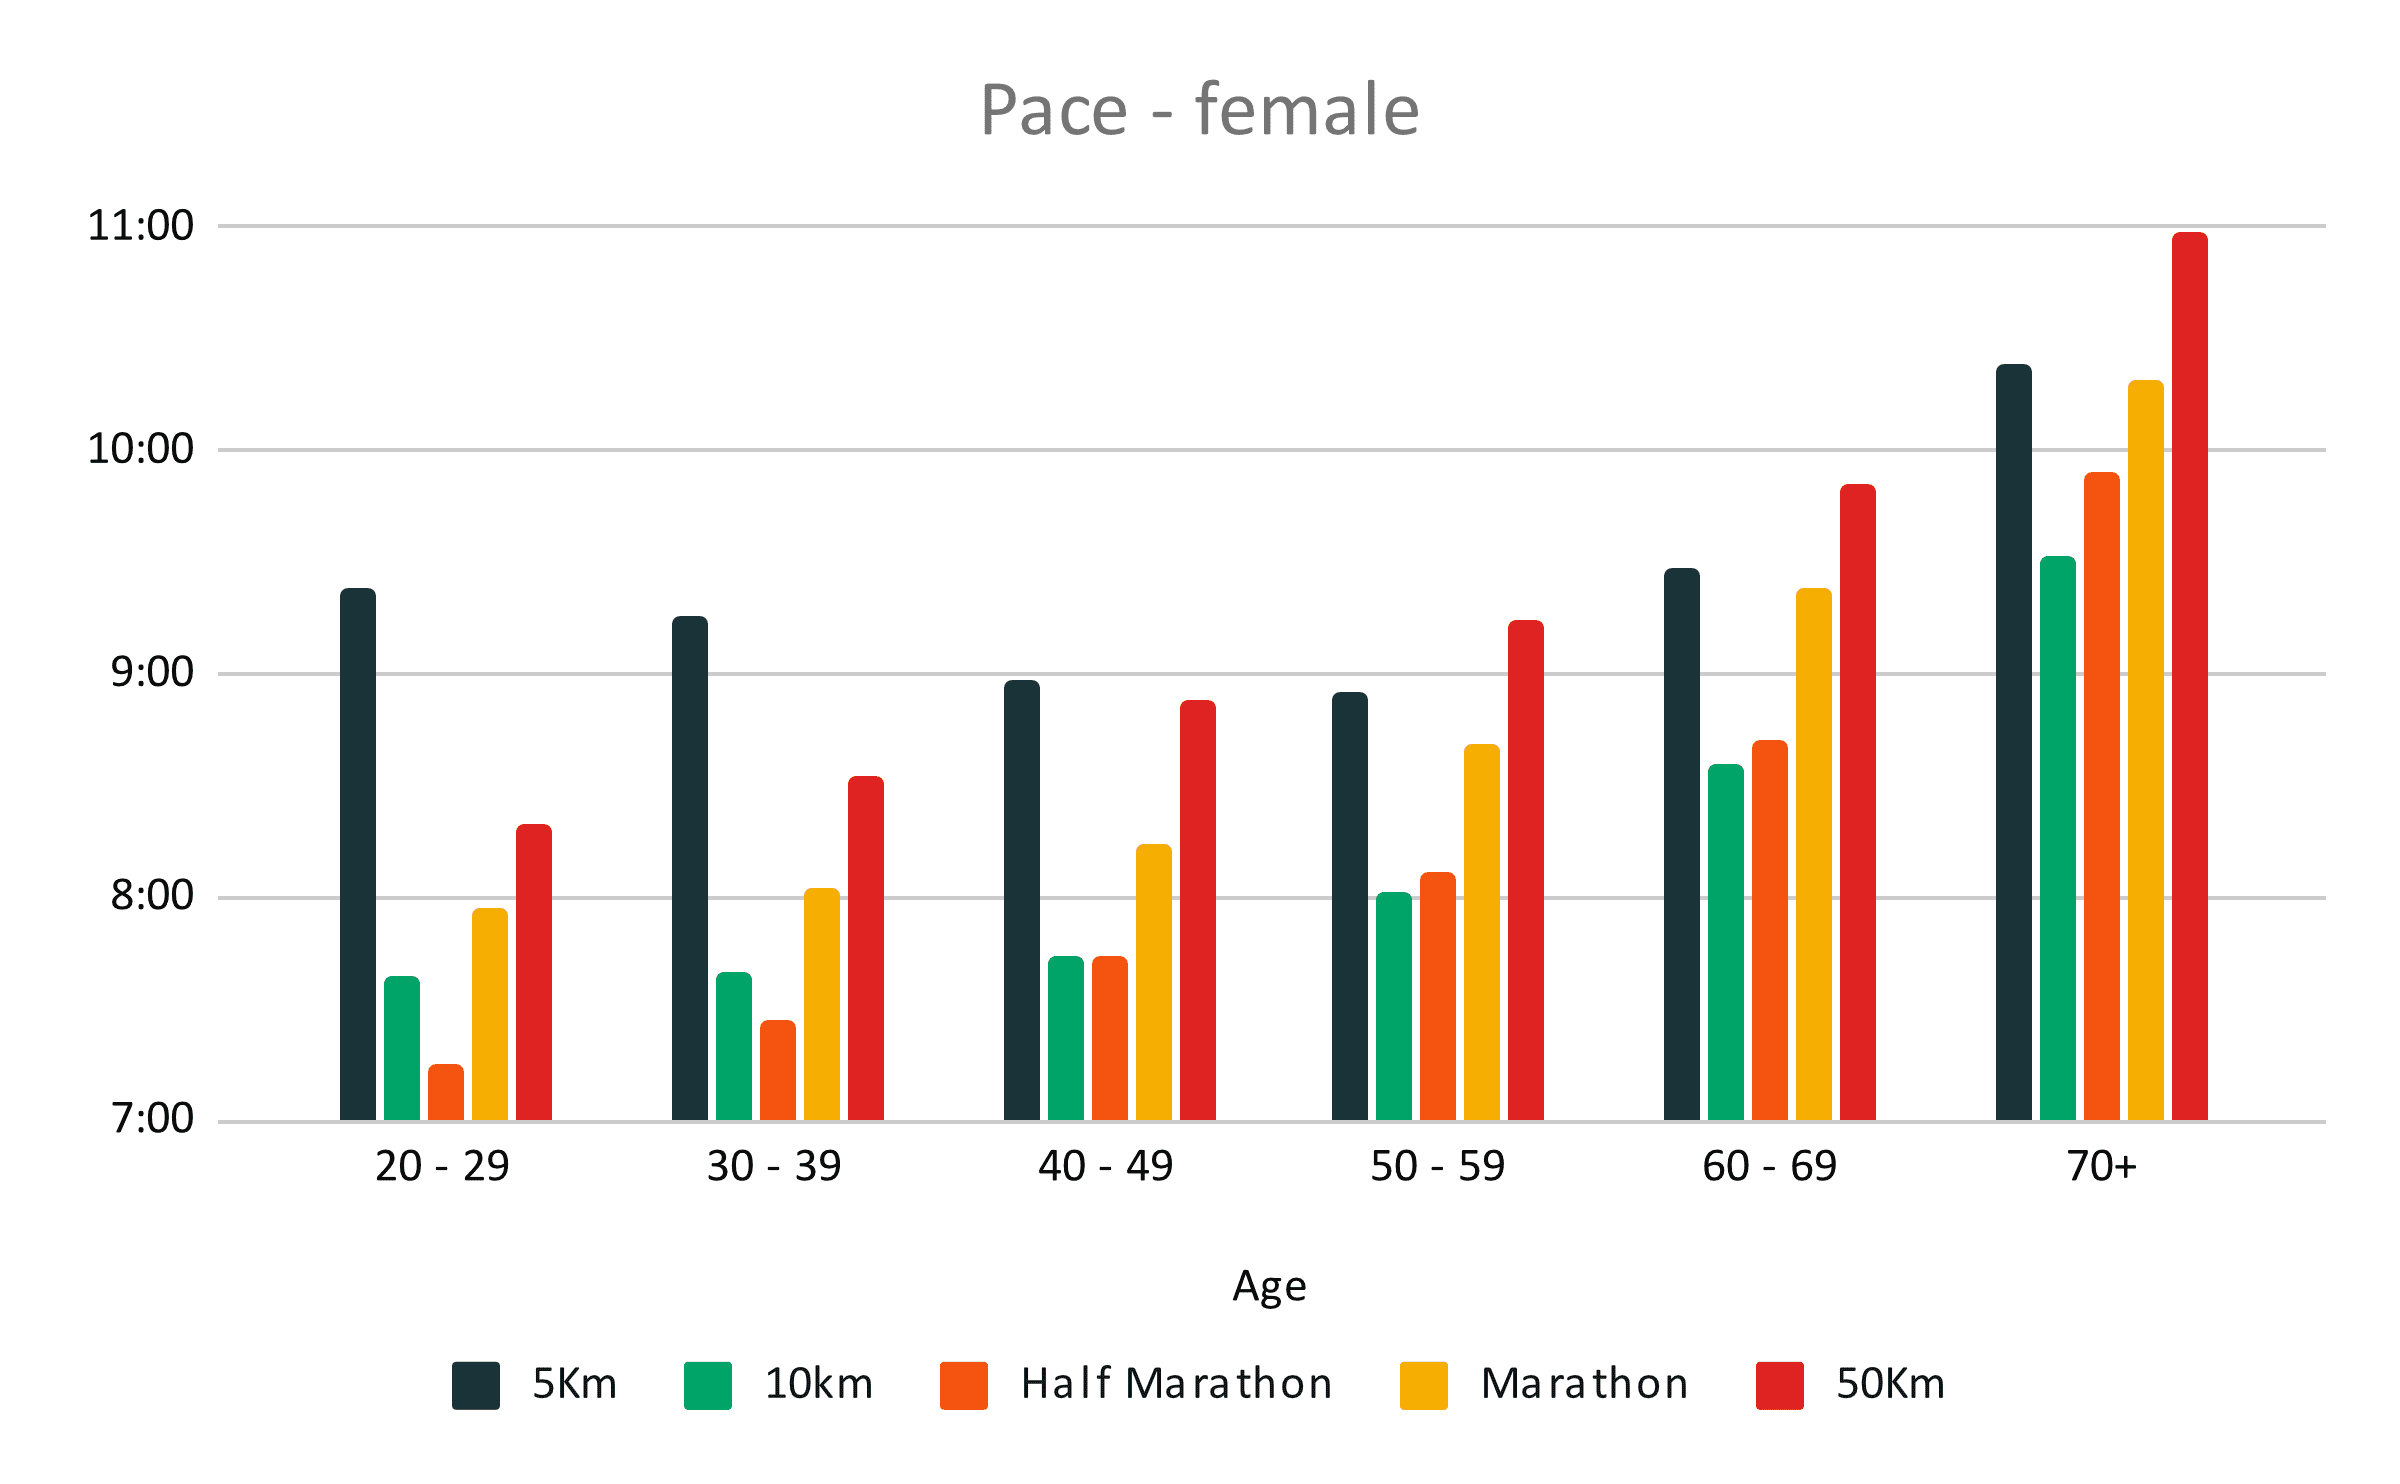
Below you’ll find a table detailing the pace of each distance by age group:
|
Pace Female |
|||||
|
Age |
5Km |
10km |
Half Marathon |
Marathon |
50Km |
|
20 - 29 |
9:23 |
7:39 |
7:15 |
7:57 |
8:19 |
|
30 - 39 |
9:15 |
7:40 |
7:27 |
8:02 |
8:32 |
|
40 - 49 |
8:58 |
7:44 |
7:44 |
8:14 |
8:53 |
|
50 - 59 |
8:55 |
8:01 |
8:06 |
8:41 |
9:14 |
|
60 - 69 |
9:28 |
8:36 |
8:42 |
9:23 |
9:51 |
|
70+ |
10:23 |
9:31 |
9:54 |
10:19 |
10:59 |
|
Pace Male |
|||||
|
Age |
5Km |
10km |
Half Marathon |
Marathon |
50Km |
|
20 - 29 |
8:14 |
6:42 |
6:26 |
7:27 |
7:35 |
|
30 - 39 |
8:09 |
6:44 |
6:37 |
7:18 |
7:43 |
|
40 - 49 |
7:33 |
6:30 |
6:43 |
7:21 |
7:59 |
|
50 - 59 |
7:07 |
6:34 |
6:59 |
7:43 |
8:17 |
|
60 - 69 |
7:25 |
7:04 |
7:31 |
8:25 |
8:55 |
|
70+ |
8:17 |
8:02 |
8:25 |
9:17 |
9:48 |
How old are trail runners?
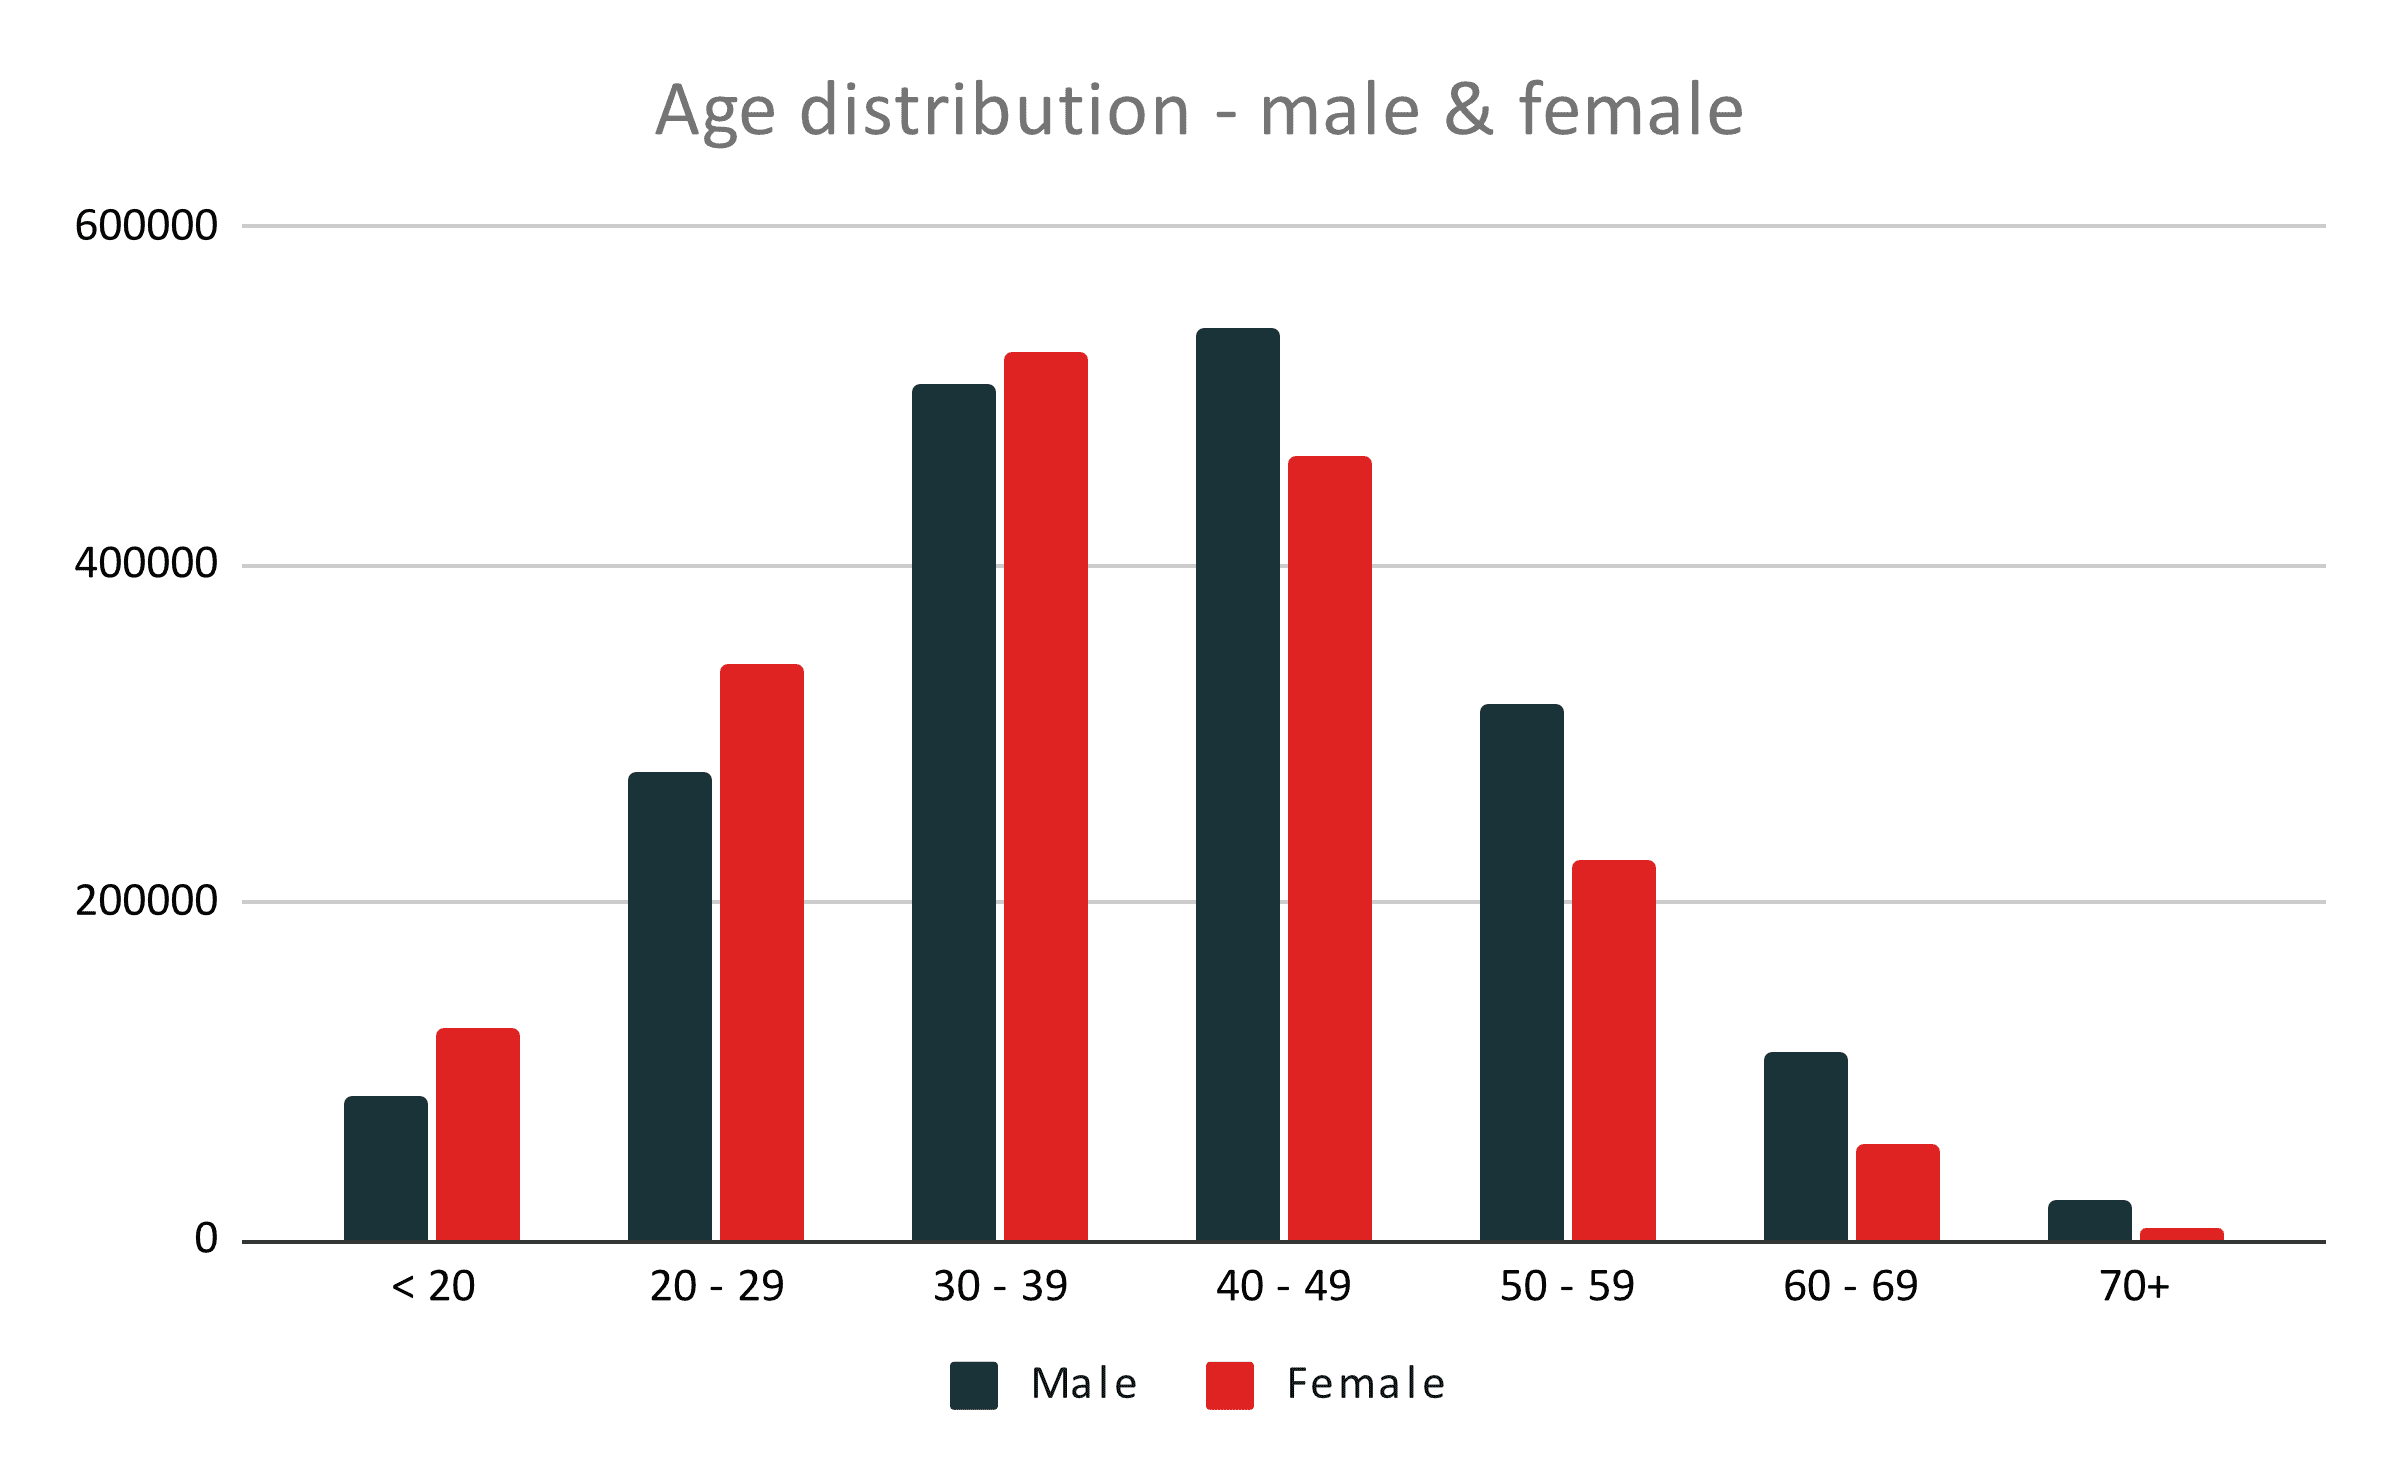
Trail runners are getting older.
In 2000 the average trail runner was 37.7 years old.
In 2022 the average trail runner is 39.5 years old.
The chart below shows the age of trail runners by gender. As you can see, men are typically older than women.
Women's representation in trail running
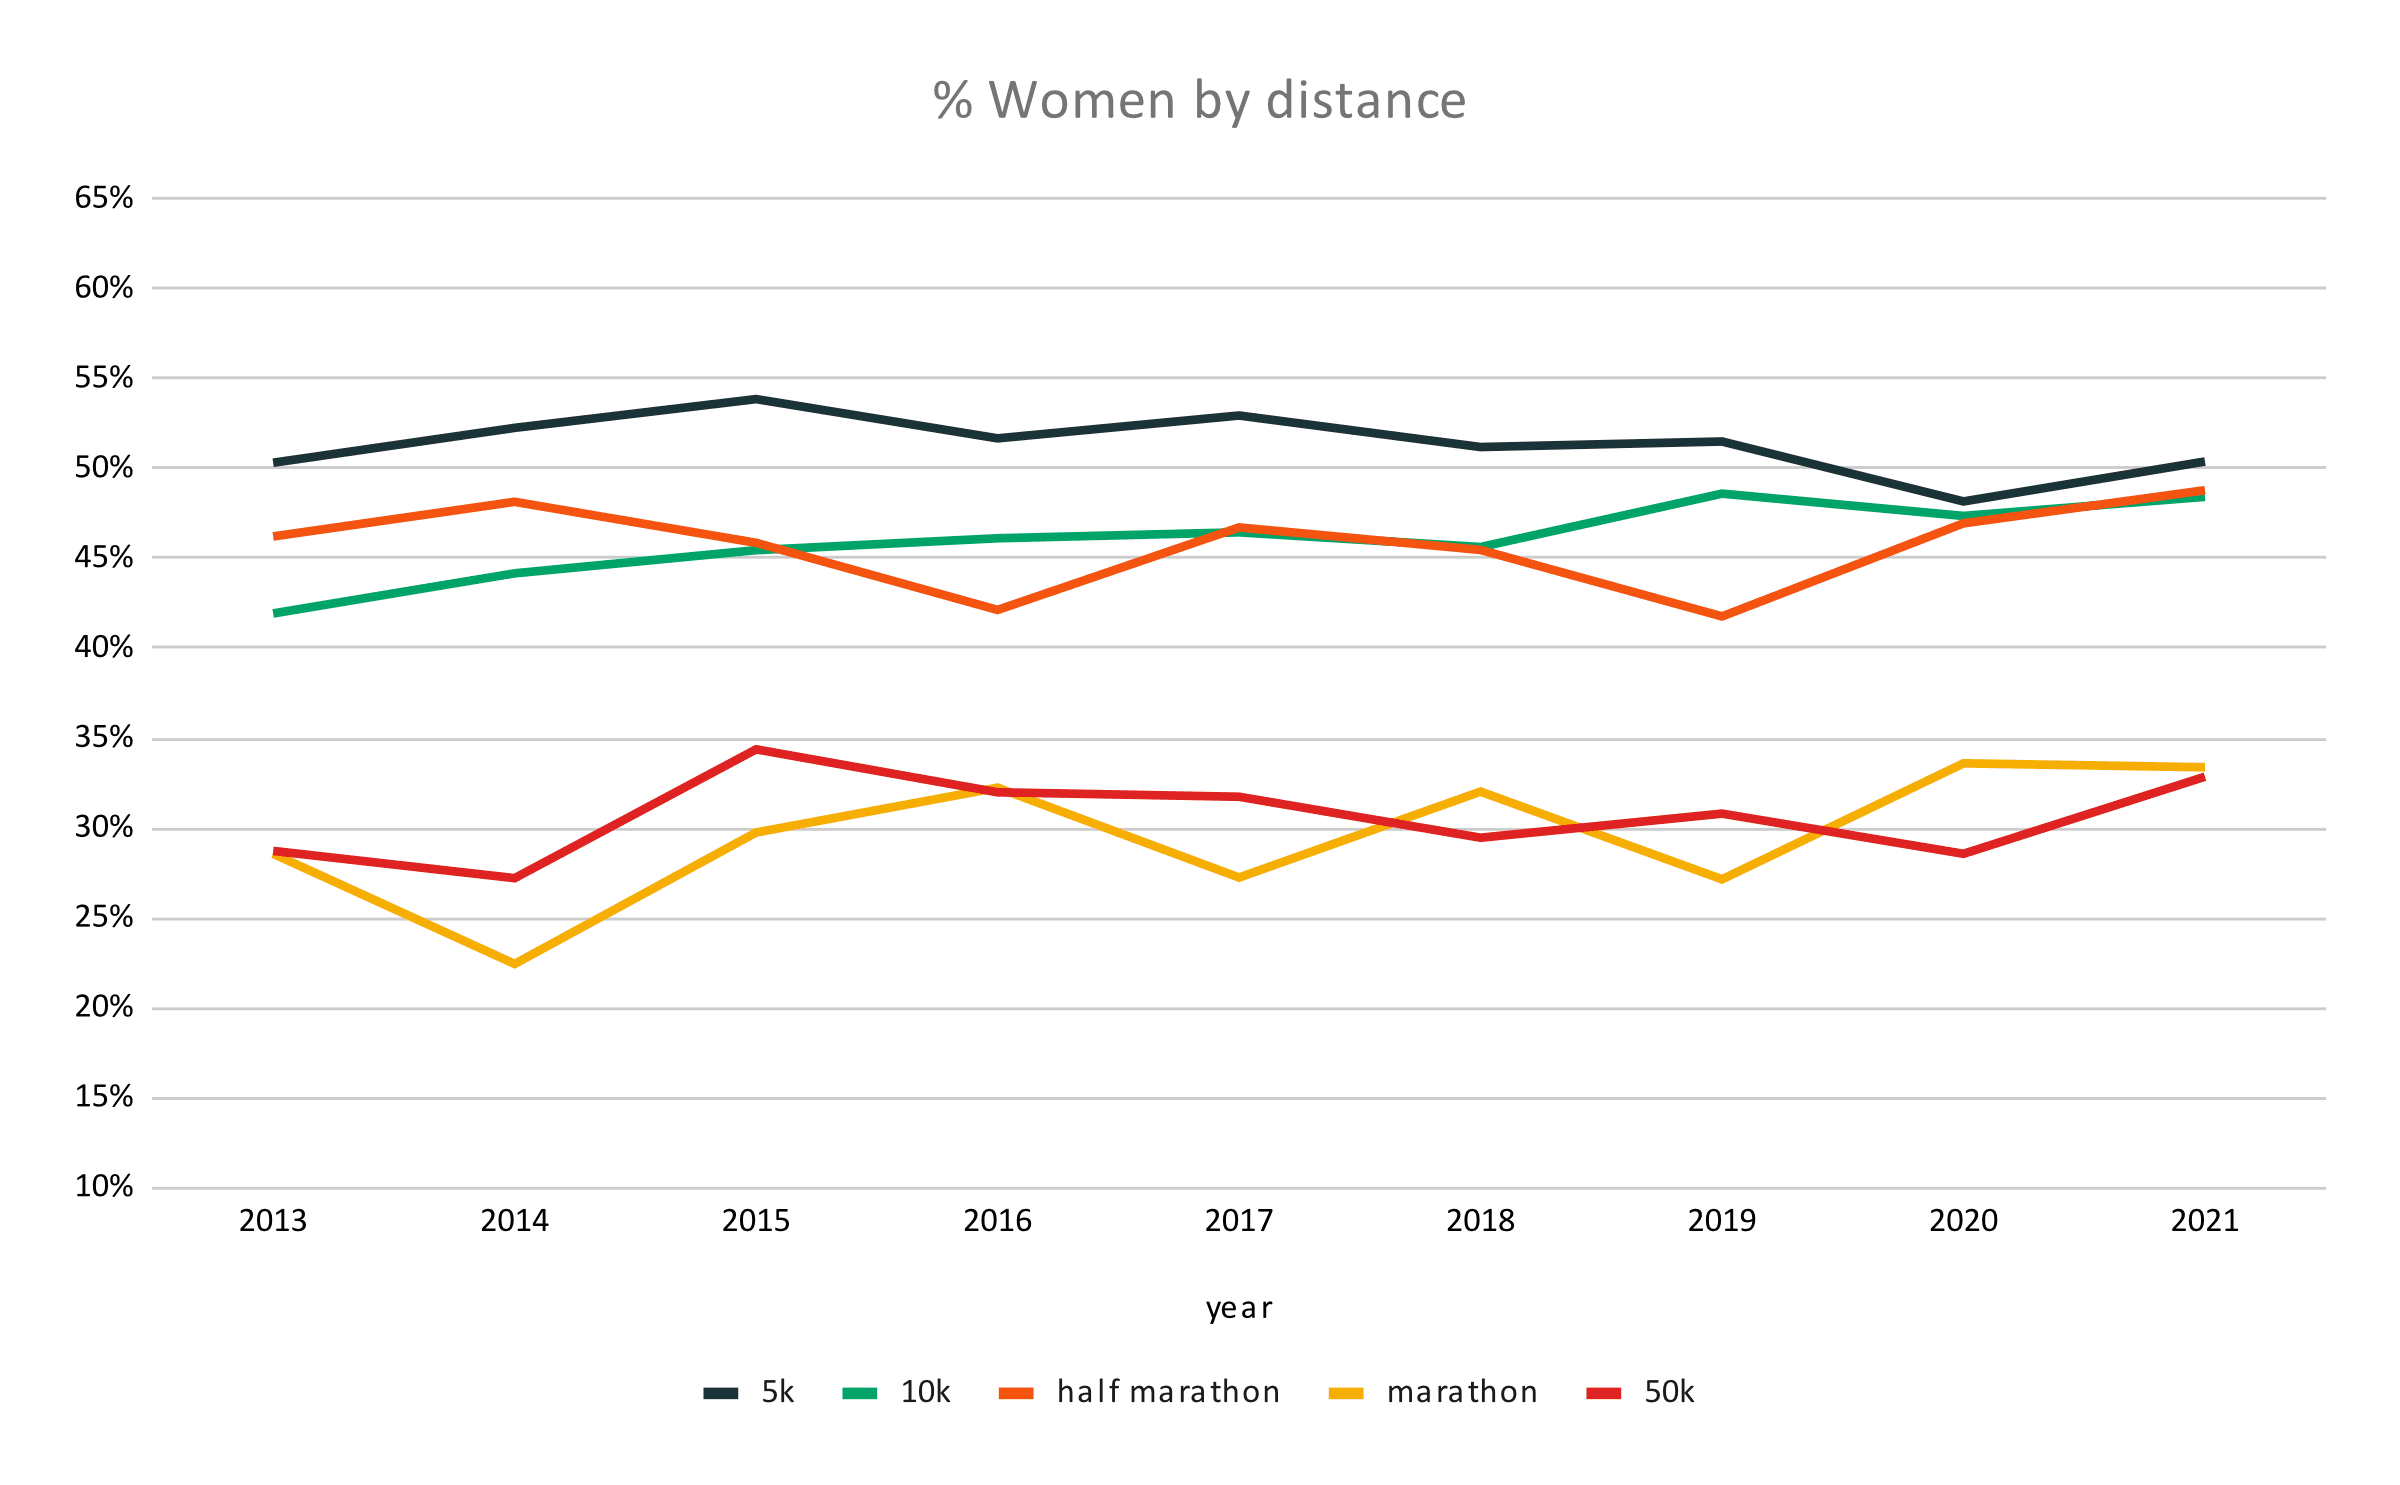
Back in 1997, only 13% of all trail runners were women. Today, women represent 46% (almost half) of all trail runners. And looking at distances below 10k, there are more women than men.
Men prefer long distances, women prefer short ones
Men are more attracted to longer distances. There’s a clear cut from the half marathon to the marathon, where we see a drop off from around 47% to just 33% female participation.
Countries with the most and the least female participants proportionally to men
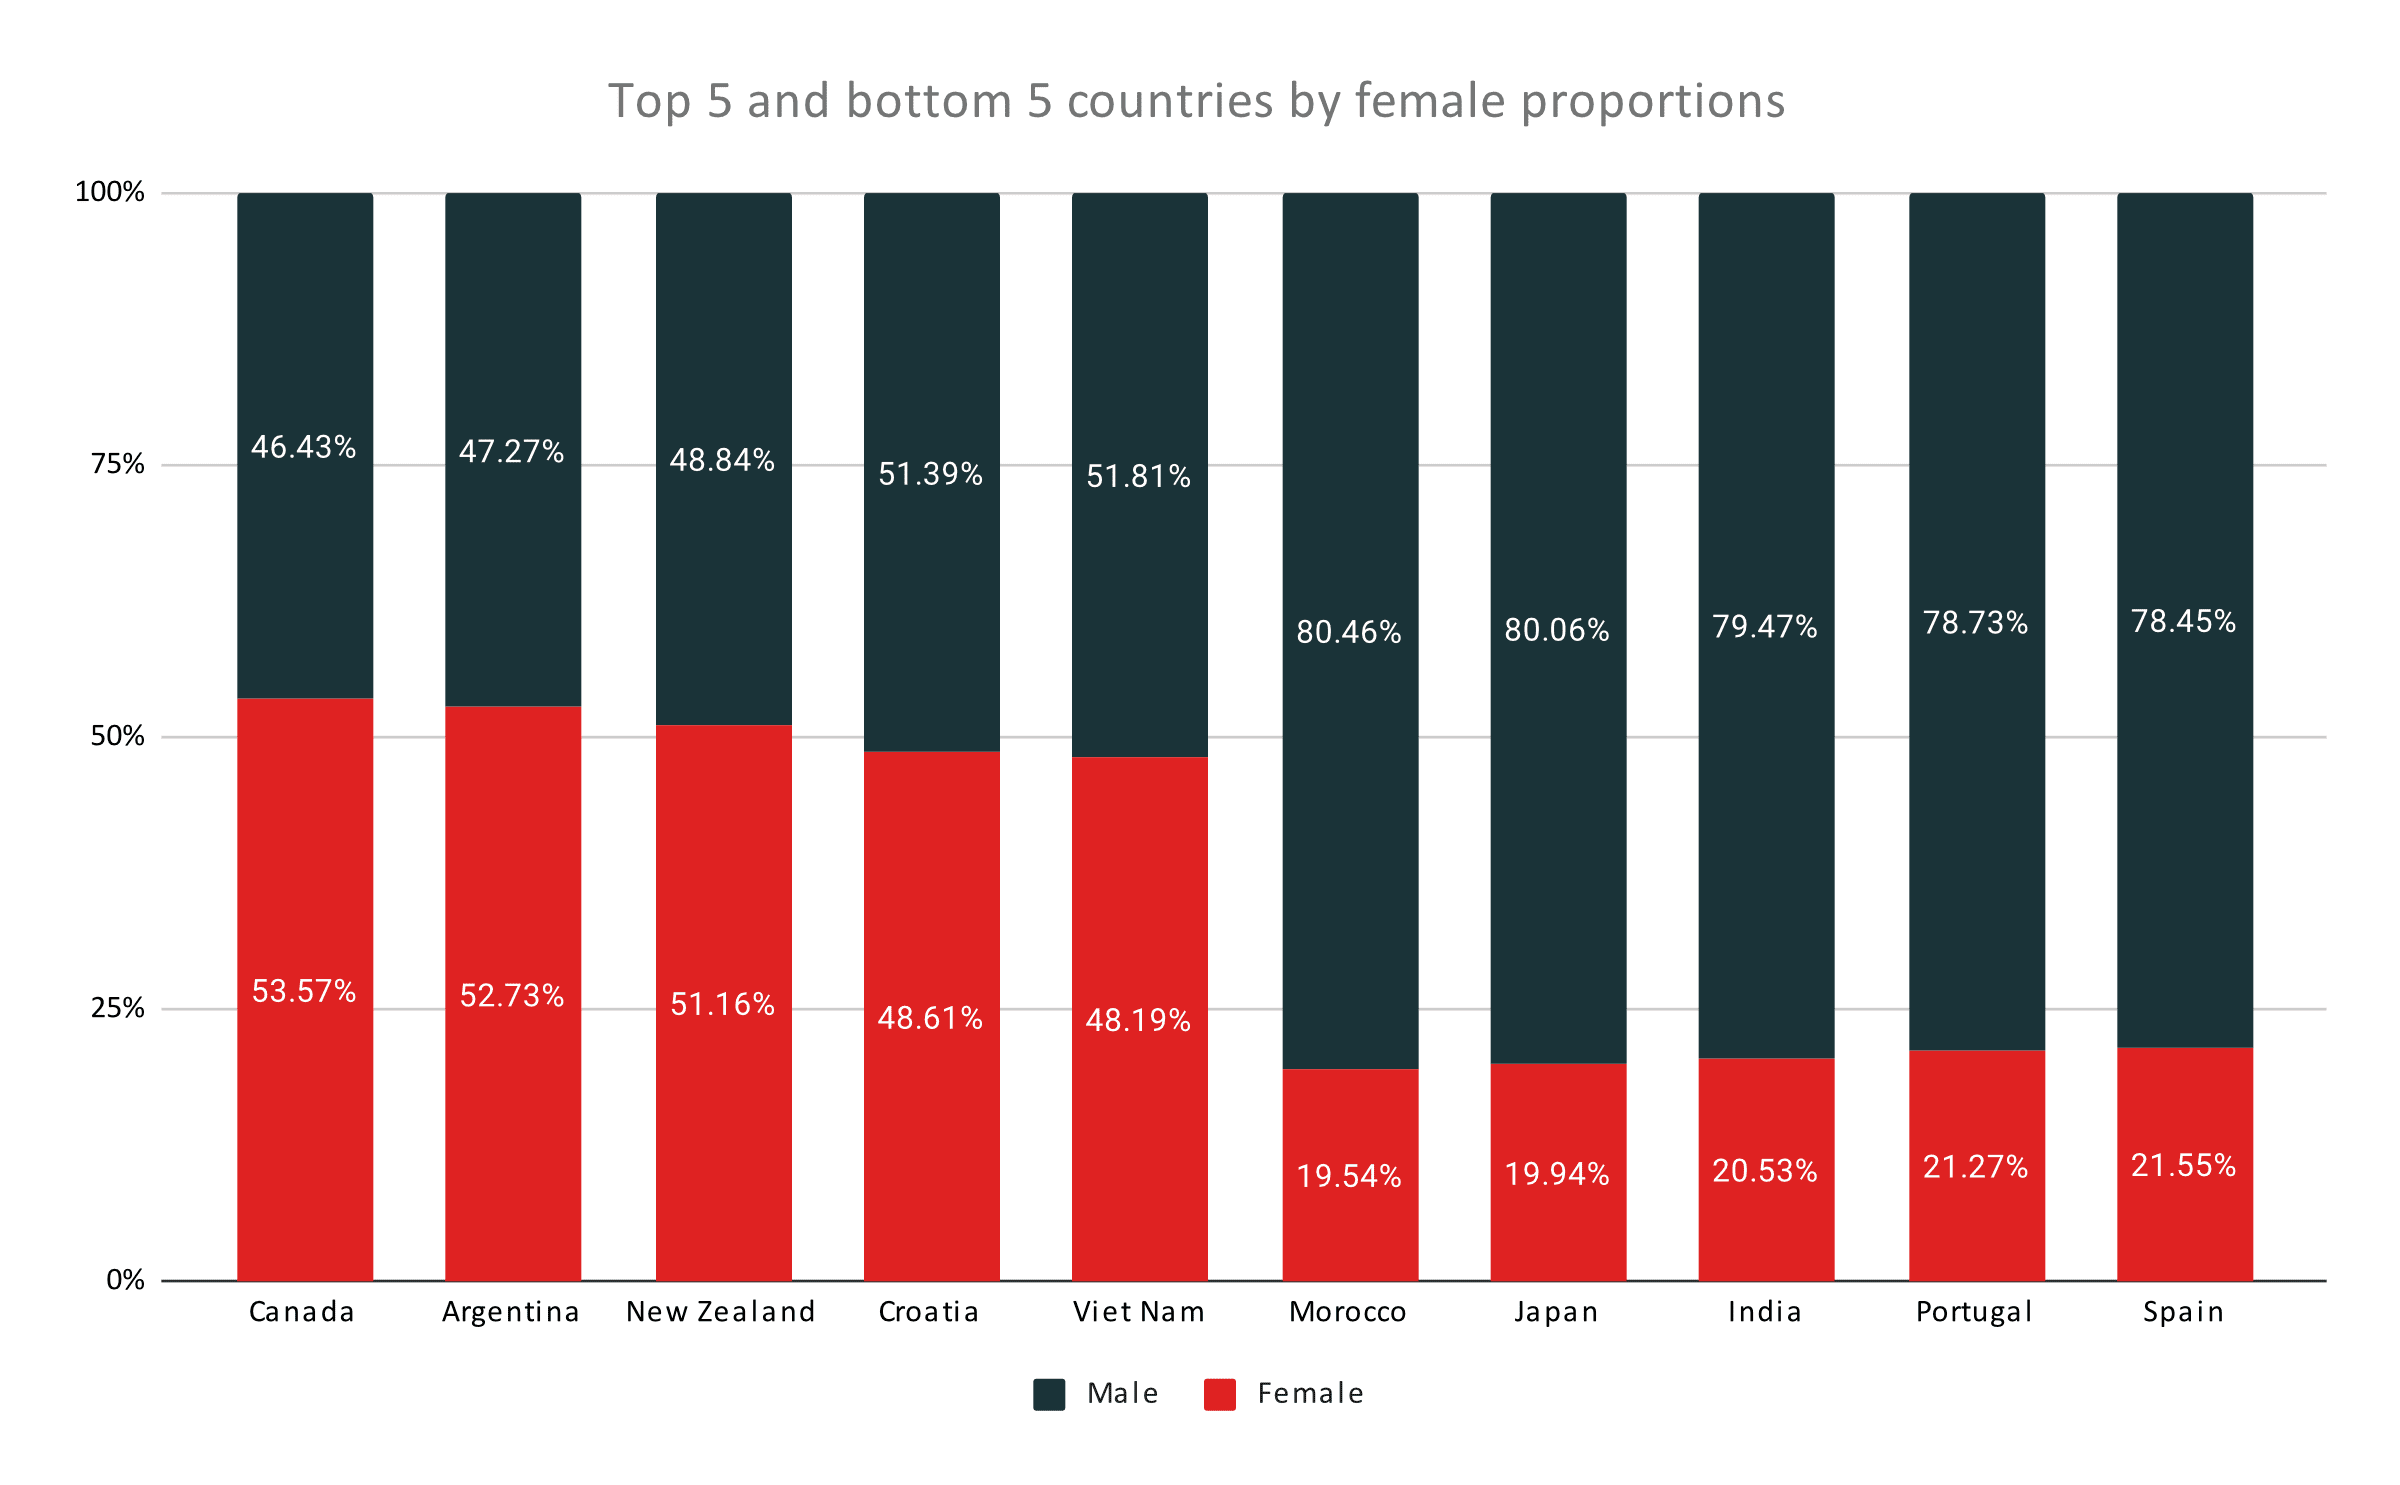
Canada, Argentina, and New Zealand have more female trail runners than male trail runners. These are the only three nations with more female than male runners.
At the other end of the spectrum, Morocco has only 19.54% female representation along with many other countries with around 20% female participation (Japan, India, Portugal, Spain).
In Europe itself, it’s clear that the more south the country is located, the more male-dominated trail running is.
In what climate are more trail races held?
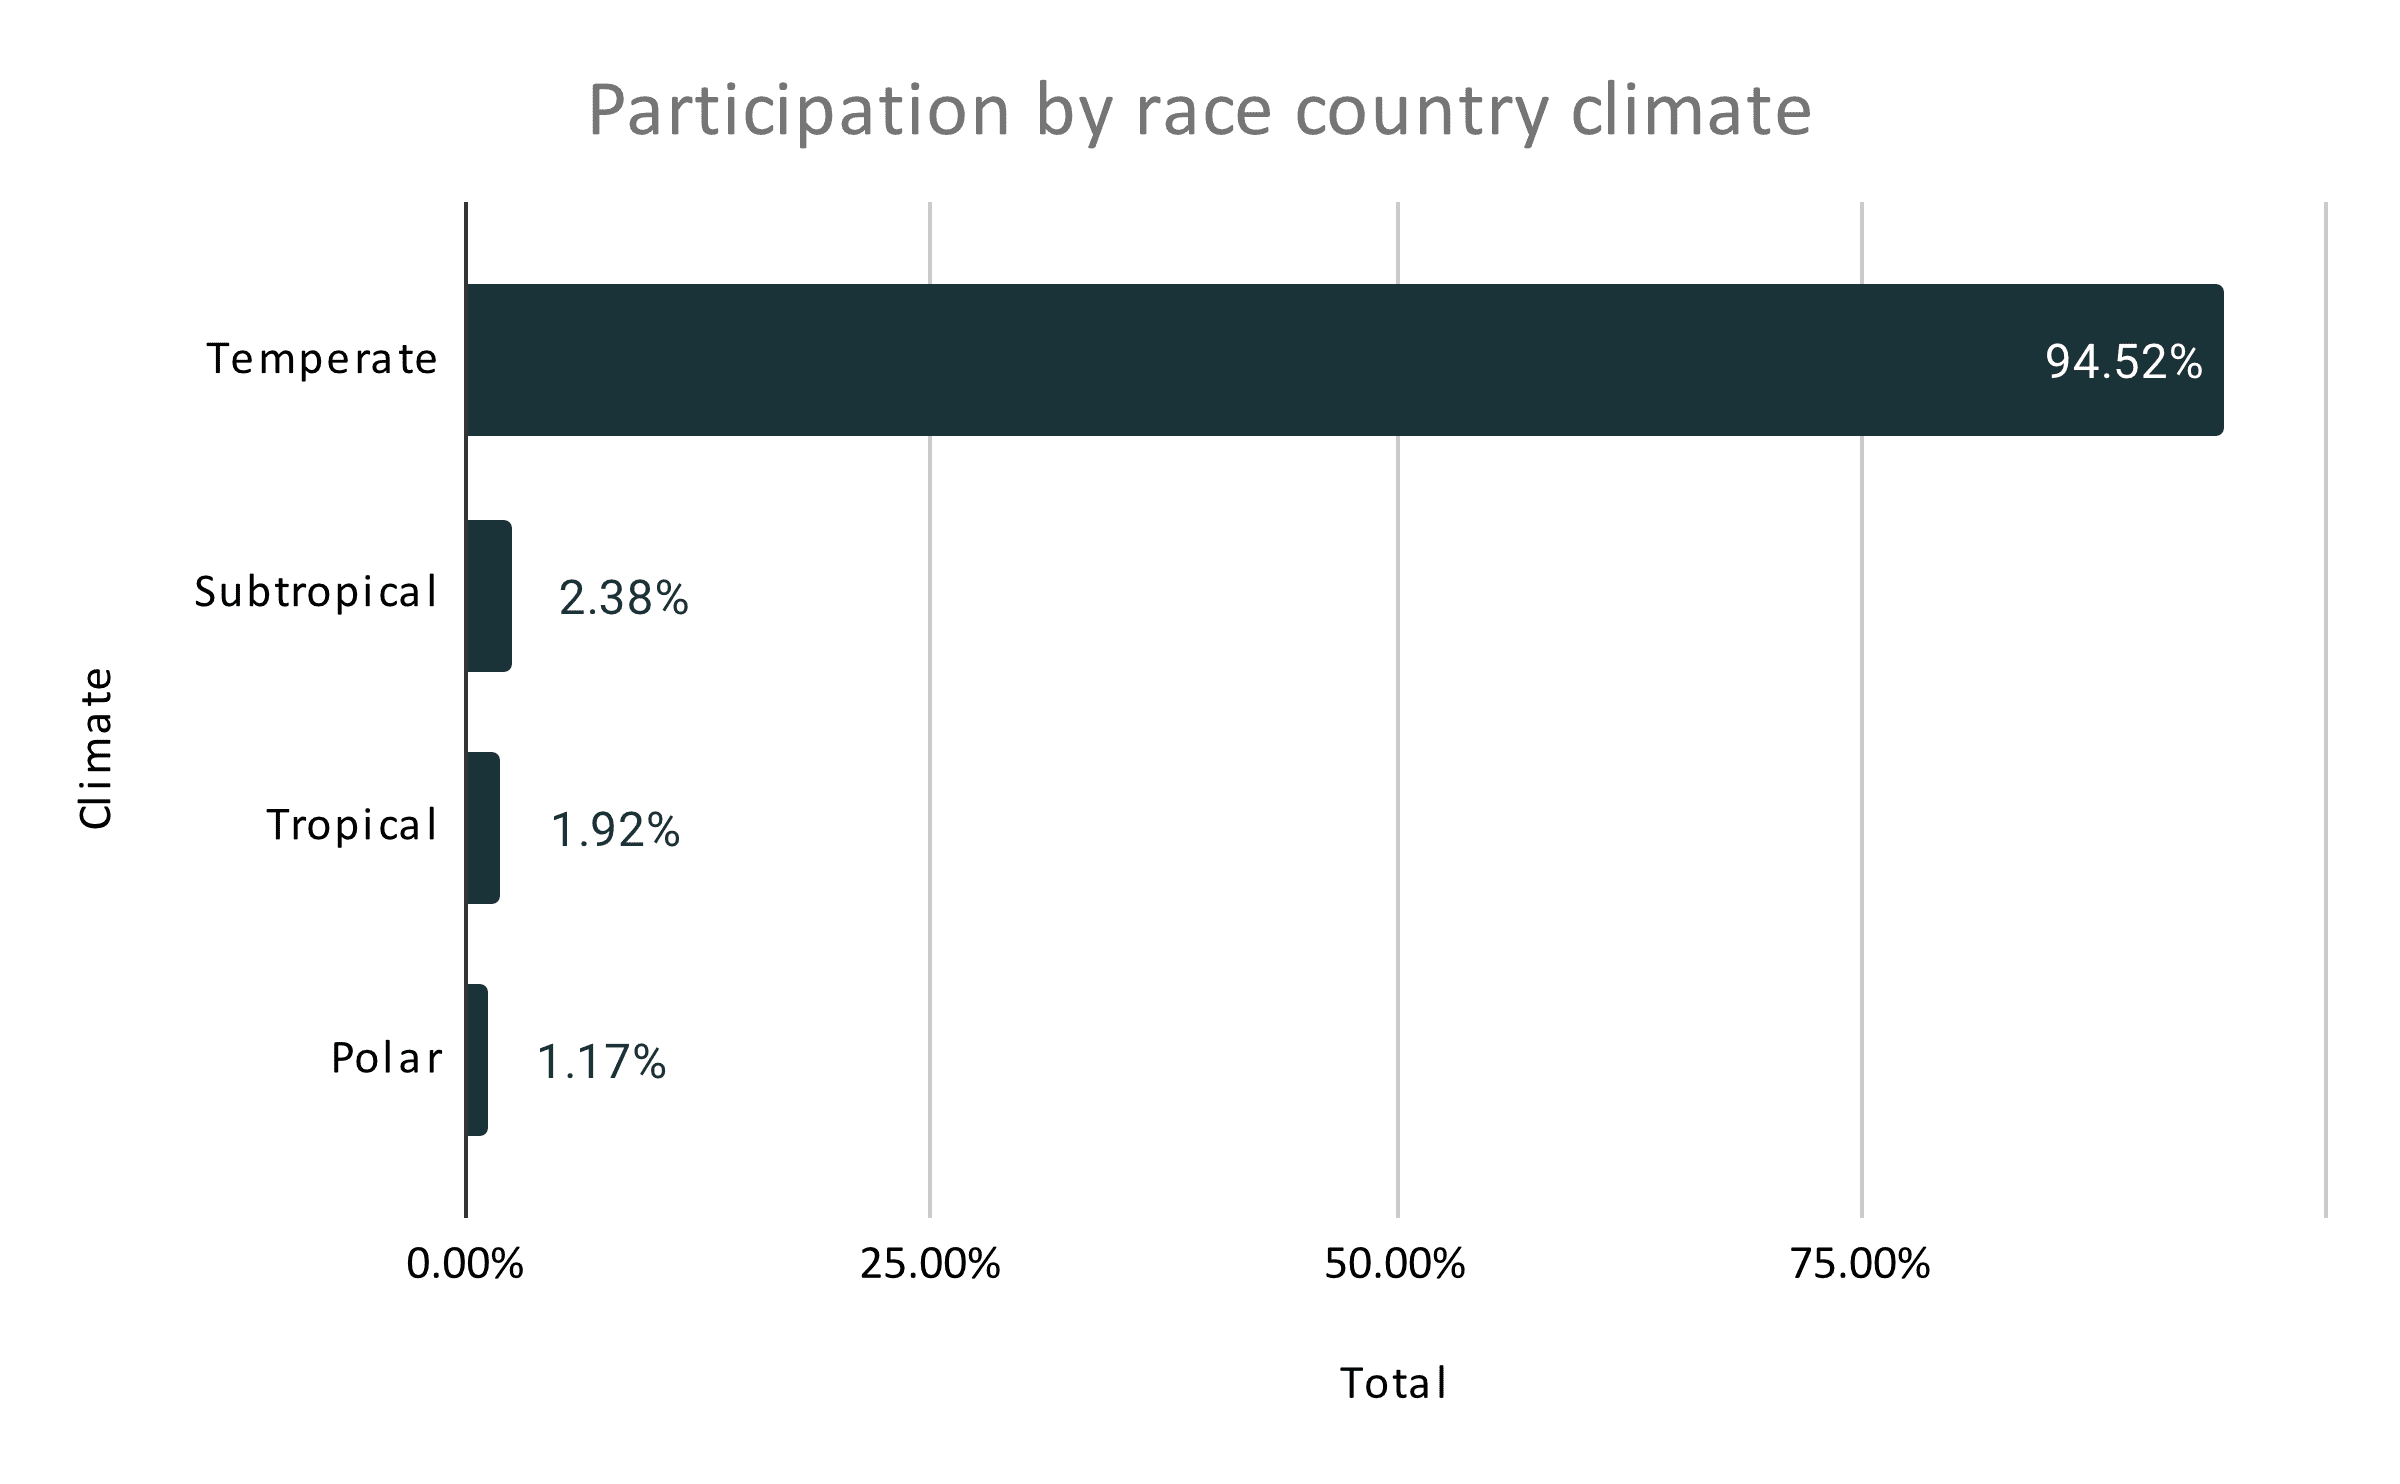
Temperate!
