Nike Shoes Statistics
Nike dominates the shoe market of the 21st century which is why it was ranked by Forbes as the 13th most valuable company today. To know more about the latest facts and figures from Nike, we compiled and summarised them in this report.
Top Nike shoes statistics
- Nike closed the 2022 season with $29.2 billion in footwear, about 62.5% of its global revenues.
- Nike holds 38.2% of the total footwear market in 2022.
- In athletic footwear it garnered 30% market share while in trainers the figure is 38.5%.
- Nike has doubled its market share in basketball shoes from 43% in 1987 to 86% in 2019.
- The male end-user segment of Nike is 67.4%. Consequently, the women end-user segment is 32.6%.
- But in terms of products, 44.2% of Nike shoes are for men while 38.1% are exclusive for females. The rest are unisex.
- As of 2023, Nike is expected to produce about 800 million pairs of shoes annually.
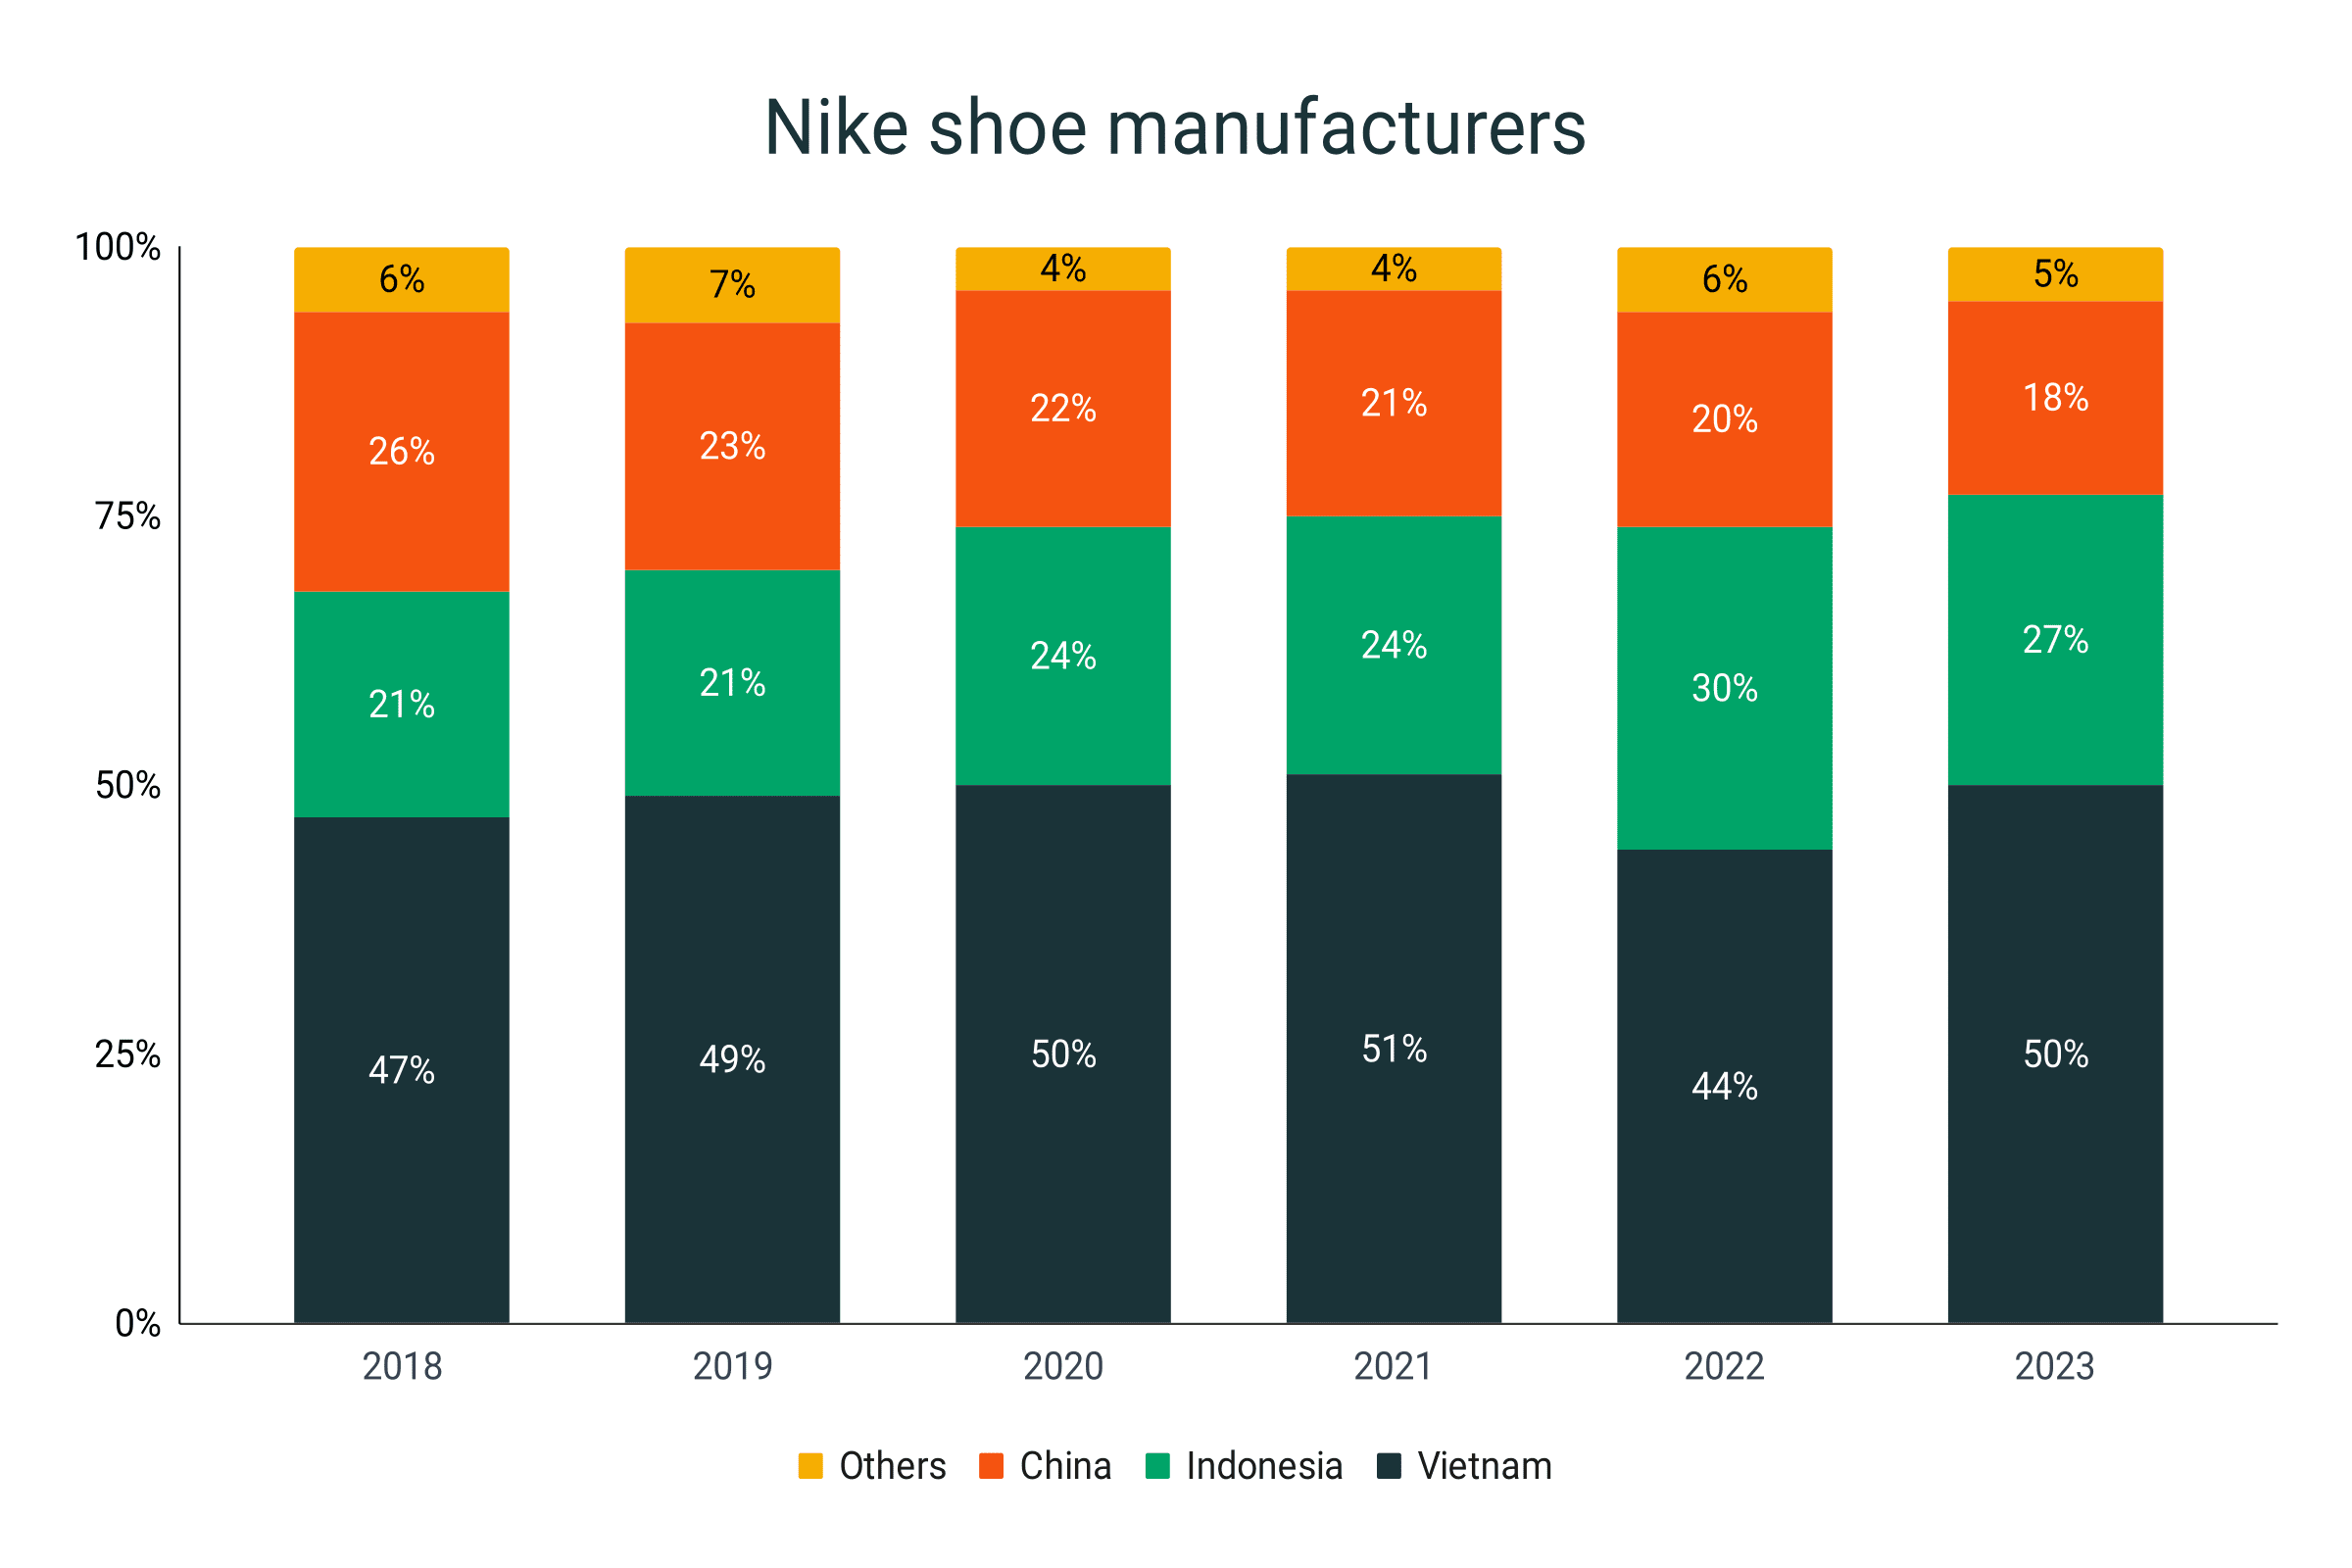
- Made in Vietnam Nike shoes are half of the entire bulk produced in 2023. Indonesian-made Nike accounted for 27%.
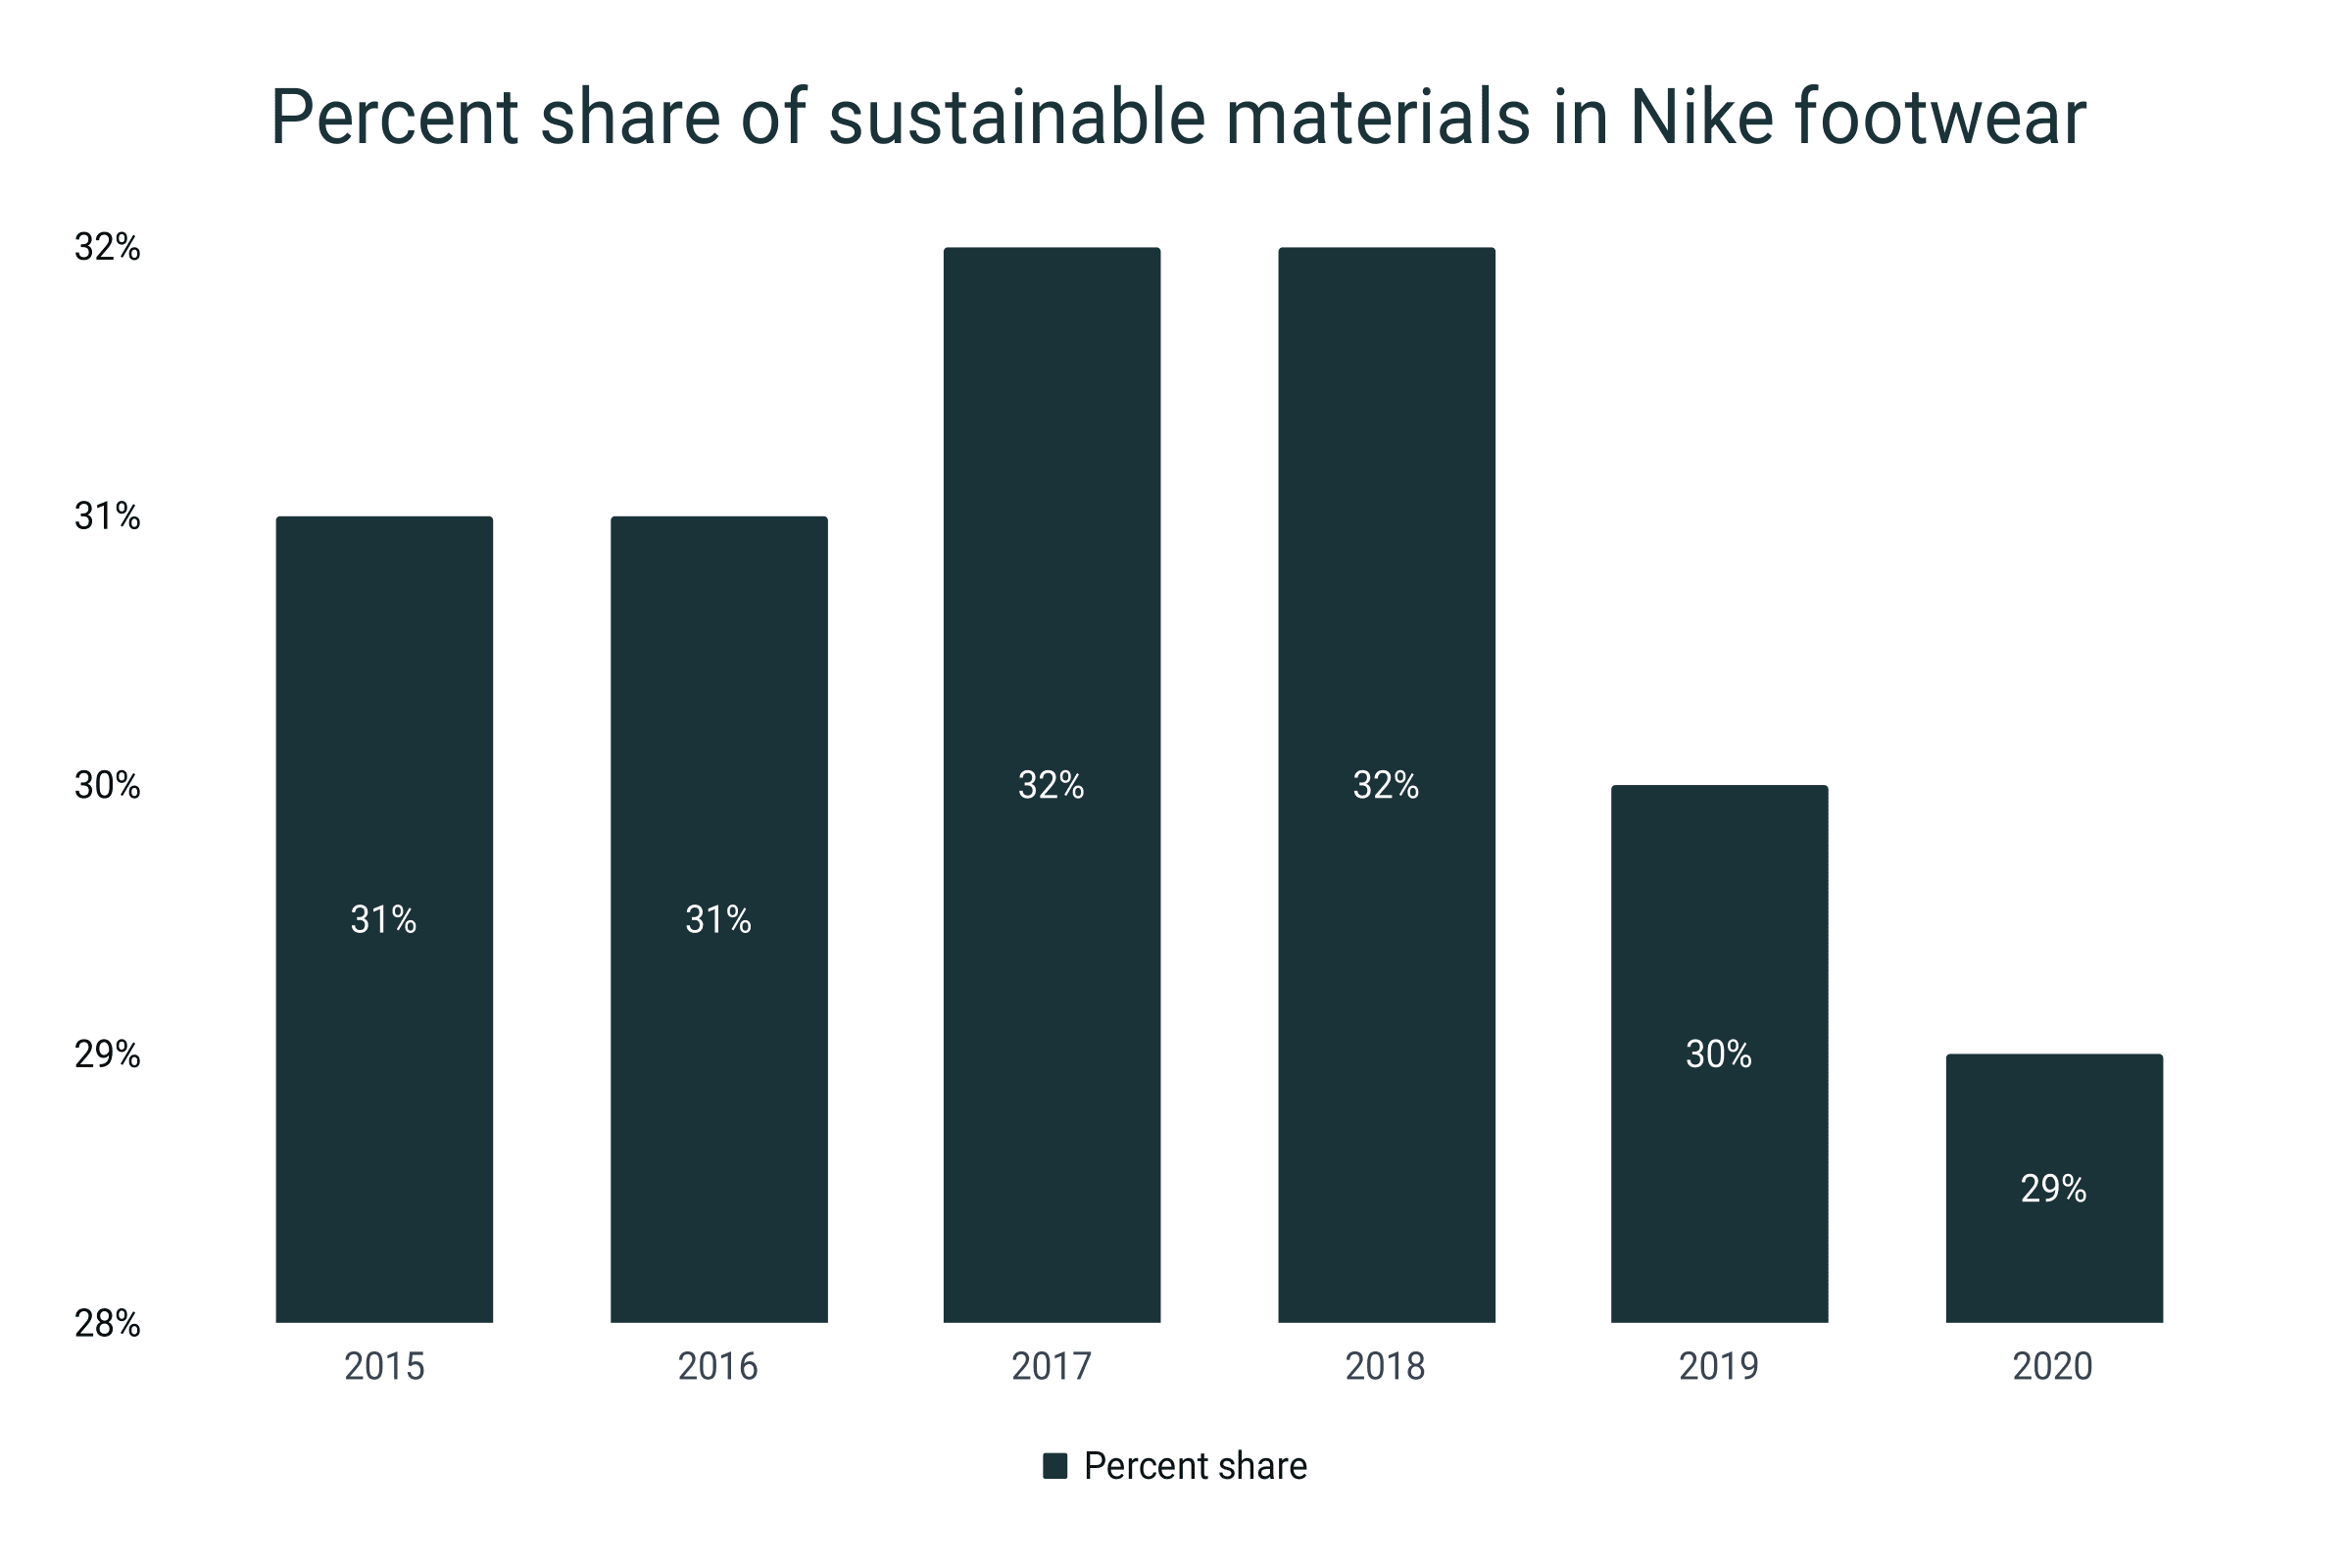
- Since 2015, Nike has used about 31% of sustainable materials in its shoe manufacturing process.
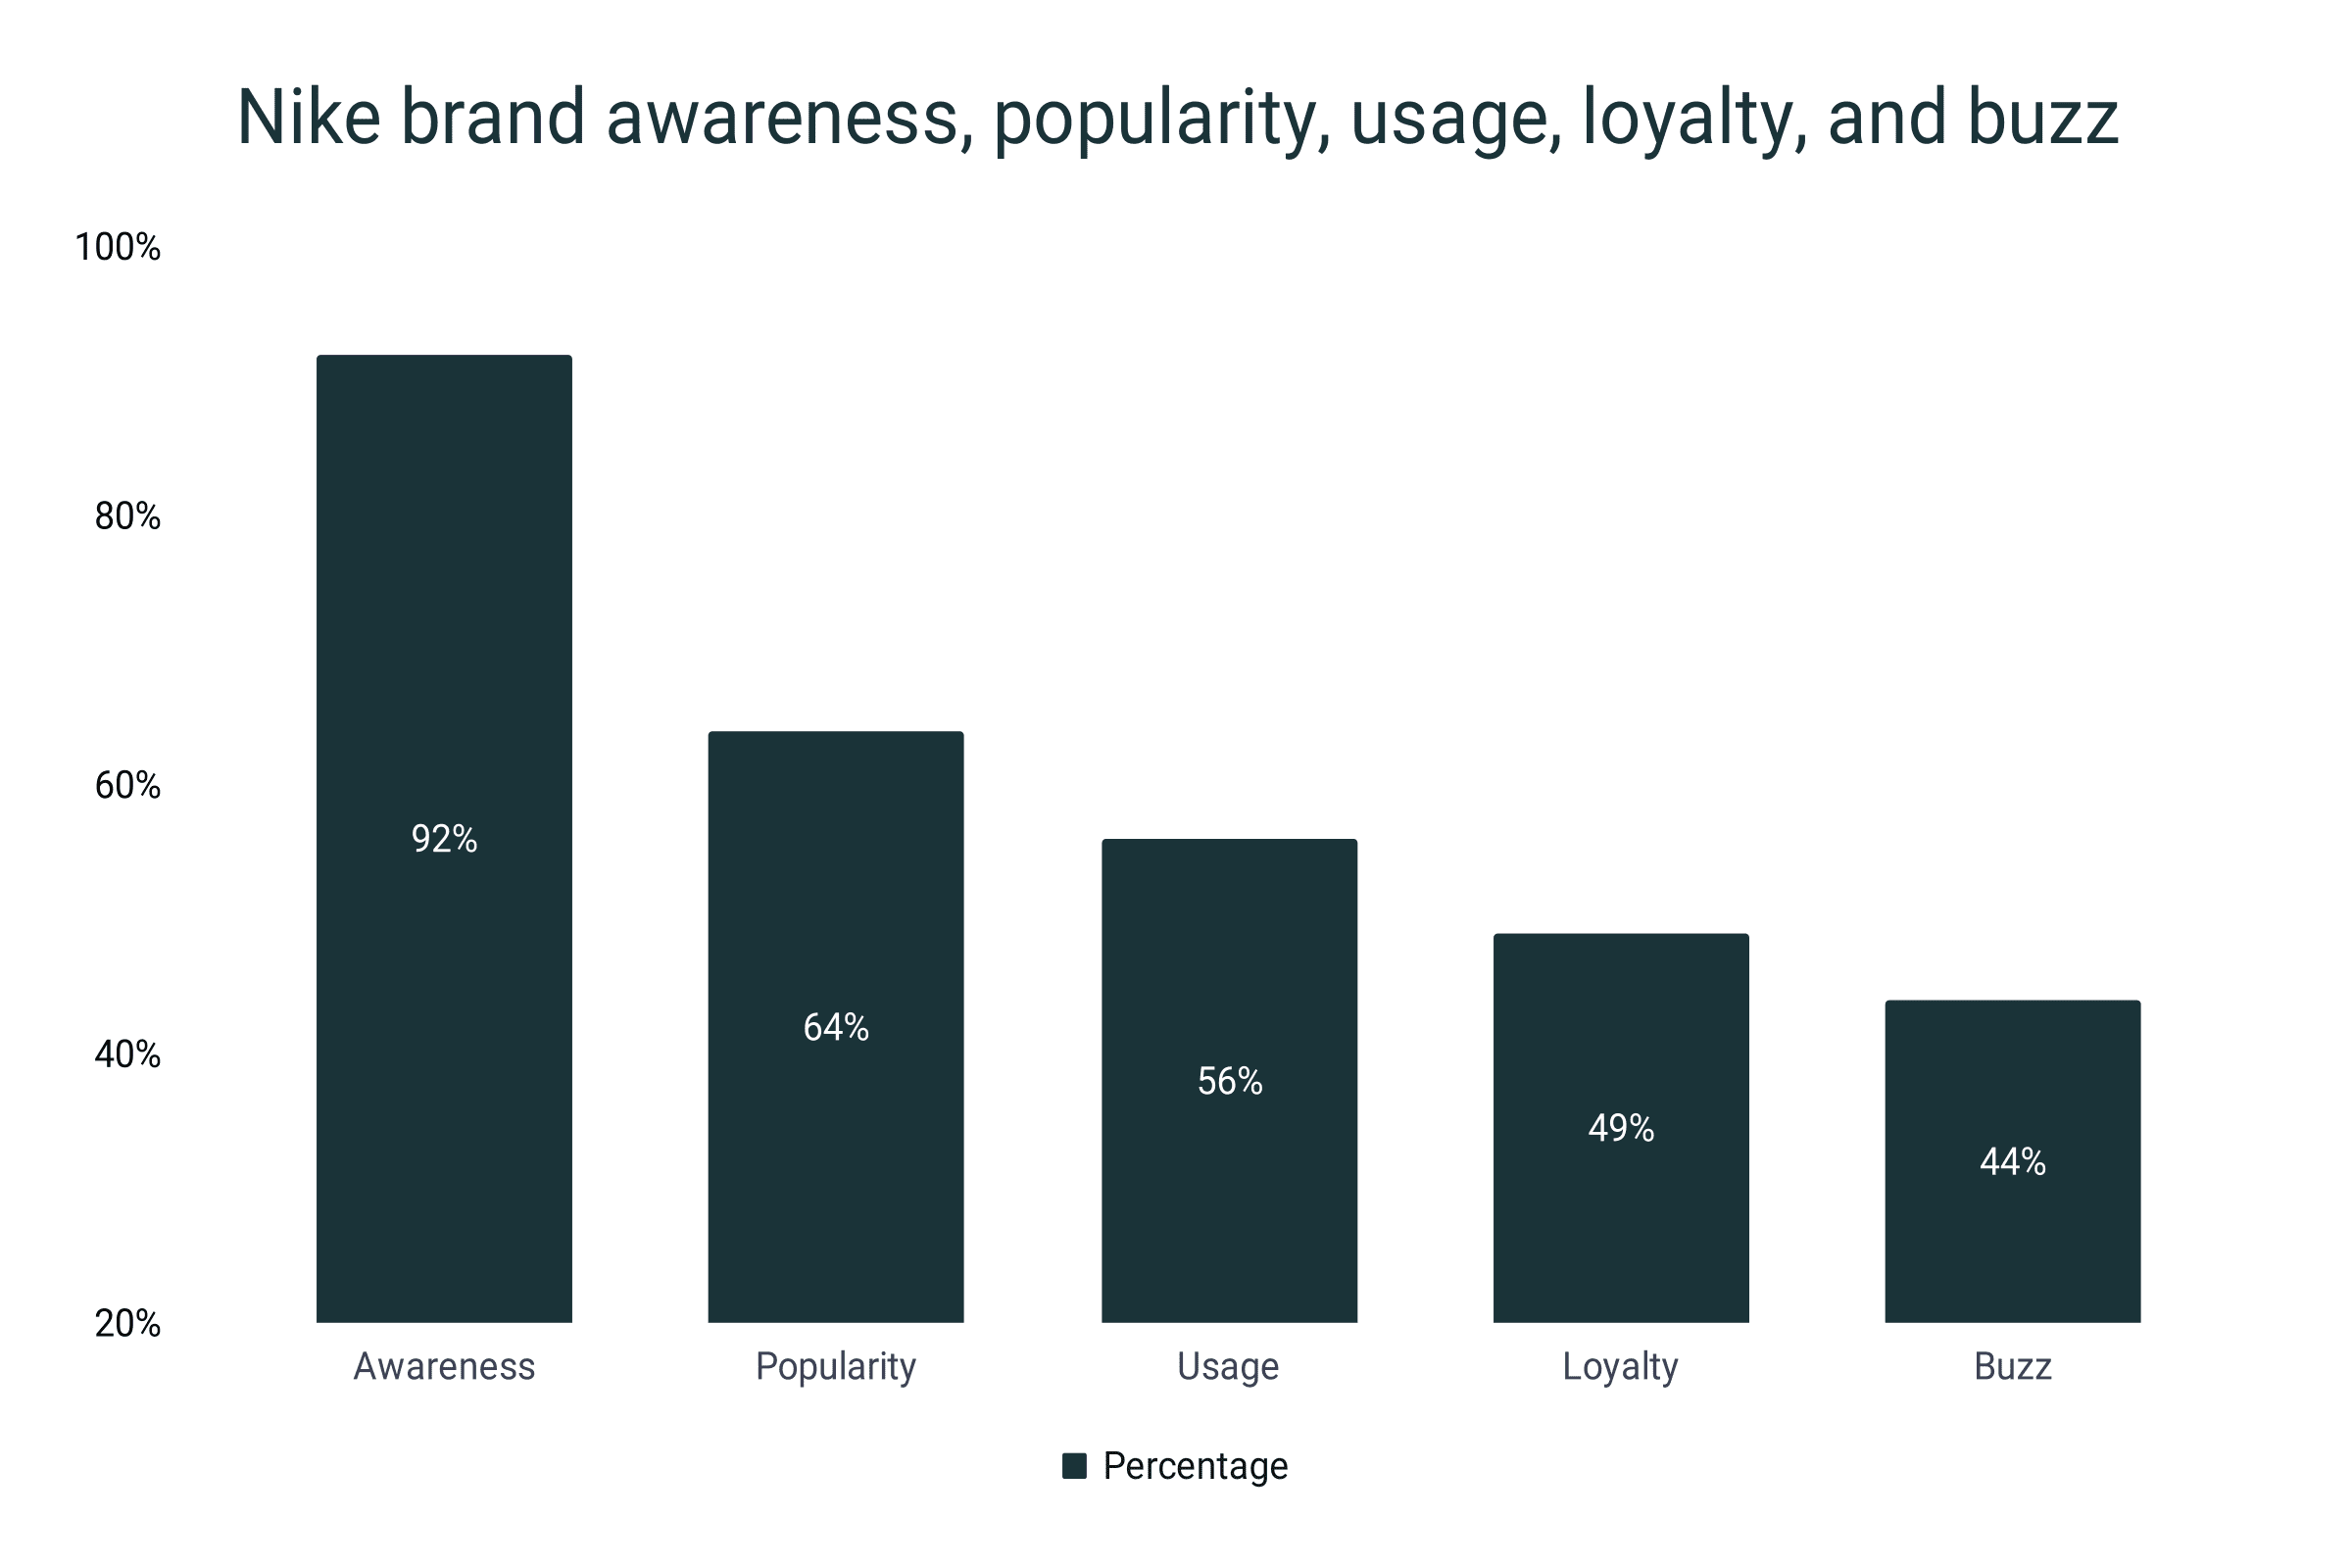
- Fifty-six percent of American consumers are using Nike shoes. However, only 49% are loyal to the brand.
Nike shoe revenue by year
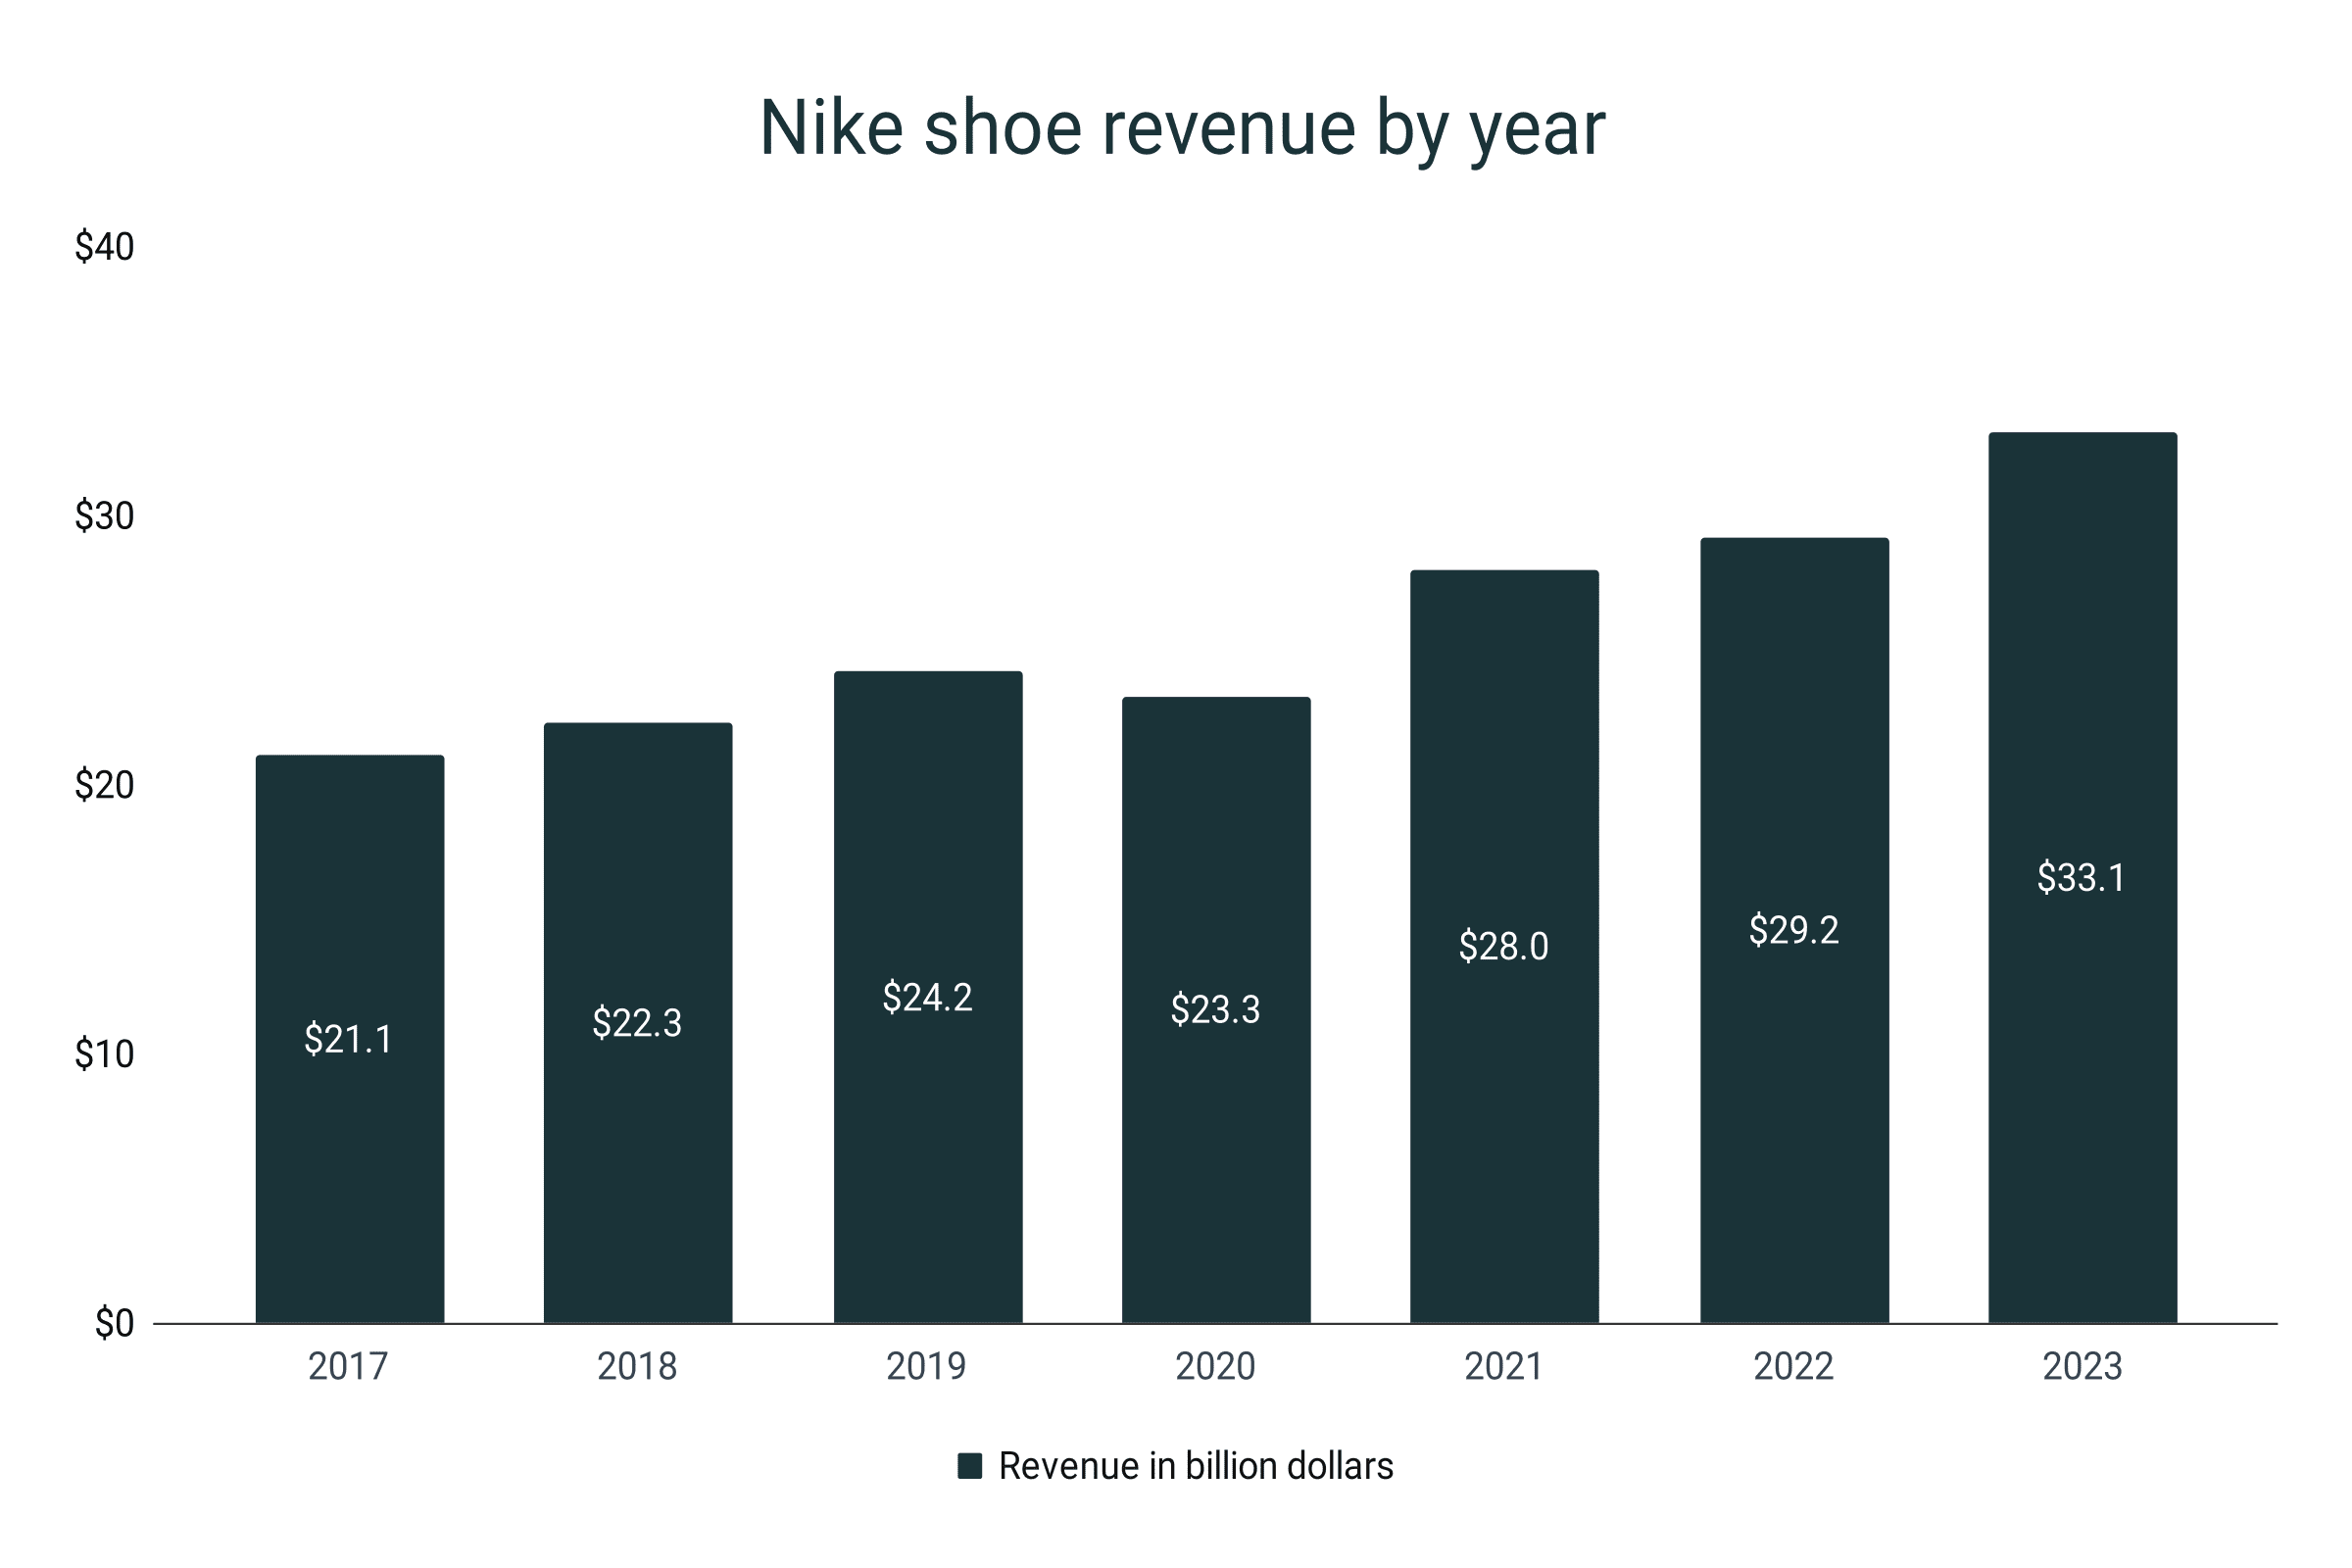
- In 2022, the total shoe revenue of Nike reached $29.2 billion.
- This is 4.3% more than the $28-billion figure in 2021.
- The highest percentage increase in total revenue for the last five years was recorded in 2021 when the figure rose by 20.2% compared to 2020.
- On the other hand, the only time Nike’s revenue dropped was during the height of the pandemic in 2021 when the company experienced a 3.75 dip.
- Comparing the value from 2017, Nike's shoe revenue has grown by 38.4%.
Nike shoe revenue by year
|
Year |
Revenue in billion dollars |
Growth |
|
2017 |
$21.1 |
|
|
2018 |
$22.3 |
5.7% |
|
2019 |
$24.2 |
8.5% |
|
2020 |
$23.3 |
-3.7% |
|
2021 |
$28.0 |
20.2% |
|
2022 |
$29.2 |
4.3% |
|
2023 |
$33.1 |
13.4% |
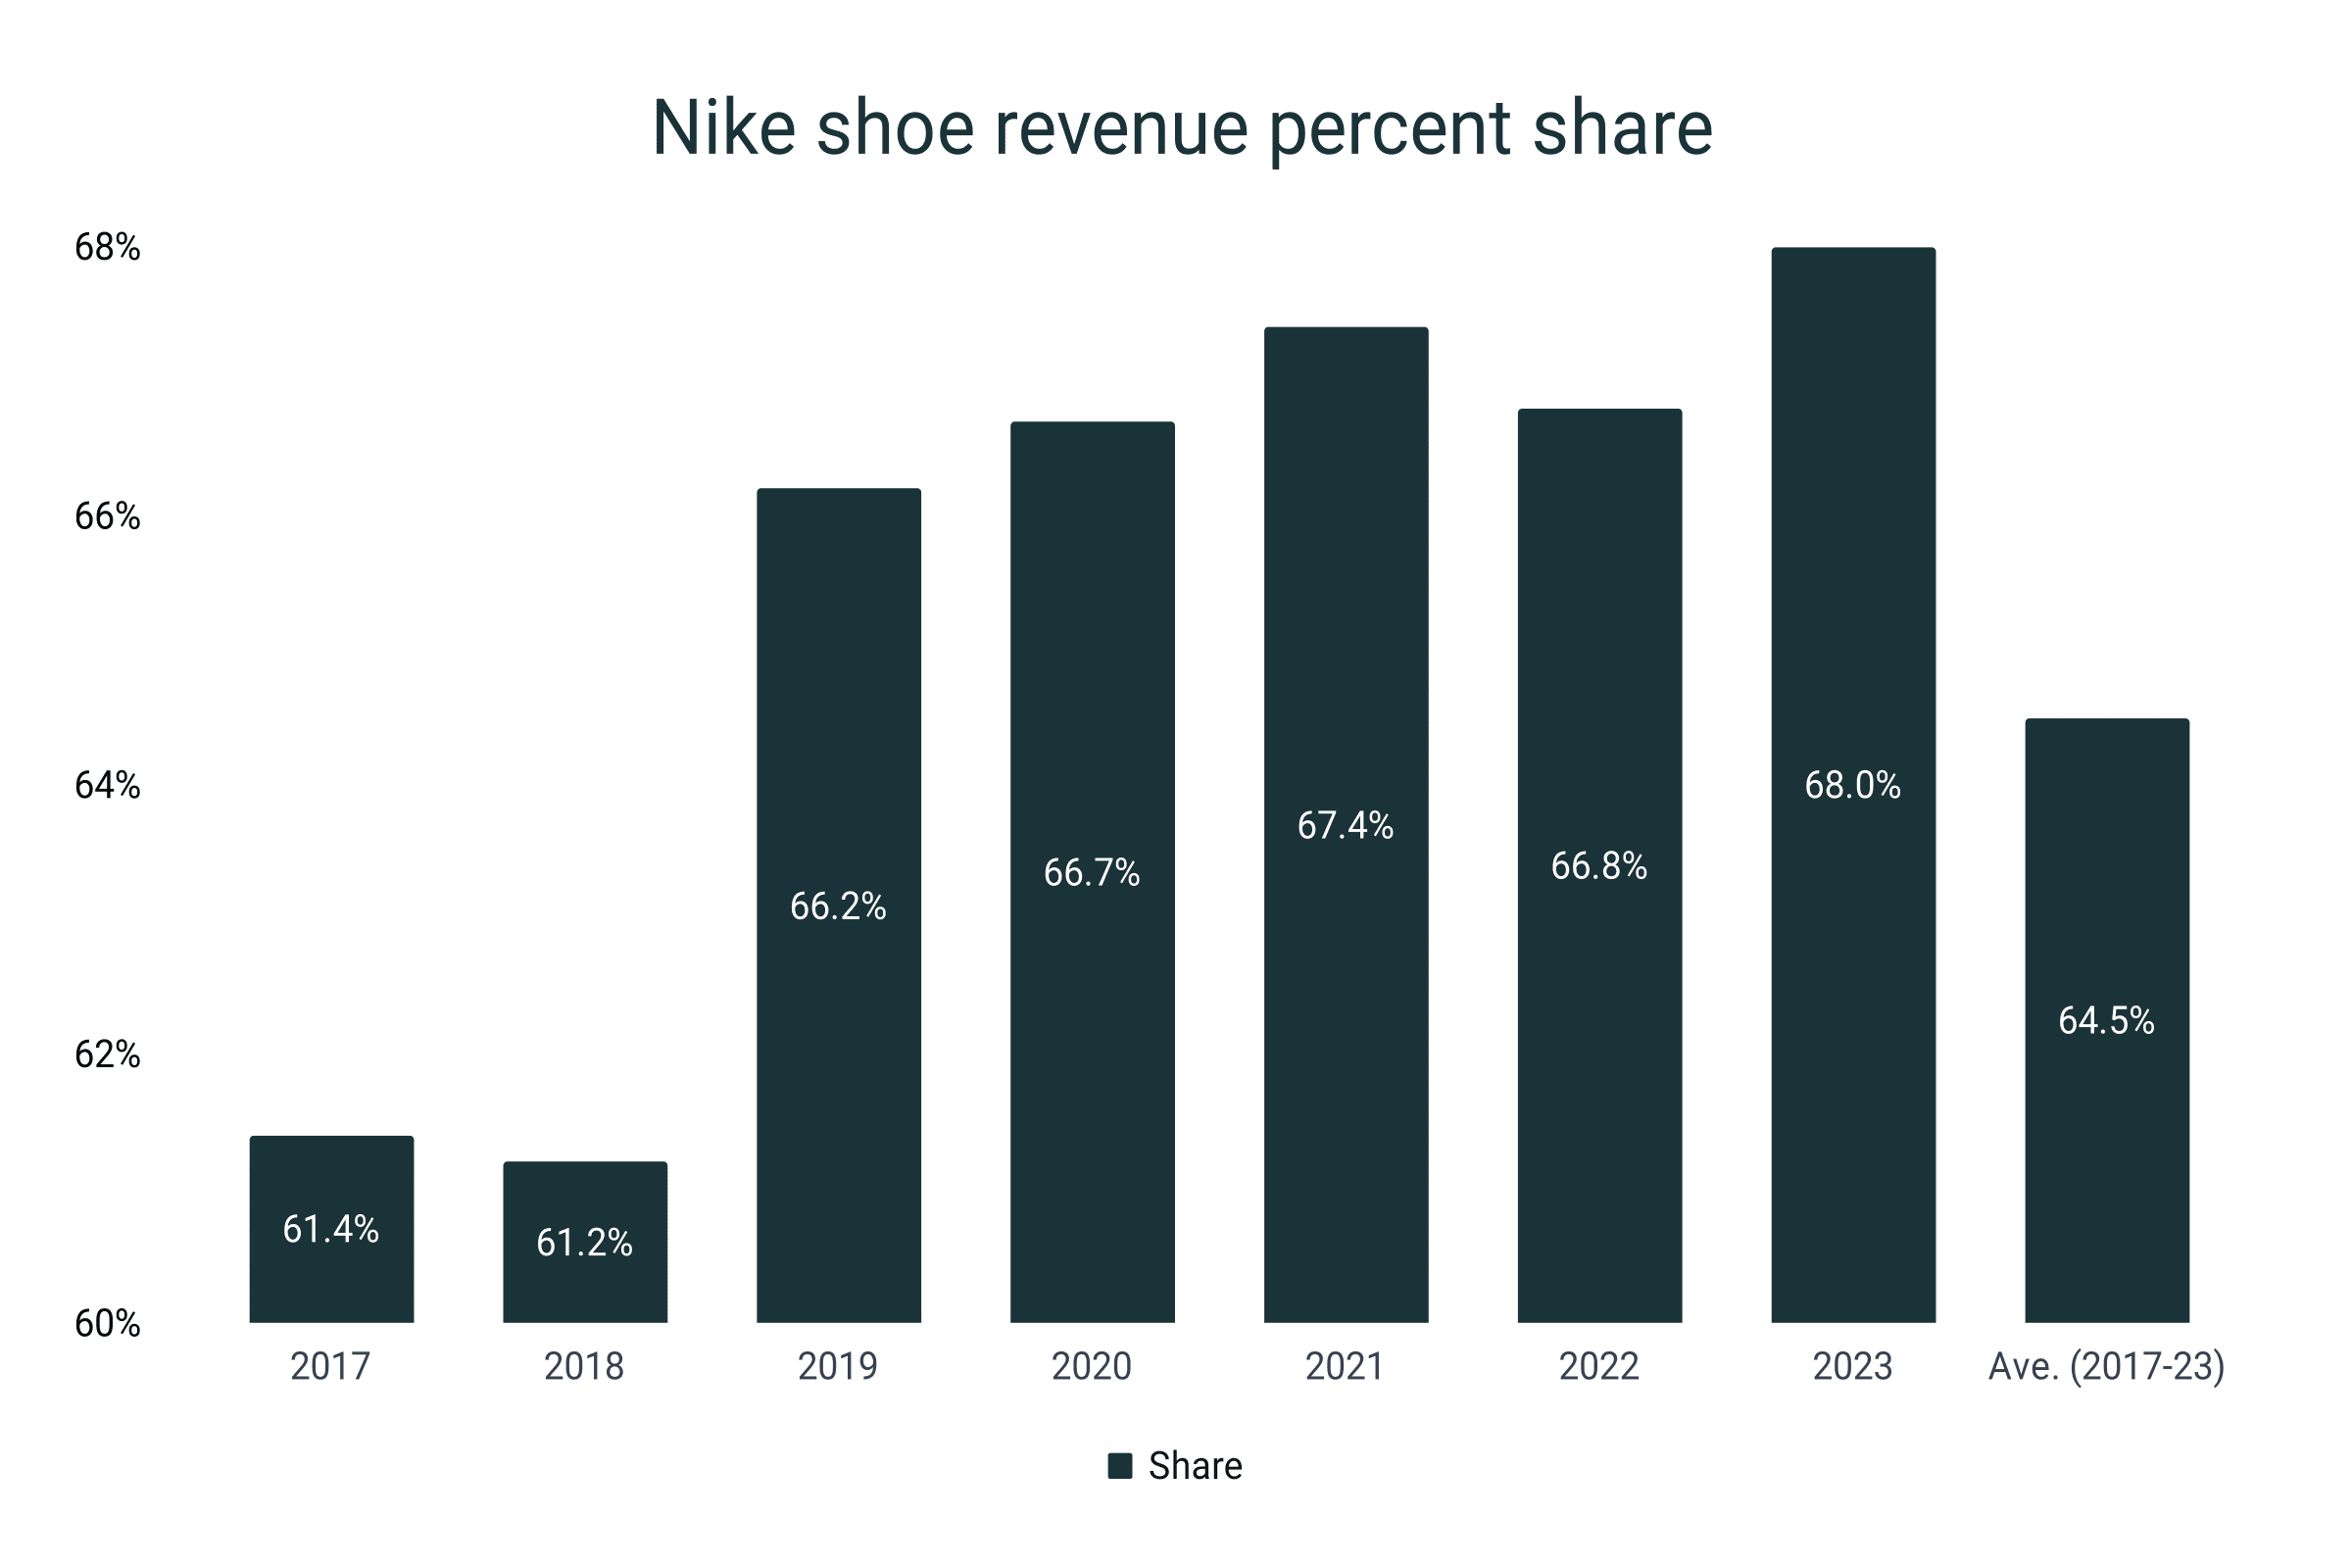
- Relative to the total company revenue, Nike’s footwear section registered a 68% share in 2023.
- This is a 1.3-point increase from last year’s 66.8%.
- Surprisingly, during the pandemic, Nike’s footwear revenue share increased from 66.2% to 66.7%. It continued to grow as high as 67.4% by 2021.
- However, by 2022, the revenue share of shoe products dropped to 66.8%.
- Although the total sales of Nike footwear did not decrease, the reason for the reduction in its percent share is caused by the increase in the sales of Nike apparel, taking up 29% in 2021 and then 29.9% in 2022.
- On average, from 2017-2022, the Nike shoe market comprises 64.5% of Nike’s total company revenue.
Nike shoe revenue percent share
|
Year |
Share |
|
2017 |
61.4% |
|
2018 |
61.2% |
|
2019 |
66.2% |
|
2020 |
66.7% |
|
2021 |
67.4% |
|
2022 |
66.8% |
|
2023 |
68% |
|
Ave. (2017-23) |
64.5% |
Nike shoe market share
- Nike holds 38.2% of the total footwear market in 2022.
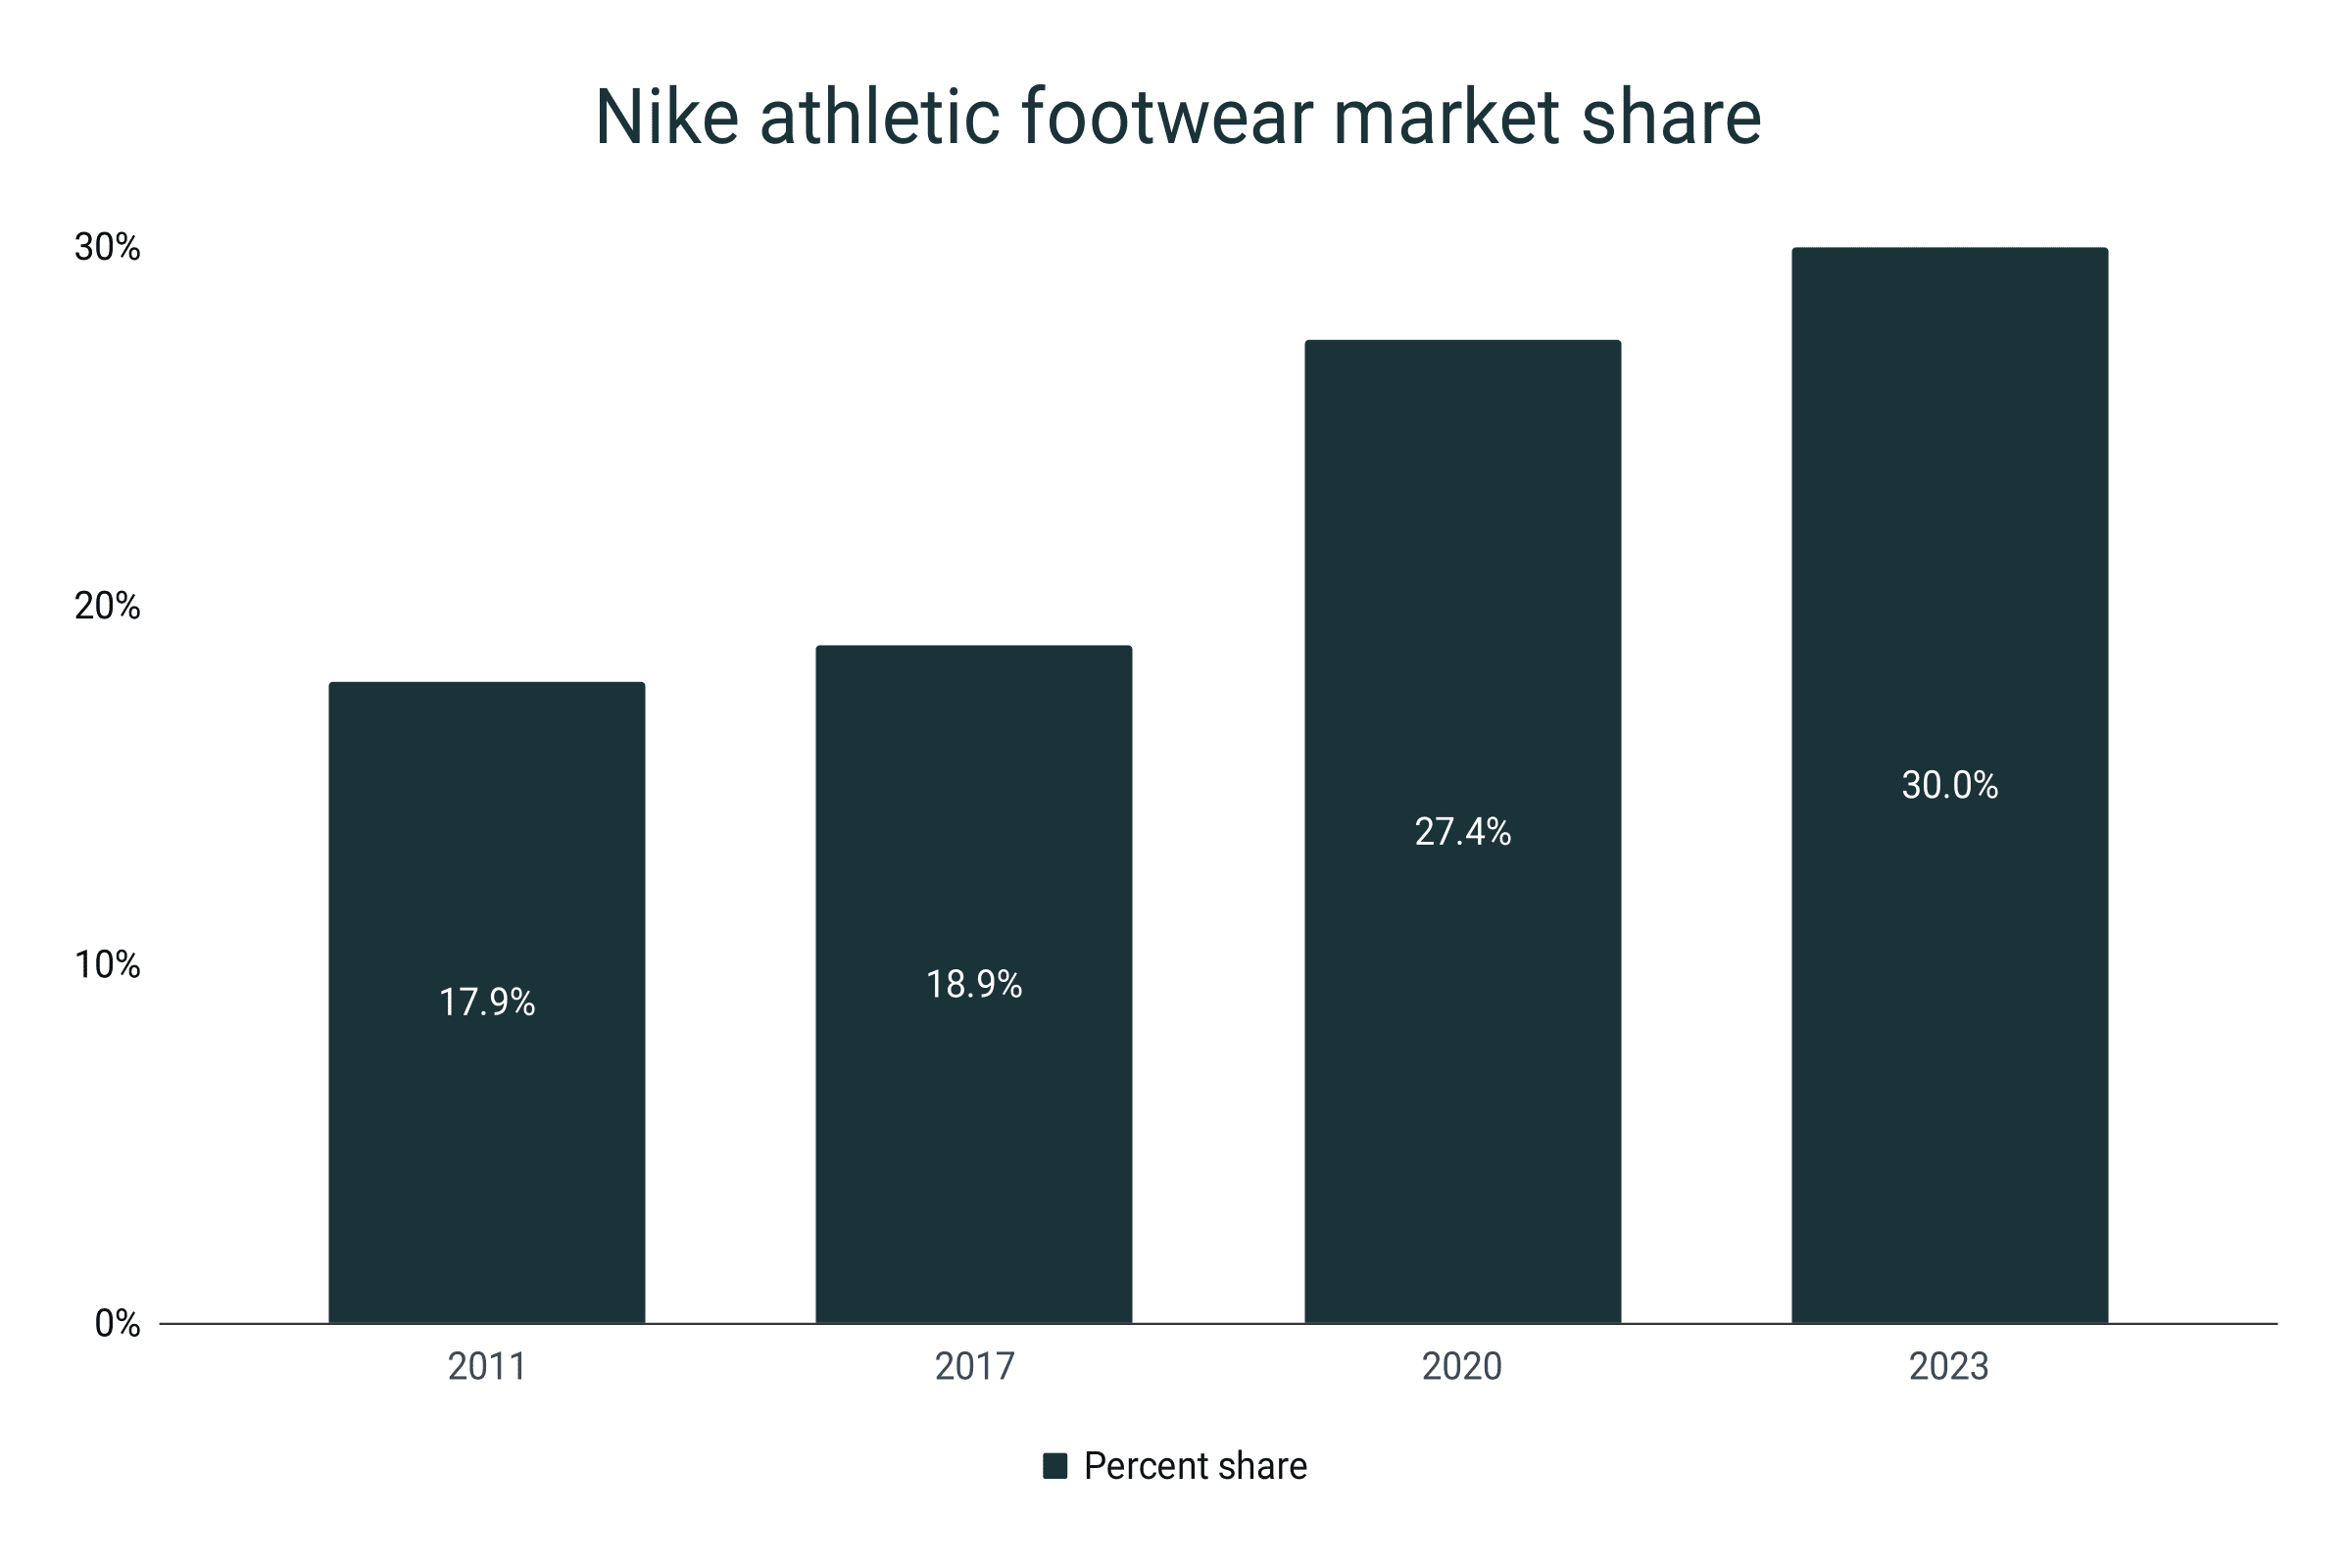
- In terms of athletic footwear, Nike is expected to be 30% of the entire market.
- This is a 2.6% increase from the 27.4% closing in 2020.
- Since 2011, Nike’s stronghold in the athletic footwear market has generated a 67.6% increase.
Nike athletic footwear market share
|
Year |
Market share |
|
2011 |
17.9% |
|
2017 |
18.9% |
|
2020 |
27.4% |
|
2023 |
30% |
- In the sneaker department, Nike is also the dominant player with 38.5% of the entire market.
- Nike holds 96% of the lifestyle basketball market.
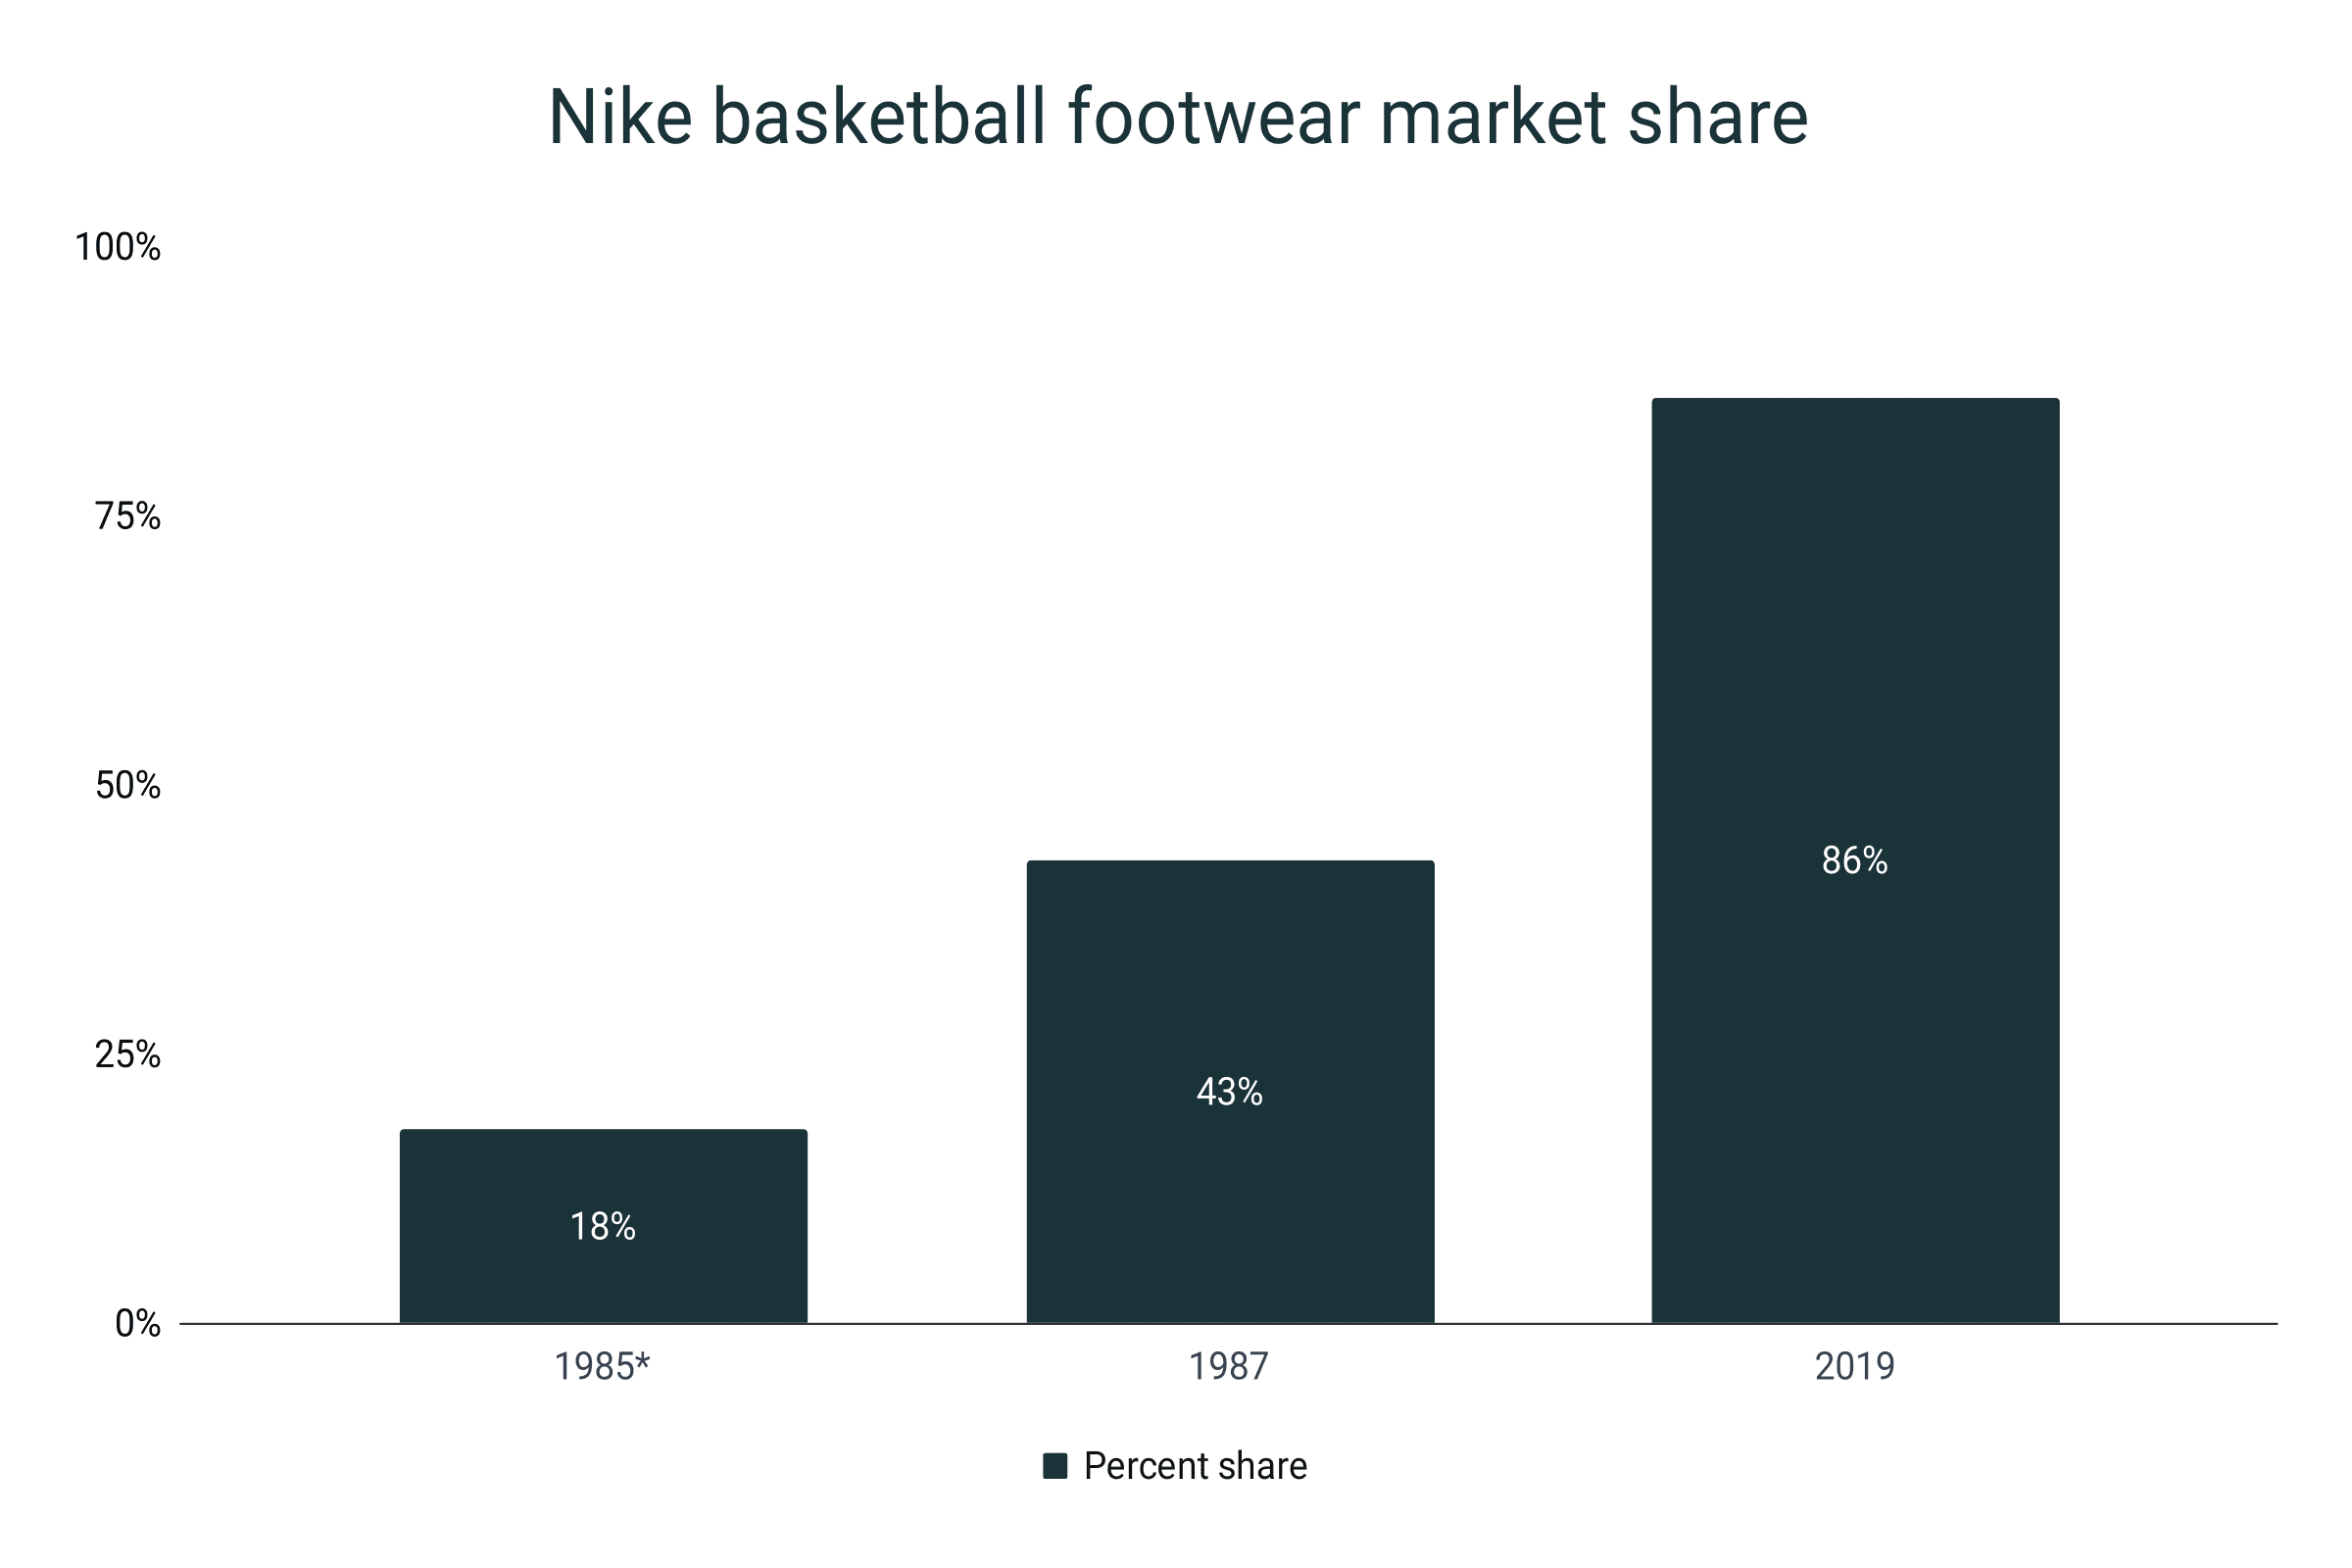
- For performance basketball shoes, Nike also leads the pack with a whopping 86% share as of 2019.
- Back in 1985 before the Nike Air Jordan line was introduced in the market, Nike only holds 18% of the basketball shoe industry.
- After the Air Jordans became popular among athletes, Nike took 43% of the market in 1987 and doubled to 86% in three decades.
- Additionally, 77% of NBA players wore a Nike basketball shoe during the 2020-21 season.
Nike basketball footwear market share
|
Year |
Market share |
|
1985* |
18% |
|
1987 |
43% |
|
2019 |
86% |
*Pre-Nike Air Jordan era
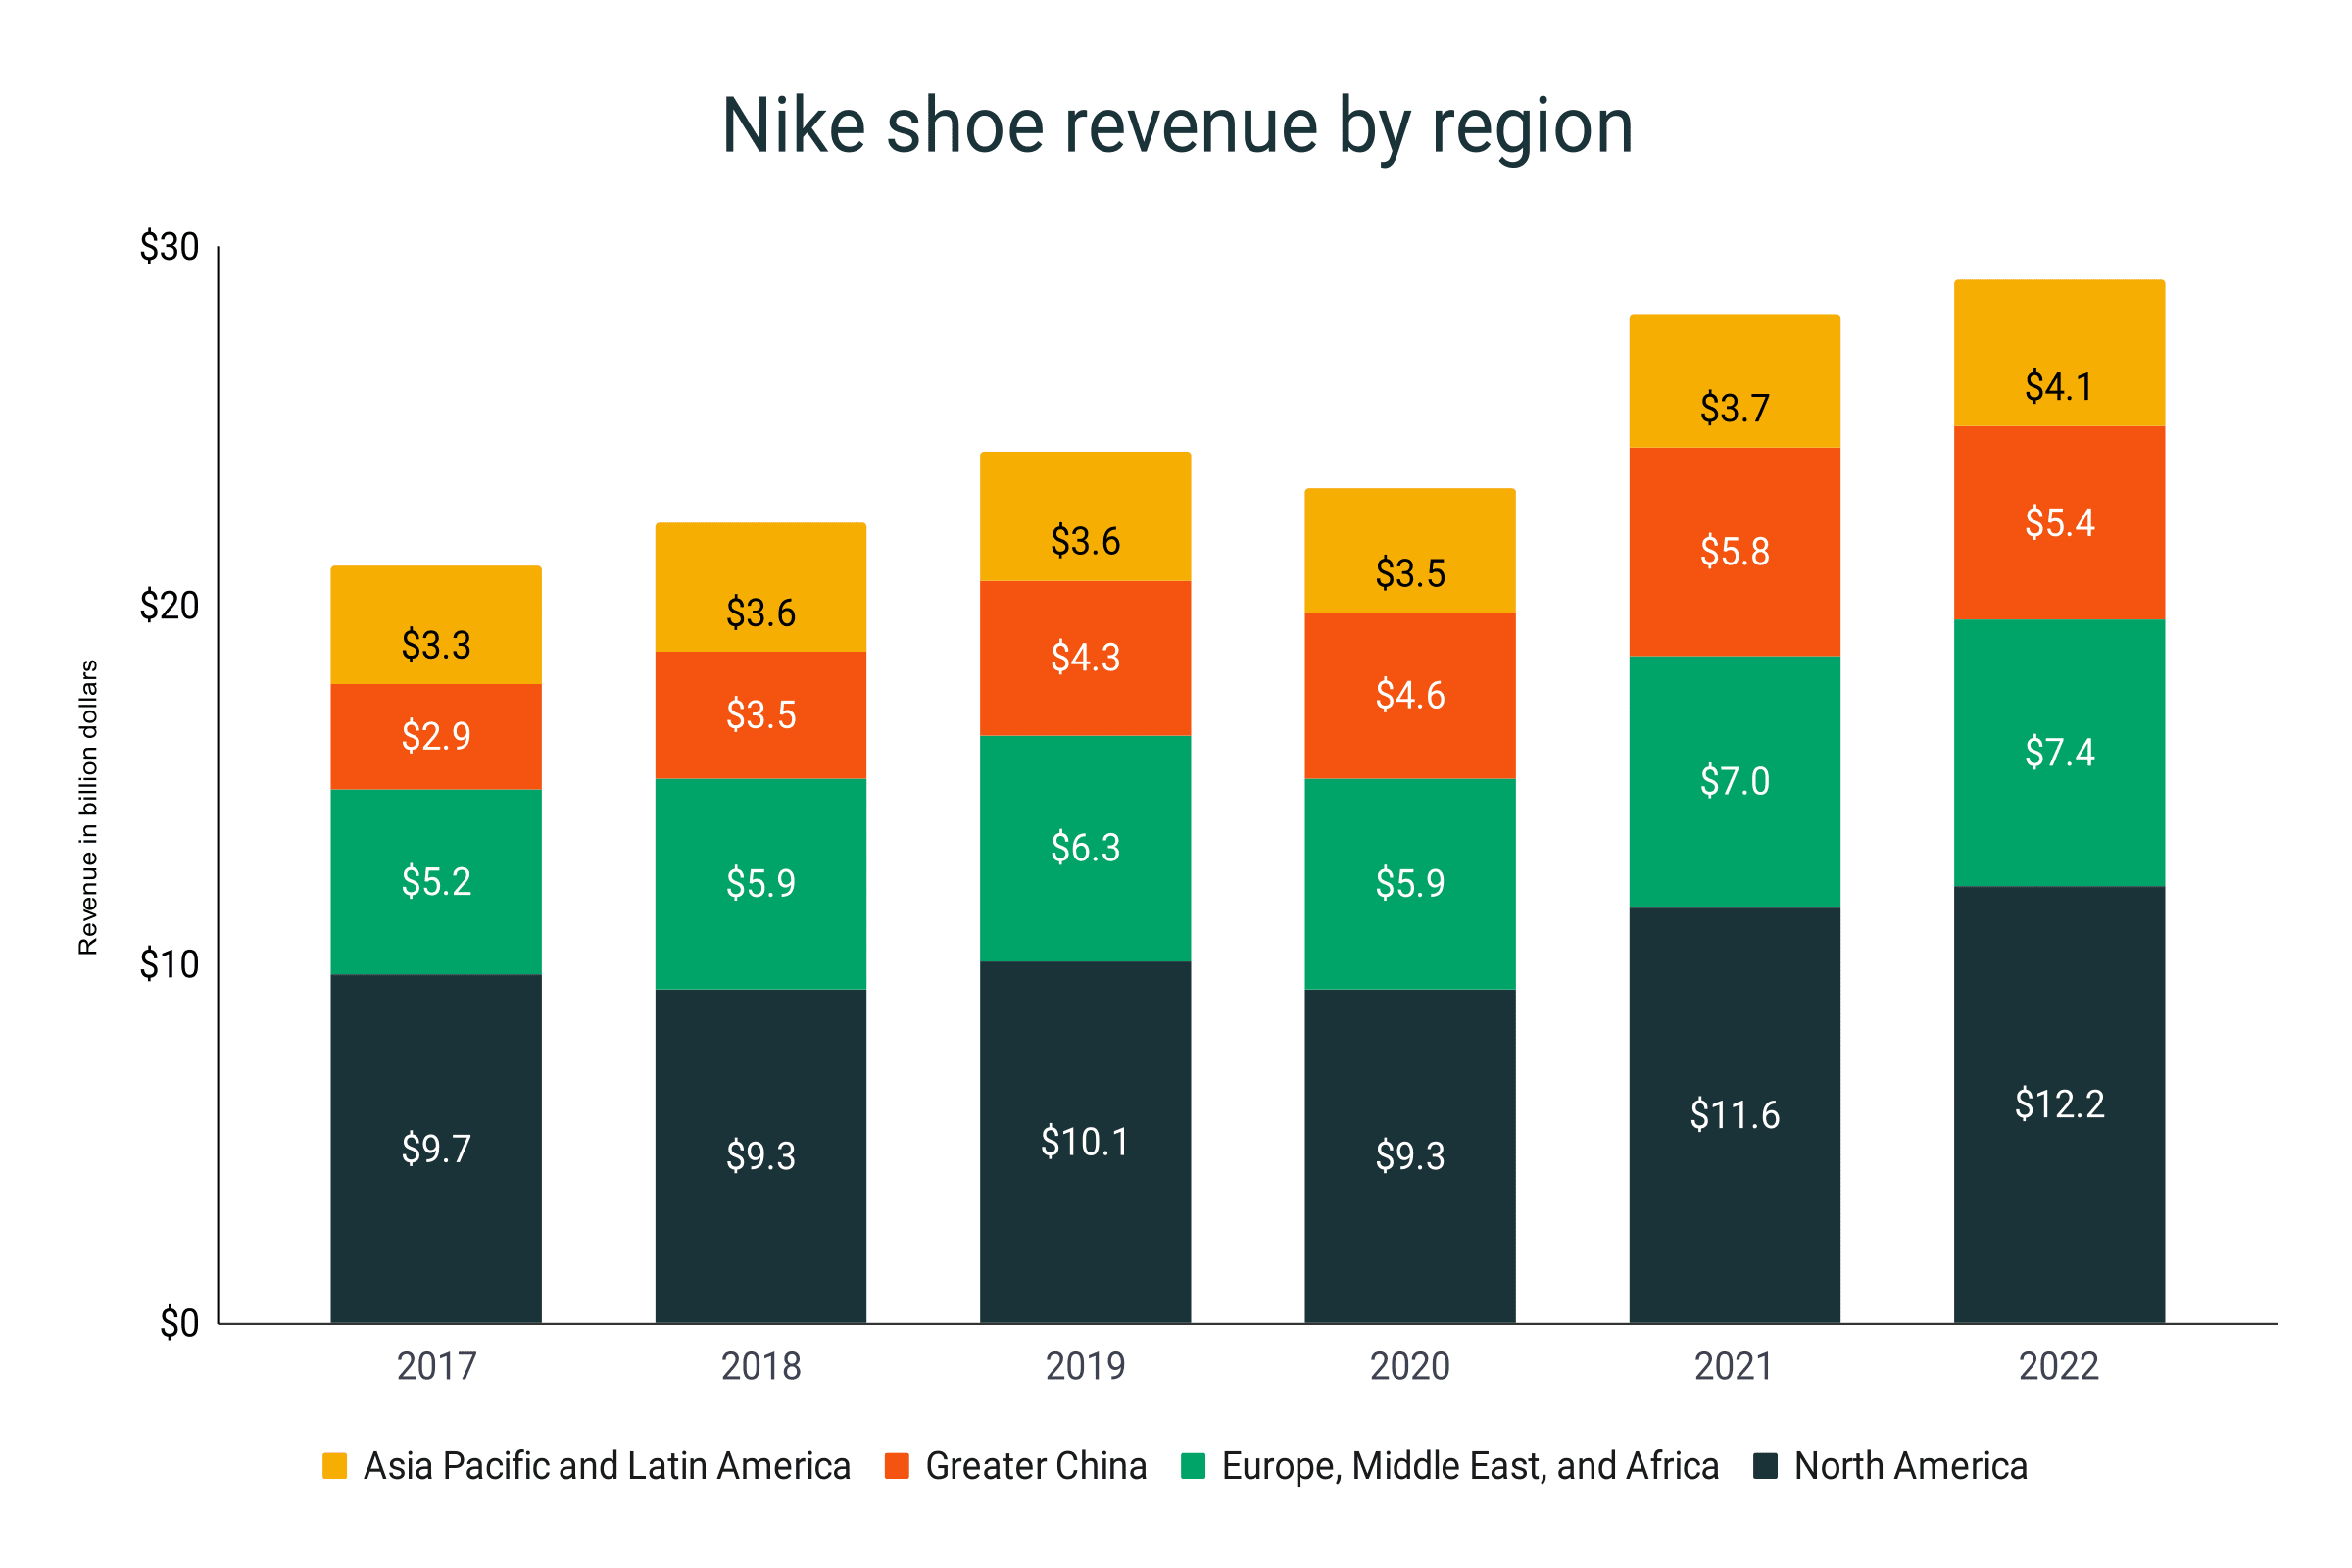
Nike shoe revenue by region
- North America is the biggest Nike market with $12.2 billion in total sales in 2022.
- Compared to its value in 2021, North American revenues have grown by 5.2%.
- From 2017-2022, Nike’s footwear revenue in North America experienced a 25.8% growth.
- During the pandemic in 2020, all regional market segments experienced a drop in revenue. The North American region was hit the hardest with a 7.9% decline in its gross revenue. At the same time, China enjoyed a 7% increase in its sales in 2020.
- The combined revenue from Europe, the Middle East, and Africa is the second-largest Nike market segment in 2022 with $7.4 billion.
- Greater China is the third biggest contributor to Nike revenue, amassing $5.4 billion in the same year.
- However, it is 6.9% lower than its $5.8 billion sales in 2021.
- But, in terms of overall growth from 2017-2022, the Greater China region has ballooned by 86.2% from its $2.9 billion revenue in 2017.
- Greater China overtook Asia Pacific and Latin America as Nike’s third biggest market in terms of total sales in 2019. China collected a total of $4.3 billion while Asia Pacific and Latin America ended 2019 with a steady $3.6 billion.
- Asia Pacific and Latin America is now the fourth biggest market of Nike with a total of $4.1 billion revenue by the end of 2022.
Nike shoe revenue by region (in $ billions)
|
Year |
North America |
Europe, Middle East, and Africa |
Greater China |
Asia Pacific and Latin America |
|
2017 |
$9.7 |
$5.2 |
$2.9 |
$3.3 |
|
2018 |
$9.3 |
$5.9 |
$3.5 |
$3.6 |
|
2019 |
$10.1 |
$6.3 |
$4.3 |
$3.6 |
|
2020 |
$9.30 |
$5.90 |
5 |
$3.5 |
|
2021 |
$11.6 |
$7.0 |
$5.8 |
$3.7 |
|
2022 |
$12.2 |
$7.4 |
$5.4 |
$4.1 |
|
2023 |
$14.9 |
$8.3 |
$5.4 |
$4.5 |
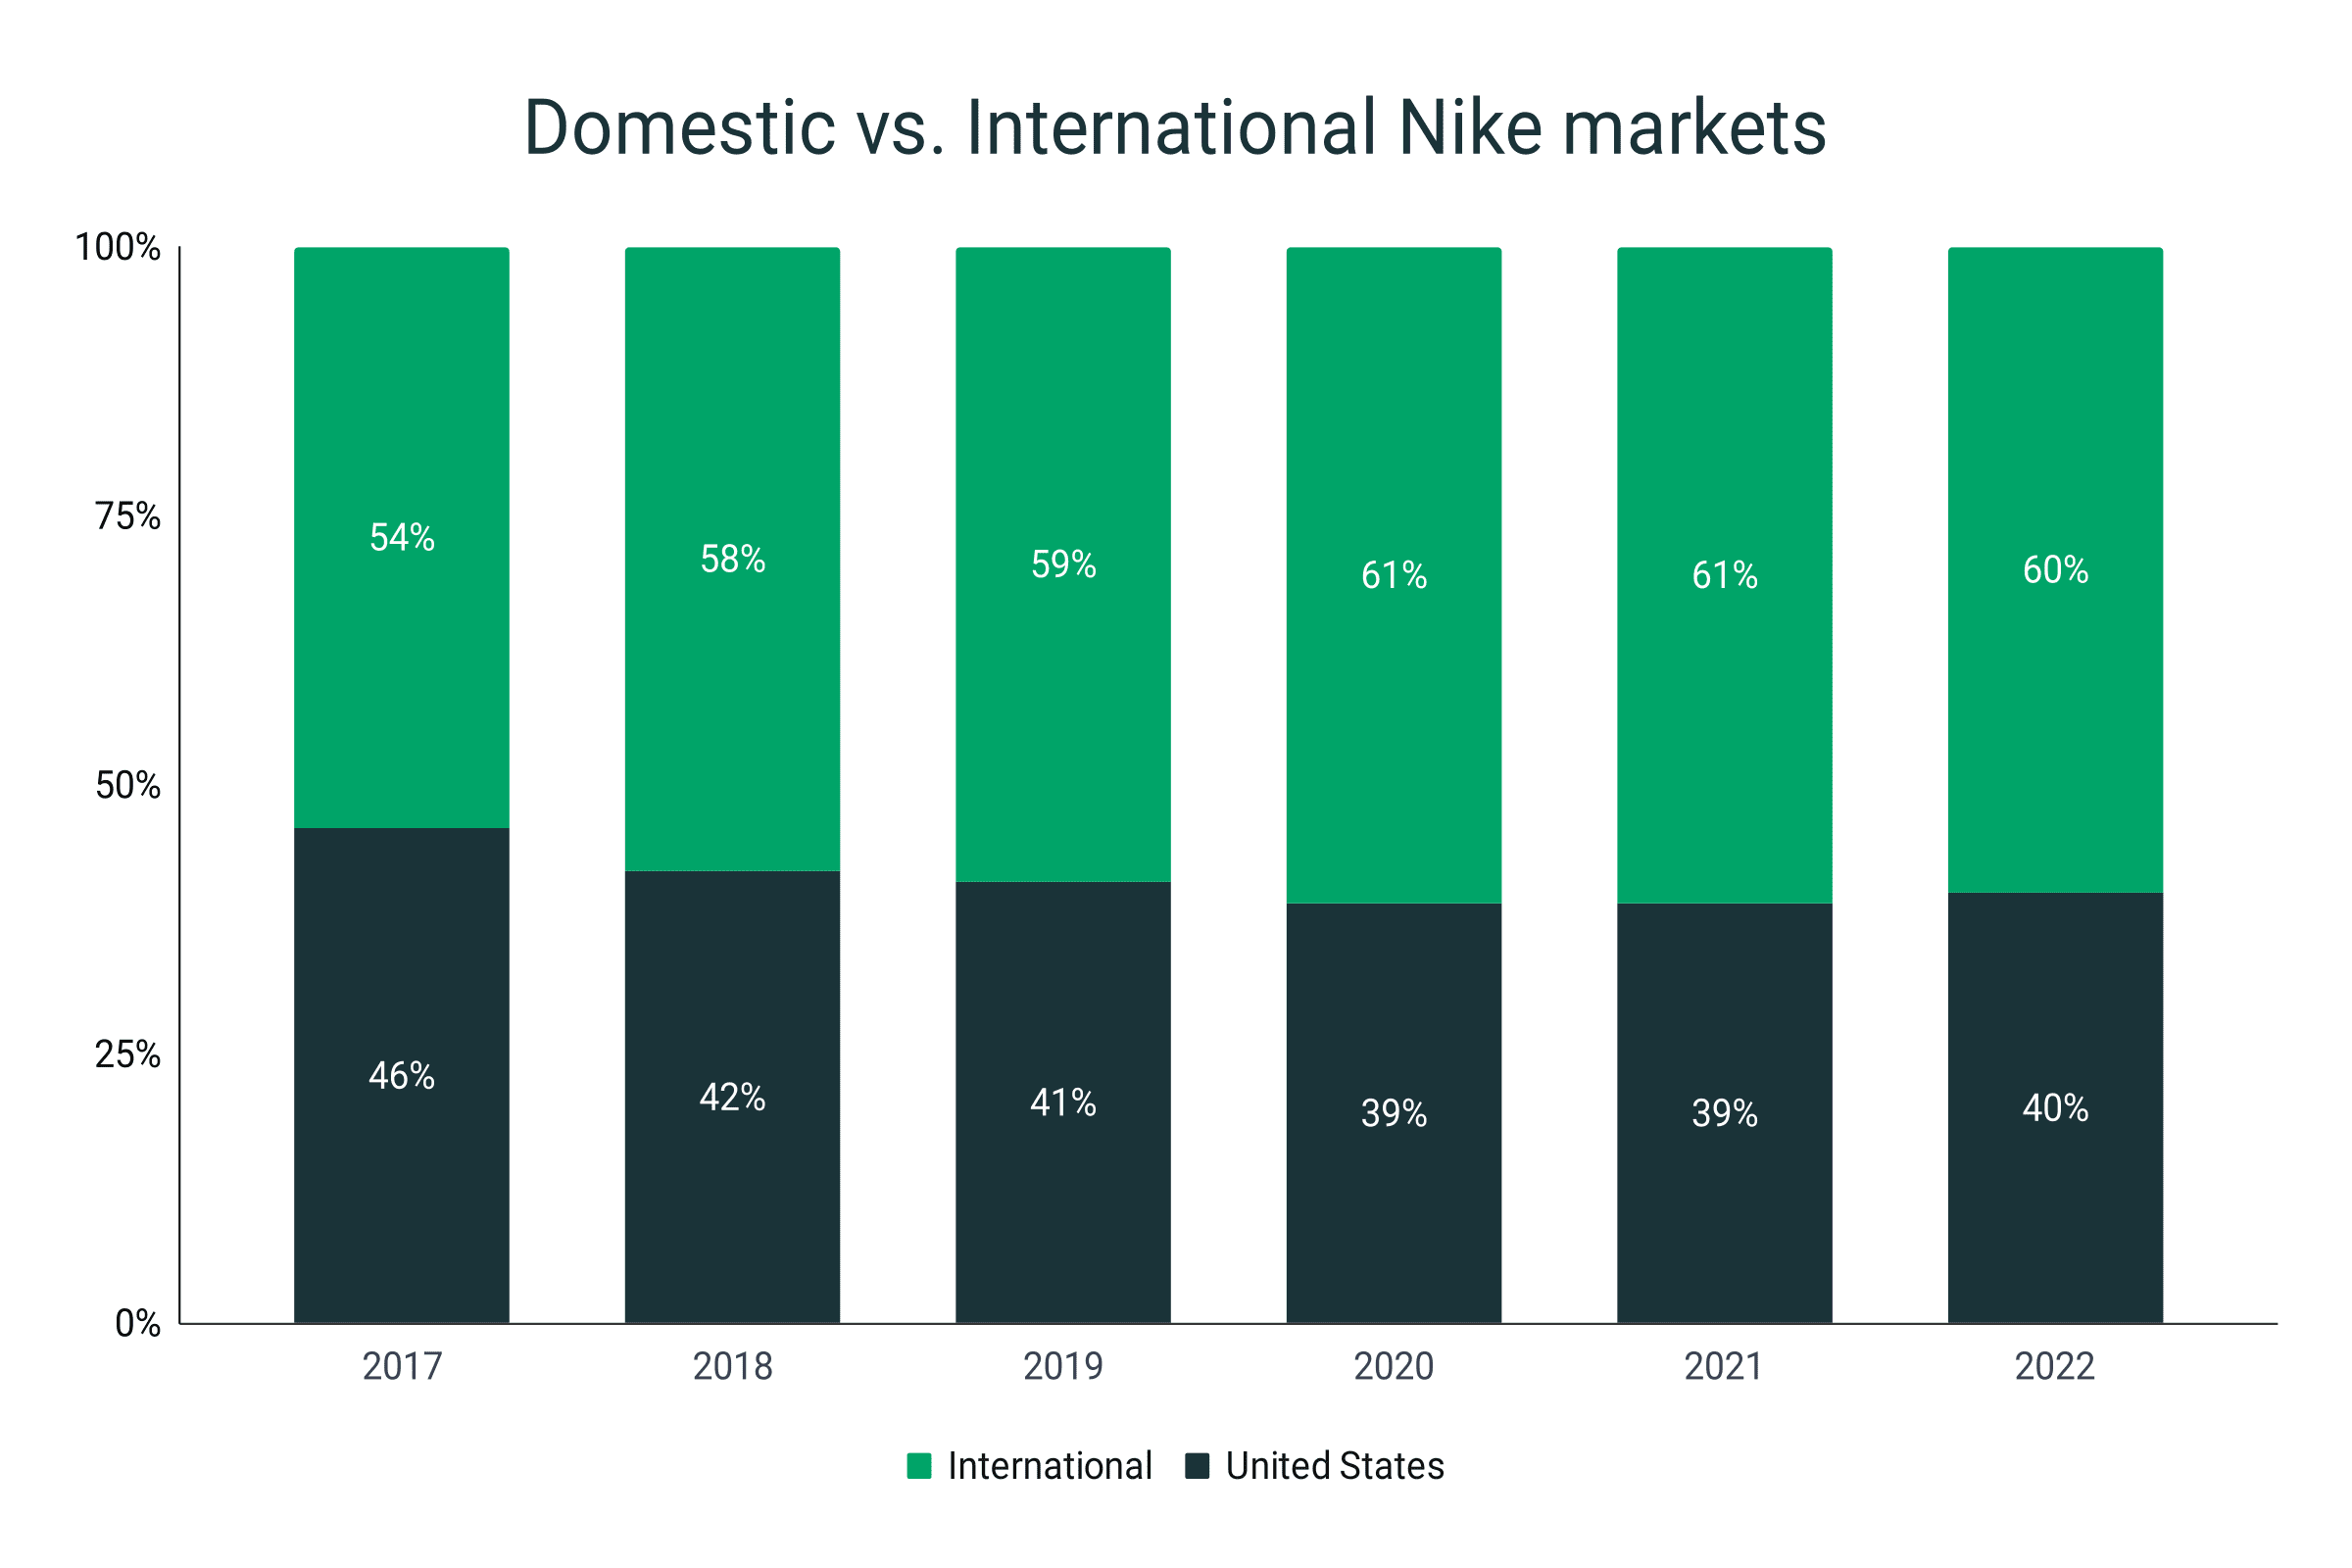
- Meanwhile 60% of the footwear revenue generated by Nike in 2022 comes from the international market.
- In 2020 and 2021, the portion of revenue from the international market is 61%, one percent higher in 2022.
- Back in 2017, the international market share is about 54%. Meaning, Nike’s international share has grown by 6%.
- On the other hand, the 2022 revenue of Nike is 40% from the United States.
- It has grown by 1% from its 39% market portion in the past year.
- Overall, the domestic or US-based market of Nike has shrunk from 46% in 2017 to its current 40% share.
Domestic vs. International Nike market shares
|
Year |
United States |
International |
|
2017 |
46% |
54% |
|
2018 |
42% |
58% |
|
2019 |
41% |
59% |
|
2020 |
39% |
61% |
|
2021 |
39% |
61% |
|
2022 |
40% |
60% |
Nike shoe market share by gender
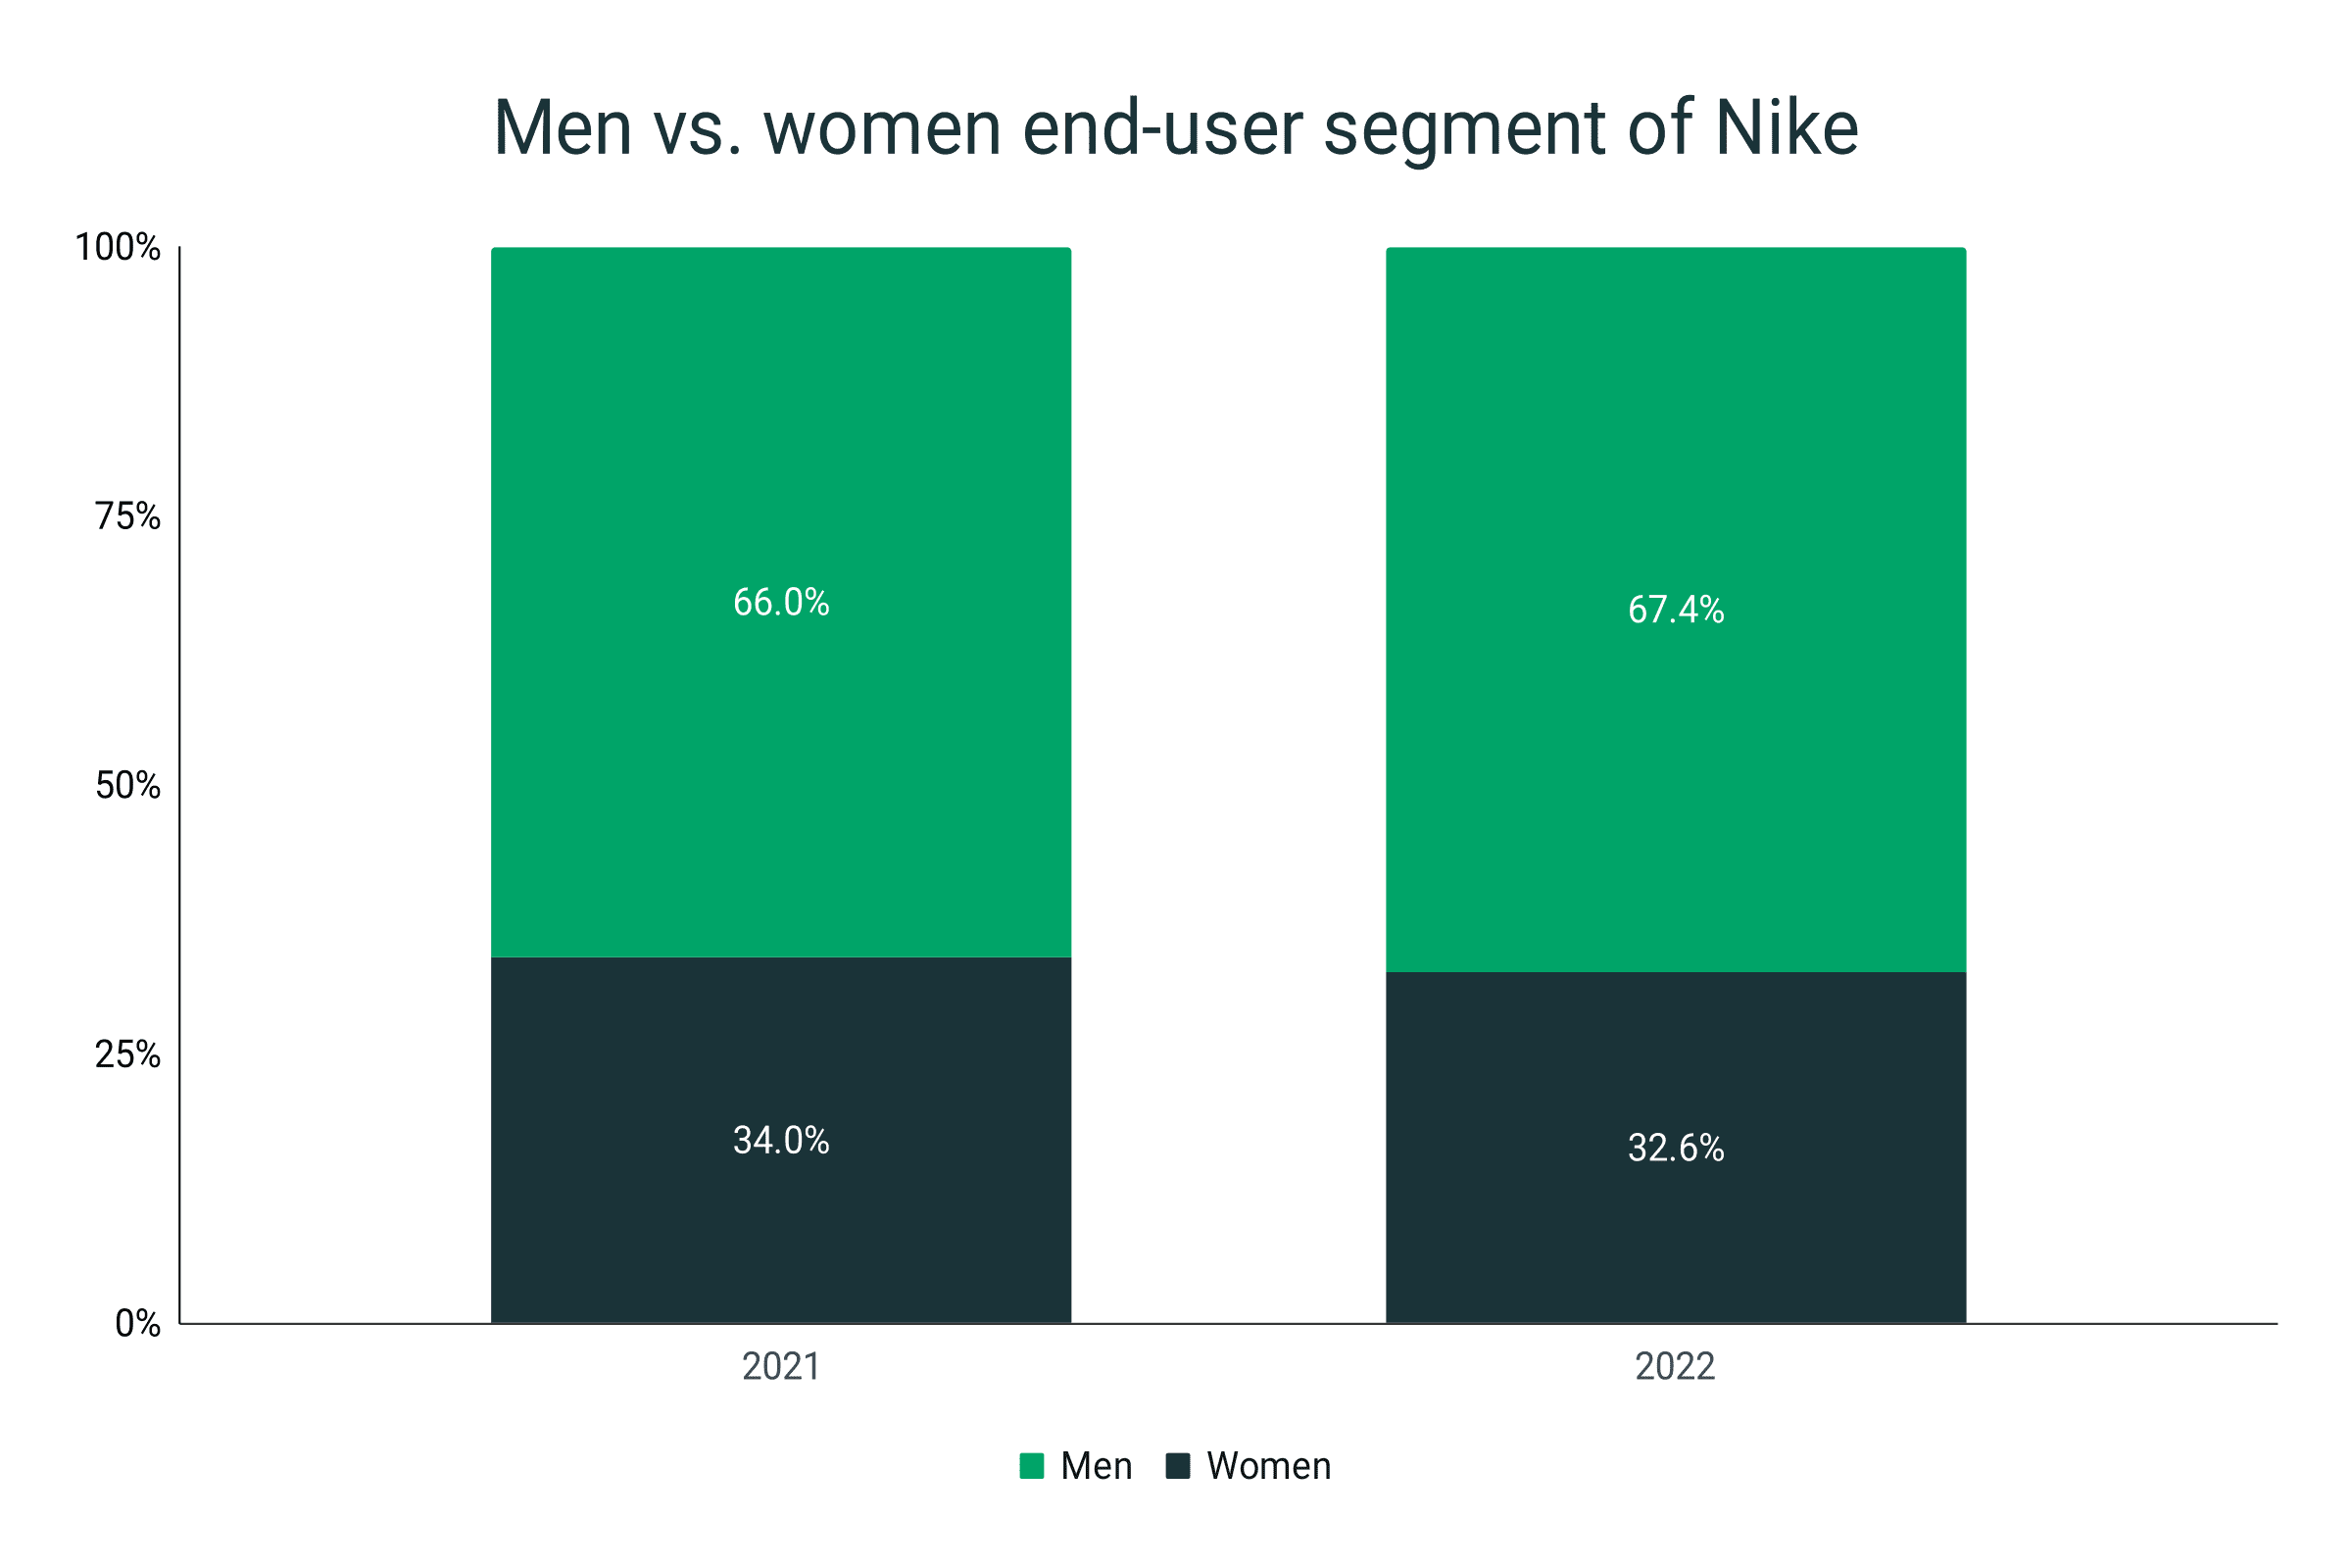
- Nike is still a male-dominated market in 2022 with 67.4% of its shoppers being male.
- In 2021, the number is 66%, signifying a 1.4% increase in the male population portion.
- On the other hand, the women end-user segment of Nike is 32.6% in 2022.
- It experienced a 1.4% drop from its 34% portion in 2021.
Men vs. women end-user segment of Nike
|
Year |
Women |
Men |
|
2021 |
34% |
66% |
|
2022 |
32.6% |
67.4% |
- As of 2023, Nike has a total of 773 footwear products.
- 342 or 44.2% of these are exclusive for men.
- Of the 773 products, 38.1% are women-only merchandise.
- A total of 137 Nike shoes are unisex.
Nike product type distribution
|
Product type |
Number |
Percentage |
|
For men |
342 |
44.2% |
|
For women |
294 |
38.1% |
|
Unisex |
137 |
17.7% |
Nike shoe production facts and figures
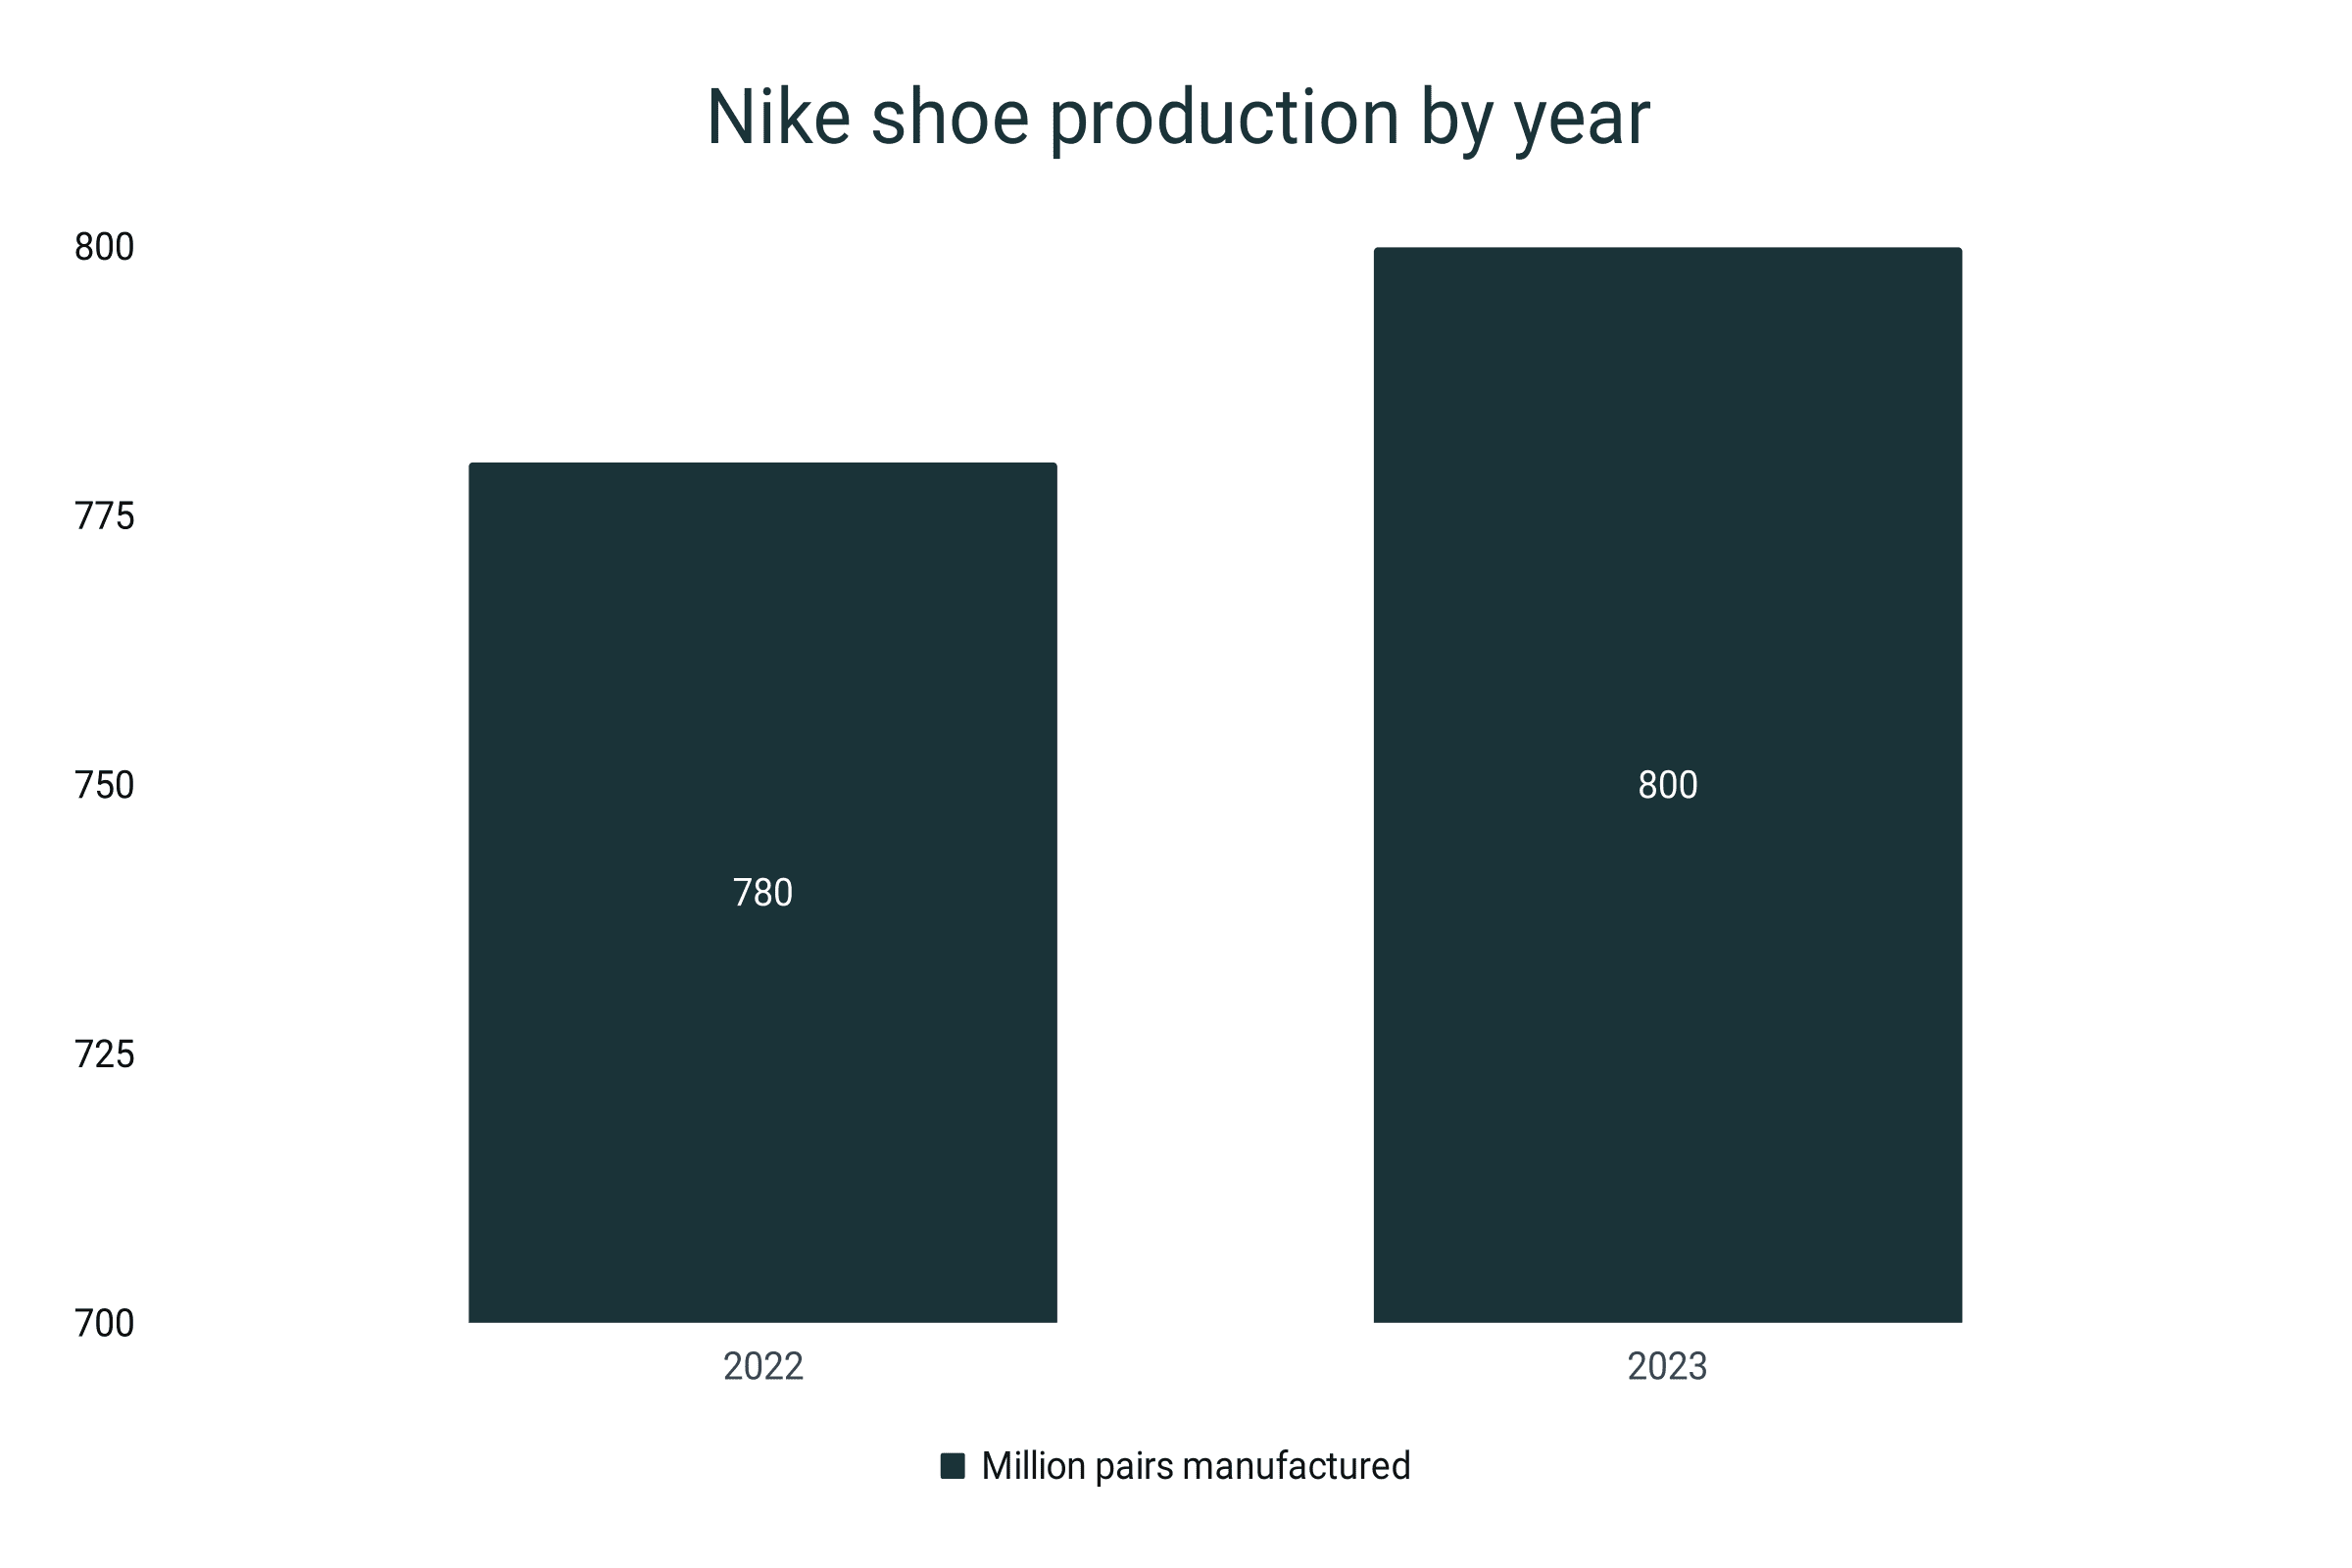
- In 2023, Nike will produce over 800 million pairs of shoes.
- This is a 2.6% increase compared to the 780 million total in 2022.
- An expert estimated that Nike sells 26 pairs of shoes every second.
- The average weight of a pair of Nike shoes is about 880g. That is 440g a shoe.
- A Nike shoe can 1-3 years in general.
- In mileage, that is about 200-300 miles of pounded pavement.
Nike shoe production by year
|
Year |
Million pairs manufactured |
Growth |
|
2022 |
780 |
|
|
2023 |
800 |
2.6% |
- In 2023, Vietnam stays atop as the main source of Nike footwear products with a 50% portion.
- It is followed by Indonesia and China with 27% and 18% shares, respectively.
- Notably, before the pandemic, in 2019, China is the second biggest Nike manufacturing country with 23%, edging out Indonesia with 21%.
- However, in 2020, Indonesia overtook China as the second main source of Nike shoes with 24% versus the former’s 22%.
- Nike progressively lessen made-in-China Nike shoes. From 2018 to 2023, Nike footwear manufactured in China decreased by 30.8%.
- Consequently, Indonesian-made Nike has ballooned by 42.9%.
Nike shoe manufacturers
|
Year |
Vietnam |
Indonesia |
China |
Others |
|
2018 |
47% |
21% |
26% |
6% |
|
2019 |
49% |
21% |
23% |
7% |
|
2020 |
50% |
24% |
22% |
4% |
|
2021 |
51% |
24% |
21% |
4% |
|
2022 |
44% |
30% |
20% |
6% |
|
2023 |
50% |
27% |
18% |
5% |
Nike shoe sustainability
- The 30-year-old Nike Grind programme reused a total of 30 million pounds of repurposed and recycled materials as of 2022.
- Data in 2020 reveals that 29% of materials Nike used on their footwear were sustainable.
- This is 1% lower compared to the 30% share in 2019.
- In 2017 and 2018, Nike reported that it used 32% sustainable materials in its shoe manufacturing process, the highest percentage in six years.
- From 2015-2020, the average portion of sustainable materials in Nike footwear production is at 30.8%.
- Nike transformed end-of-life footwear to 252 tonnes of textile fluff, 131 tonnes of rubber, and 135 tonnes of foam in 2020.
- Additionally, approximately 70 tonnes of unsellable and post-customer shoes were recycled.
Percent share of sustainable materials in Nike footwear
|
Year |
Share of recycled materials |
|
2015 |
31% |
|
2016 |
31% |
|
2017 |
32% |
|
2018 |
32% |
|
2019 |
30% |
|
2020 |
29% |
The popularity of Nike
- As of 2022, 92% of American consumers have heard of the Nike brand.
- 56% or more than half of the American population are using Nike shoes.
- Meanwhile, only 49% are loyal to the brand.
- As of August 2023, 140.4 million people have visited Nike online website.
- The visitors spent an average of 3 minutes and 44 seconds.
- On average, a visitor to the Nike website reads 5.2 pages.
- Among teenage or Gen Zs, 61% prefer Nike.
- Converse, which is also under Nike, is their second choice with 10% of the vote.
- Nike is 85th of the Fortune 500 companies in America. Forbes also lists Nike as the 13th most valuable brand.
Nike brand awareness, popularity, usage, loyalty, and buzz
|
Parameter |
Percentage |
|
Awareness |
92% |
|
Popularity |
64% |
|
Usage |
56% |
|
Loyalty |
49% |
|
Buzz |
44% |
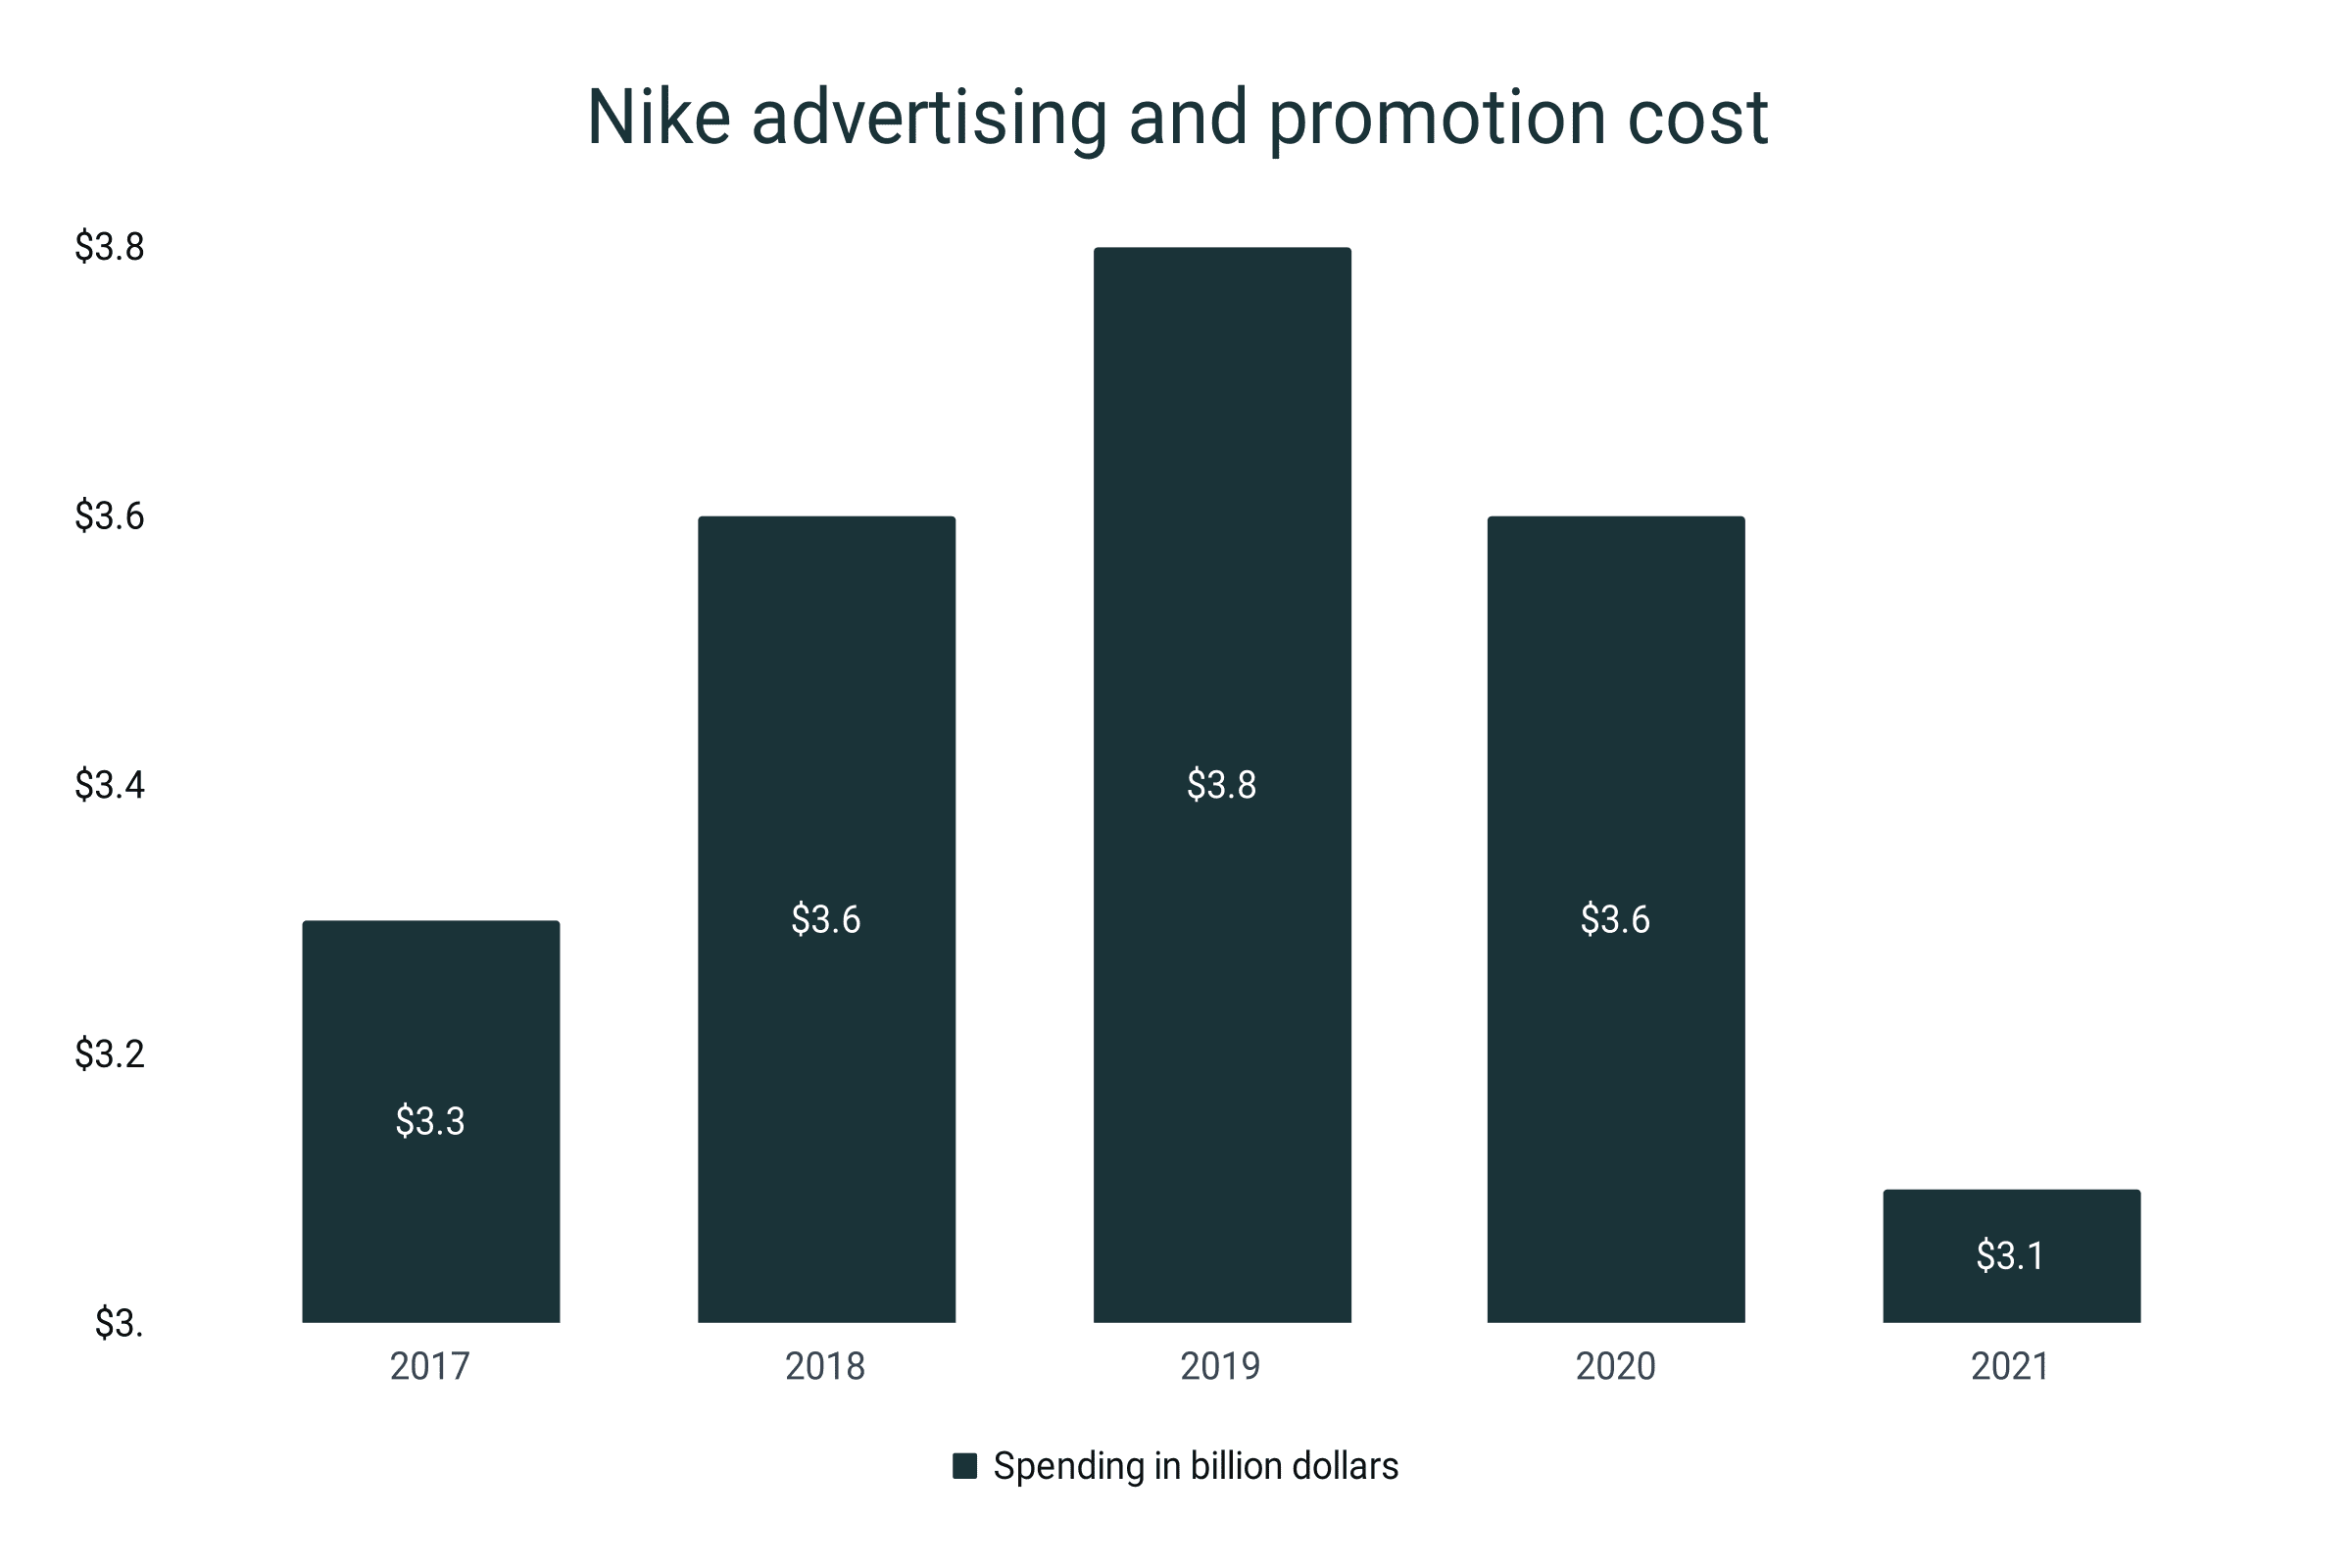
- In 2021, Nike spent $3.1 billion in advertising.
- This is 13.9% lower than the $3.6 billion spent in 2020.
- Nike spent a $3.8 billion promotional cost in 2019, the highest in five years.
- The budget was cut by 5.3% in 2020.
- From 2017-2021, Nike’s advertising and promotional costs decreased by 6.1%.
Nike advertising and promotion cost
|
Year |
Spending in billion dollars |
Growth |
|
2017 |
$3.3 |
|
|
2018 |
$3.6 |
9.1% |
|
2019 |
$3.8 |
5.6% |
|
2020 |
$3.6 |
-5.3% |
|
2021 |
$3.1 |
-13.9% |
Sources
https://www.statista.com/statistics/412760/nike-global-revenue-share-by-product/
https://www.statista.com/outlook/cmo/footwear/worldwide
https://www.statista.com/statistics/241683/nikes-sales-worldwide-since-2004/
https://www.statista.com/statistics/227152/nikes-footwear-sectors-net-revenue-by-global-market/
https://www.statista.com/statistics/241706/nikes-us-sales-by-product-category-since-2007/
https://www.statista.com/statistics/888658/revenue-share-of-nike-worldwide-by-region/
https://www.statista.com/statistics/861718/share-of-sustainable-materials-in-nike-s-footwear-and-apparel-segments/
https://www.statista.com/chart/28470/brand-profiler-sportswear/
https://www.start.io/blog/nike-target-market-analysis/
https://www.blog.datahut.co/post/competitive-analysis-nike-vs-adidas
https://www.similarweb.com/website/nike.com/#overview
https://www.investing.com/academy/statistics/nike-facts/#top-nike-statistics-from-2022-2023
https://thebrandgym.com/how-air-jordan-helped-nike-fly-high/#:~:text=However%2C%20the%20Air%20Jordan%20brand,the%20%E2%80%9Clifestyle%E2%80%9D%20basketball%20category
https://blog.gitnux.com/athletic-footwear-industry-statistics/
https://www.statista.com/statistics/888793/nikes-revenue-by-product-category-worldwide/
https://shoeeffect.com/how-many-shoes-does-nike-sell-a-year/
https://www.investing.com/academy/statistics/nike-facts/
https://www.circularonline.co.uk/features/circular-trainers-how-consumption-became-culture/#:~:text=Nike%20sells%20over%20780%20million,doing%20to%20be%20more%20sustainable%3F
https://app.impaakt.com/analyses/nike-shoes-end-of-life-waste-is-equivalent-to-annual-waste-produced-by-25mn-people-46187
https://www.scmp.com/lifestyle/fashion-beauty/article/3169641/worlds-most-popular-trainers-how-nike-air-force-1s-went#:~:text=Over%202%2C000%20versions%20of%20the,popular%2C%20came%20out%20in%201982.
