Which Runners are the Most Obssessed?
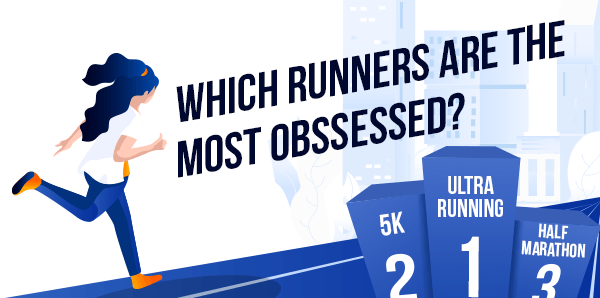
This stats page is a simple look at the participation patterns of runners in the 5 most common distances - 5K, 10K, Half marathon, Marathon and Ultra.
In the next tables, we show what % of the runners run 1, 2, 3, etc. or more races in a particular distance, per year, to see which distance has the most insatiable participants that keep coming back for more.
We've decided to call this metric Obsession.
Key Findings
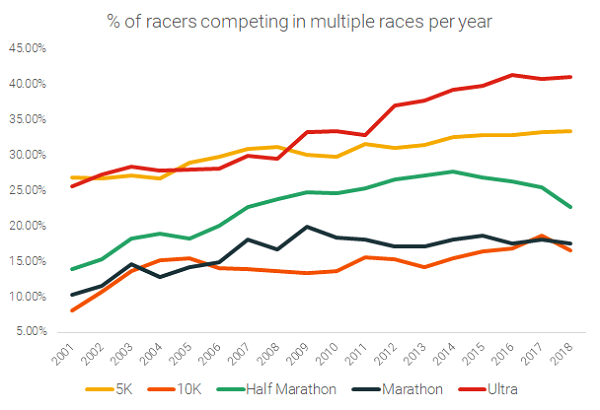
- Ultrarunning has the most obsessed runners. 41.02% of ultra runners participated in more than one race in 2018 compared to 33.31% (5K), 16.53% (10K), 22.62% (Half Marathon), and 17.60% (Marathon).
- 10K is the least sticky distance with only 16.53% of runners participating in more than one 10K per year.
- 24.89% of ultra racers participated in 2 races in 2018, and 9.53% in 3 races. This is higher than any other distance for % of those that ran 2 or 3 races in a single year.
- Over the years 10K and Marathon distances races have consistently seen the lowest % of repeat participation.
Data and methodology
- The data used for this piece had been compiled for the State of Running 2019 and State of Ultra Running 2020 studies.
- 2018 is the last full year's worth of data that was compiled.
5K participation distribution
| 5K - # of races per year | 2001 | 2006 | 2010 | 2014 | 2018 |
| 1 | 73.14% | 70.21% | 70.29% | 67.50% | 66.69% |
| 2 | 10.56% | 11.86% | 12.91% | 13.19% | 13.16% |
| 3 | 3.60% | 4.38% | 4.11% | 4.53% | 4.49% |
| 4 | 3.50% | 4.50% | 2.77% | 3.98% | 4.38% |
| 5 | 2.68% | 2.66% | 2.92% | 3.04% | 3.14% |
| 6 | 1.29% | 1.34% | 1.52% | 1.61% | 1.69% |
| 7 | 1.13% | 1.19% | 1.29% | 1.36% | 1.42% |
| 8 | 1.08% | 1.09% | 1.19% | 1.24% | 1.31% |
| 9 | 0.64% | 0.95% | 1.14% | 1.16% | 1.21% |
| 10 | 0.61% | 0.85% | 1.11% | 1.12% | 1.17% |
| >10 | 0.77% | 0.97% | 0.76% | 1.28% | 1.34% |
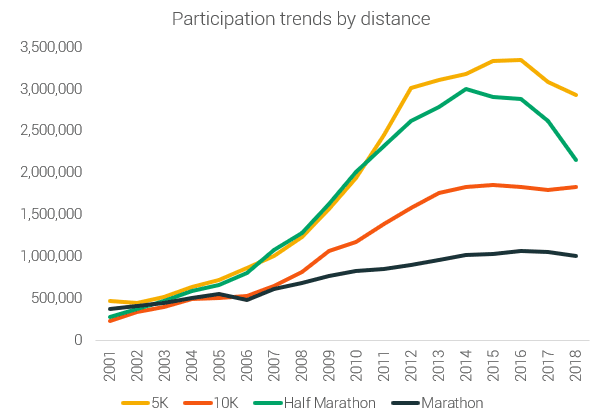
With over 3 million participations a year, the 5K distance is the most popular within running. 5K runs are accessible and less time consuming than longer distances, which is part of the popularity and draw.
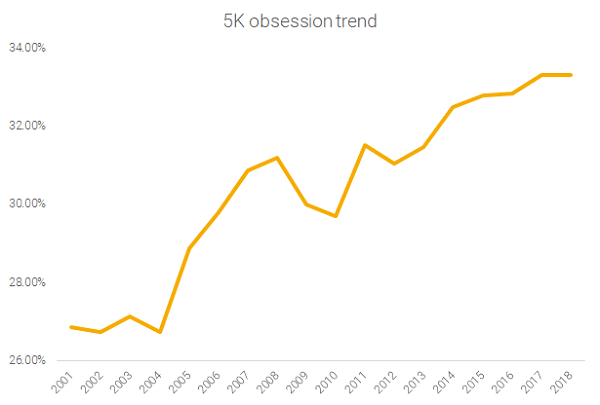
Only second in Obsession to ultra runners, 5K sees the next highest level of repeat participation. At the extreme end of repeat participation, the 5K distance actually sees the highest %, at 1.34% of runners participating in over 10 races.
Back in 1998, the 5K distance actually had more repeat runners than all other categories. 23.22% of all 5K runners competed in more than one race, compared to 10.13% (10K), 13.60% (Half Marathon), 8.18% (Marathon), and 16.88% (Ultras).
As you can see by participation trends, 5K still has the most runners, but like most traditional distance races, it's been in decline for the past few years now (Source: State of Running 2019).
10K participation distribution
| 10K - # of races per year | 2001 | 2006 | 2010 | 2014 | 2018 |
| 1 | 91.91% | 85.98% | 86.39% | 84.51% | 83.47% |
| 2 | 5.89% | 8.87% | 10.33% | 10.63% | 11.21% |
| 3 | 1.27% | 2.47% | 1.96% | 2.84% | 2.67% |
| 4 | 0.28% | 1.30% | 0.44% | 0.79% | 0.95% |
| 5 | 0.12% | 0.60% | 0.10% | 0.32% | 0.40% |
| 6 | 0.11% | 0.21% | 0.12% | 0.19% | 0.21% |
| 7 | 0.11% | 0.15% | 0.15% | 0.19% | 0.25% |
| 8 | 0.12% | 0.21% | 0.14% | 0.16% | 0.30% |
| 9 | 0.06% | 0.07% | 0.13% | 0.14% | 0.26% |
| 10 | 0.05% | 0.07% | 0.13% | 0.14% | 0.15% |
| >10 | 0.07% | 0.08% | 0.09% | 0.09% | 0.12% |
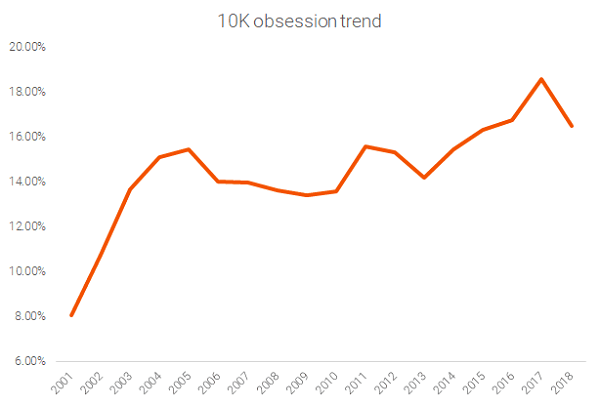
Runners at the 10K distance are the least likely to run multiple races per year. Although over the last 20 years, 10Ks have seen their obsession metric rise from a low of 8.09% to the high in 2017 of 18.62%.
Half marathon participation distribution
| Half Marathon - # of races per year | 2001 | 2006 | 2010 | 2014 | 2018 |
| 1 | 86.13% | 79.90% | 75.38% | 72.34% | 77.38% |
| 2 | 10.06% | 14.45% | 16.78% | 17.11% | 14.88% |
| 3 | 2.32% | 3.62% | 4.86% | 5.74% | 4.48% |
| 4 | 0.90% | 1.13% | 1.62% | 2.39% | 1.82% |
| 5 | 0.38% | 0.50% | 0.70% | 1.08% | 0.76% |
| 6 | 0.08% | 0.17% | 0.31% | 0.55% | 0.28% |
| 7 | 0.04% | 0.10% | 0.15% | 0.28% | 0.16% |
| 8 | 0.03% | 0.06% | 0.07% | 0.17% | 0.08% |
| 9 | 0.02% | 0.01% | 0.06% | 0.10% | 0.05% |
| 10 | 0.01% | 0.02% | 0.03% | 0.07% | 0.03% |
| >10 | 0.05% | 0.03% | 0.05% | 0.17% | 0.08% |
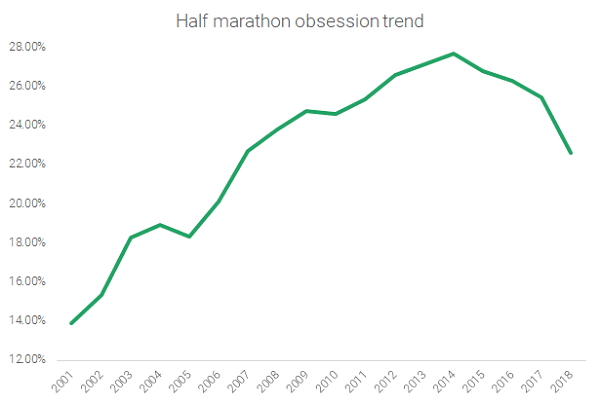
Half marathon runners fall squarely in the middle of this analysis. At their best, in 2014, 27.66% of half marathon runners participated in more than one race a year.
However, the popularity of repeating a half marathon within the same calendar year has declined significantly, in 2018 only 22.62% of half marathon runners repeated. This decline coincides with the distance's sharp decline in overall participation over that past few years.
Marathon participation distribution
| Marathon - # of races per year | 2001 | 2006 | 2010 | 2014 | 2018 |
| 1 | 89.71% | 85.16% | 81.64% | 81.91% | 82.40% |
| 2 | 7.87% | 10.63% | 12.35% | 12.07% | 11.83% |
| 3 | 1.38% | 2.13% | 3.09% | 3.08% | 3.07% |
| 4 | 0.43% | 0.68% | 1.12% | 1.16% | 1.14% |
| 5 | 0.19% | 0.31% | 0.52% | 0.58% | 0.53% |
| 6 | 0.09% | 0.19% | 0.31% | 0.31% | 0.30% |
| 7 | 0.07% | 0.09% | 0.21% | 0.21% | 0.16% |
| 8 | 0.06% | 0.06% | 0.10% | 0.12% | 0.15% |
| 9 | 0.04% | 0.06% | 0.09% | 0.09% | 0.07% |
| 10 | 0.02% | 0.02% | 0.06% | 0.08% | 0.07% |
| >10 | 0.15% | 0.66% | 0.50% | 0.38% | 0.29% |
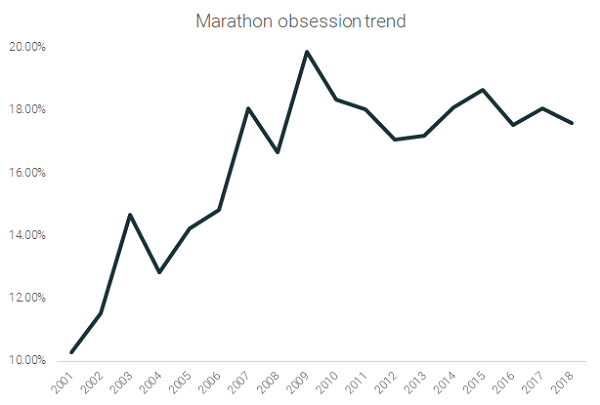
Many have viewed marathon running as the penultimate challenge and to this day the sport continues to have its fanatics. Although participation in marathons has flattened out, it has not seen the dramatic decline in participation that other traditional distances have experienced in recent years.
Since 2007, the % of runners participating in more than one marathon a year has held pretty steady, ranging only from 16.67% to 19.87%.
Ultras participation distribution
| Ultra - # of races per year | 2001 | 2006 | 2010 | 2014 | 2018 |
| 1 | 74.37% | 71.89% | 66.62% | 60.84% | 58.98% |
| 2 | 17.63% | 17.77% | 17.04% | 23.17% | 24.89% |
| 3 | 4.39% | 5.25% | 10.49% | 8.91% | 9.53% |
| 4 | 1.56% | 2.23% | 2.89% | 3.79% | 3.47% |
| 5 | 0.77% | 1.13% | 1.25% | 1.41% | 1.47% |
| 6 | 0.46% | 0.57% | 0.67% | 0.77% | 0.69% |
| 7 | 0.27% | 0.45% | 0.36% | 0.40% | 0.35% |
| 8 | 0.18% | 0.22% | 0.22% | 0.25% | 0.21% |
| 9 | 0.14% | 0.14% | 0.14% | 0.14% | 0.12% |
| 10 | 0.05% | 0.09% | 0.09% | 0.09% | 0.08% |
| >10 | 0.16% | 0.27% | 0.23% | 0.22% | 0.21% |
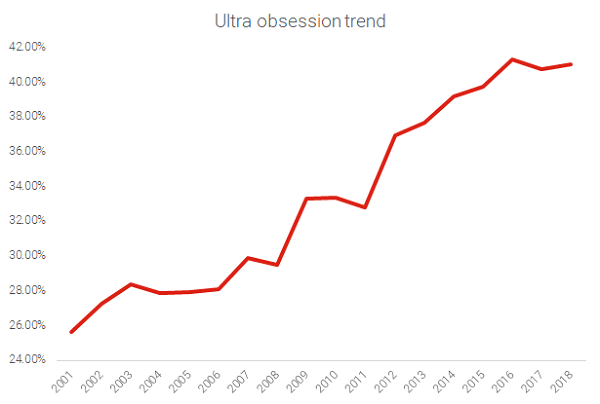
Since 2009 Ultra runners have consistently competed in more than one race per year, at a higher % than any other distance, over 40% since 2016.
Ultra runners are significantly more obsessed with their sport. Considering the time and effort ultra racing requires this is quite a feat.
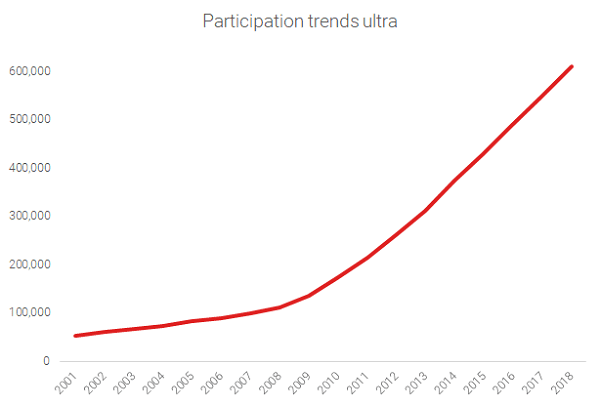
What's interesting about ultrarunning is that even as traditional distance races are declining in participation, ultra race participation is growing steadily and has been for the past 20+ years (Source: State of Ultra Running 2020).
Use of content
Feel free to use material from this page in any web coverage of the topic, we just ask that you cite this as the original source. For other usage questions please reach out to Paul Ronto at paul@runrepeat.com.
