Tennis Shoes Statistics
As the 4th most popular sport in the world with over a billion fans, interest in tennis never seems to wane. The tennis shoe market reflects this excitement perfectly, with healthy growth from all segments.
Top tennis shoes statistics
- The global tennis shoes market size was valued at $2.5 billion in 2021.
- The market is projected to reach $3.6 billion by 2031, growing at a CAGR of 3.3% from 2022 to 2031.
- Hard-court tennis shoes contributed $ 1.26B in 2021, accounting for 51% of tennis shoe revenue. This strength is attributable to the availability of hard courts as playing areas.
- Grass-court tennis shoes are expected to have the highest growth among categories with a CAGR of 10.3%, but it will still contribute only 4% of sales in 2031.
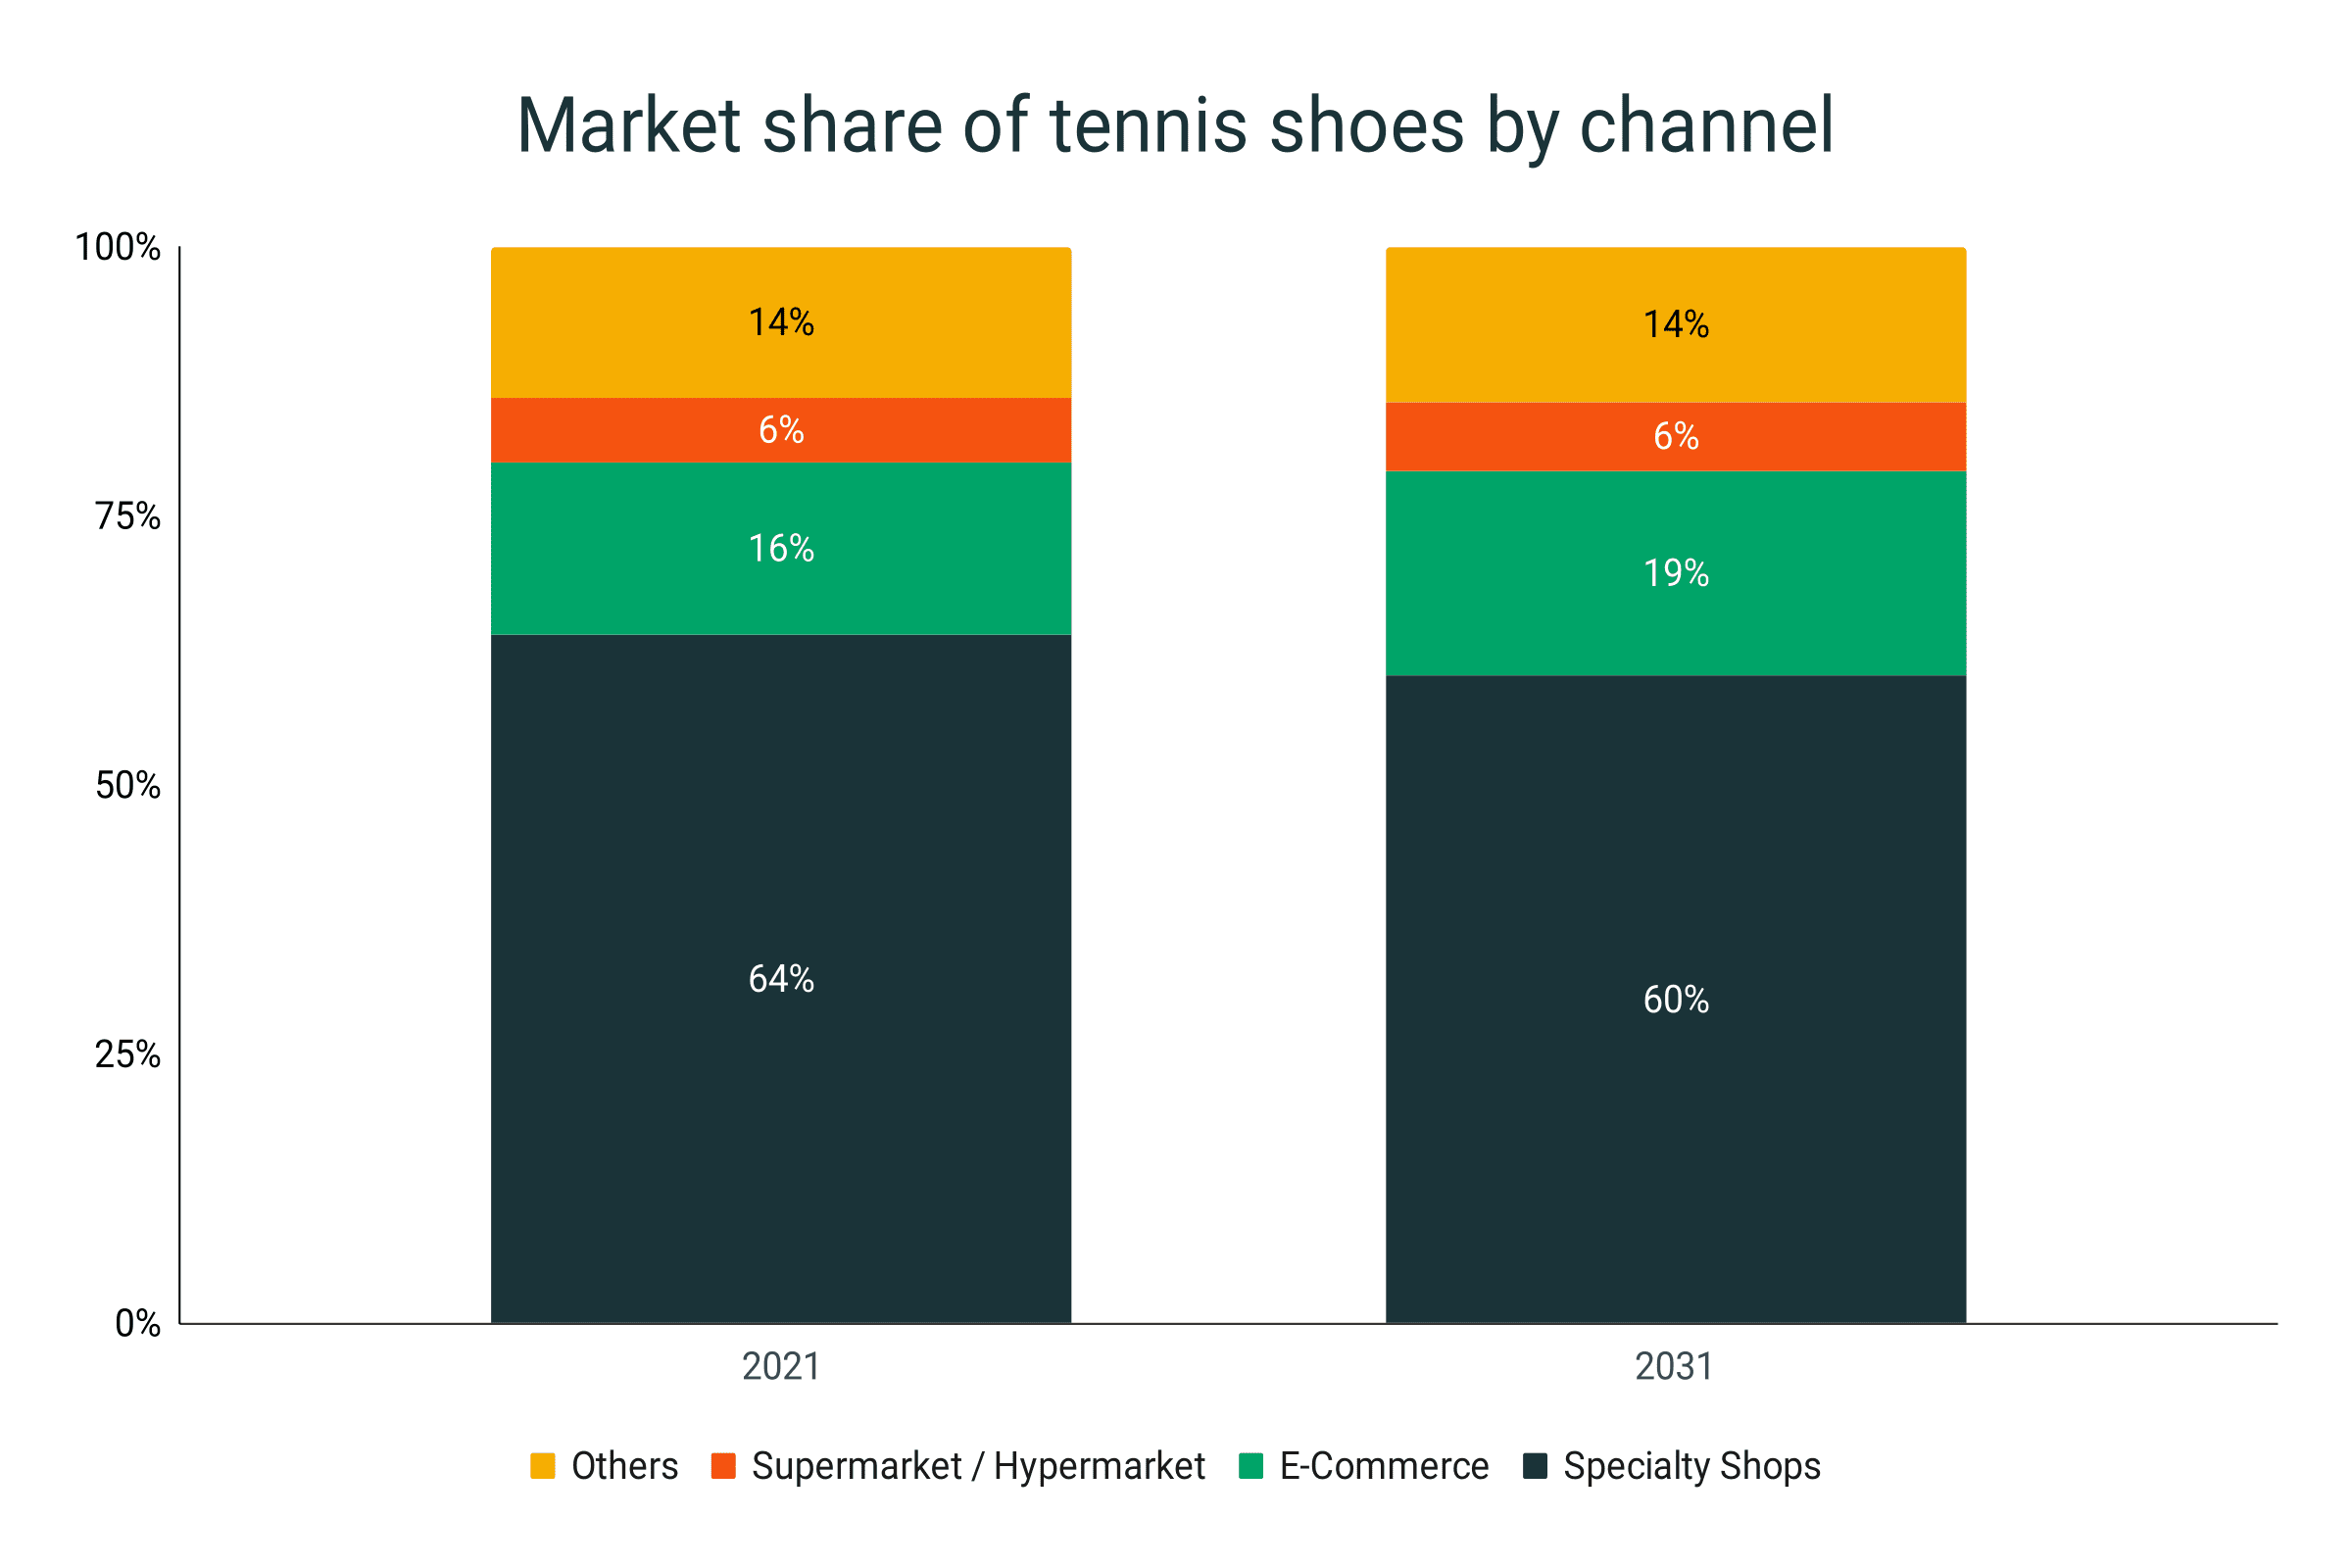
- Specialty shops generated $ 1.60B in sales in 2021 - the most out of any channel.
- Specialty shops’ share of 64% in 2021 is expected to drop to 60% in 2031 with the growth of e-commerce channel shares.
- Men’s tennis shoes accounted for $ 1.25B in revenue in 2021 - a figure that’s projected to grow by 41.6% between 2021 and 2031.
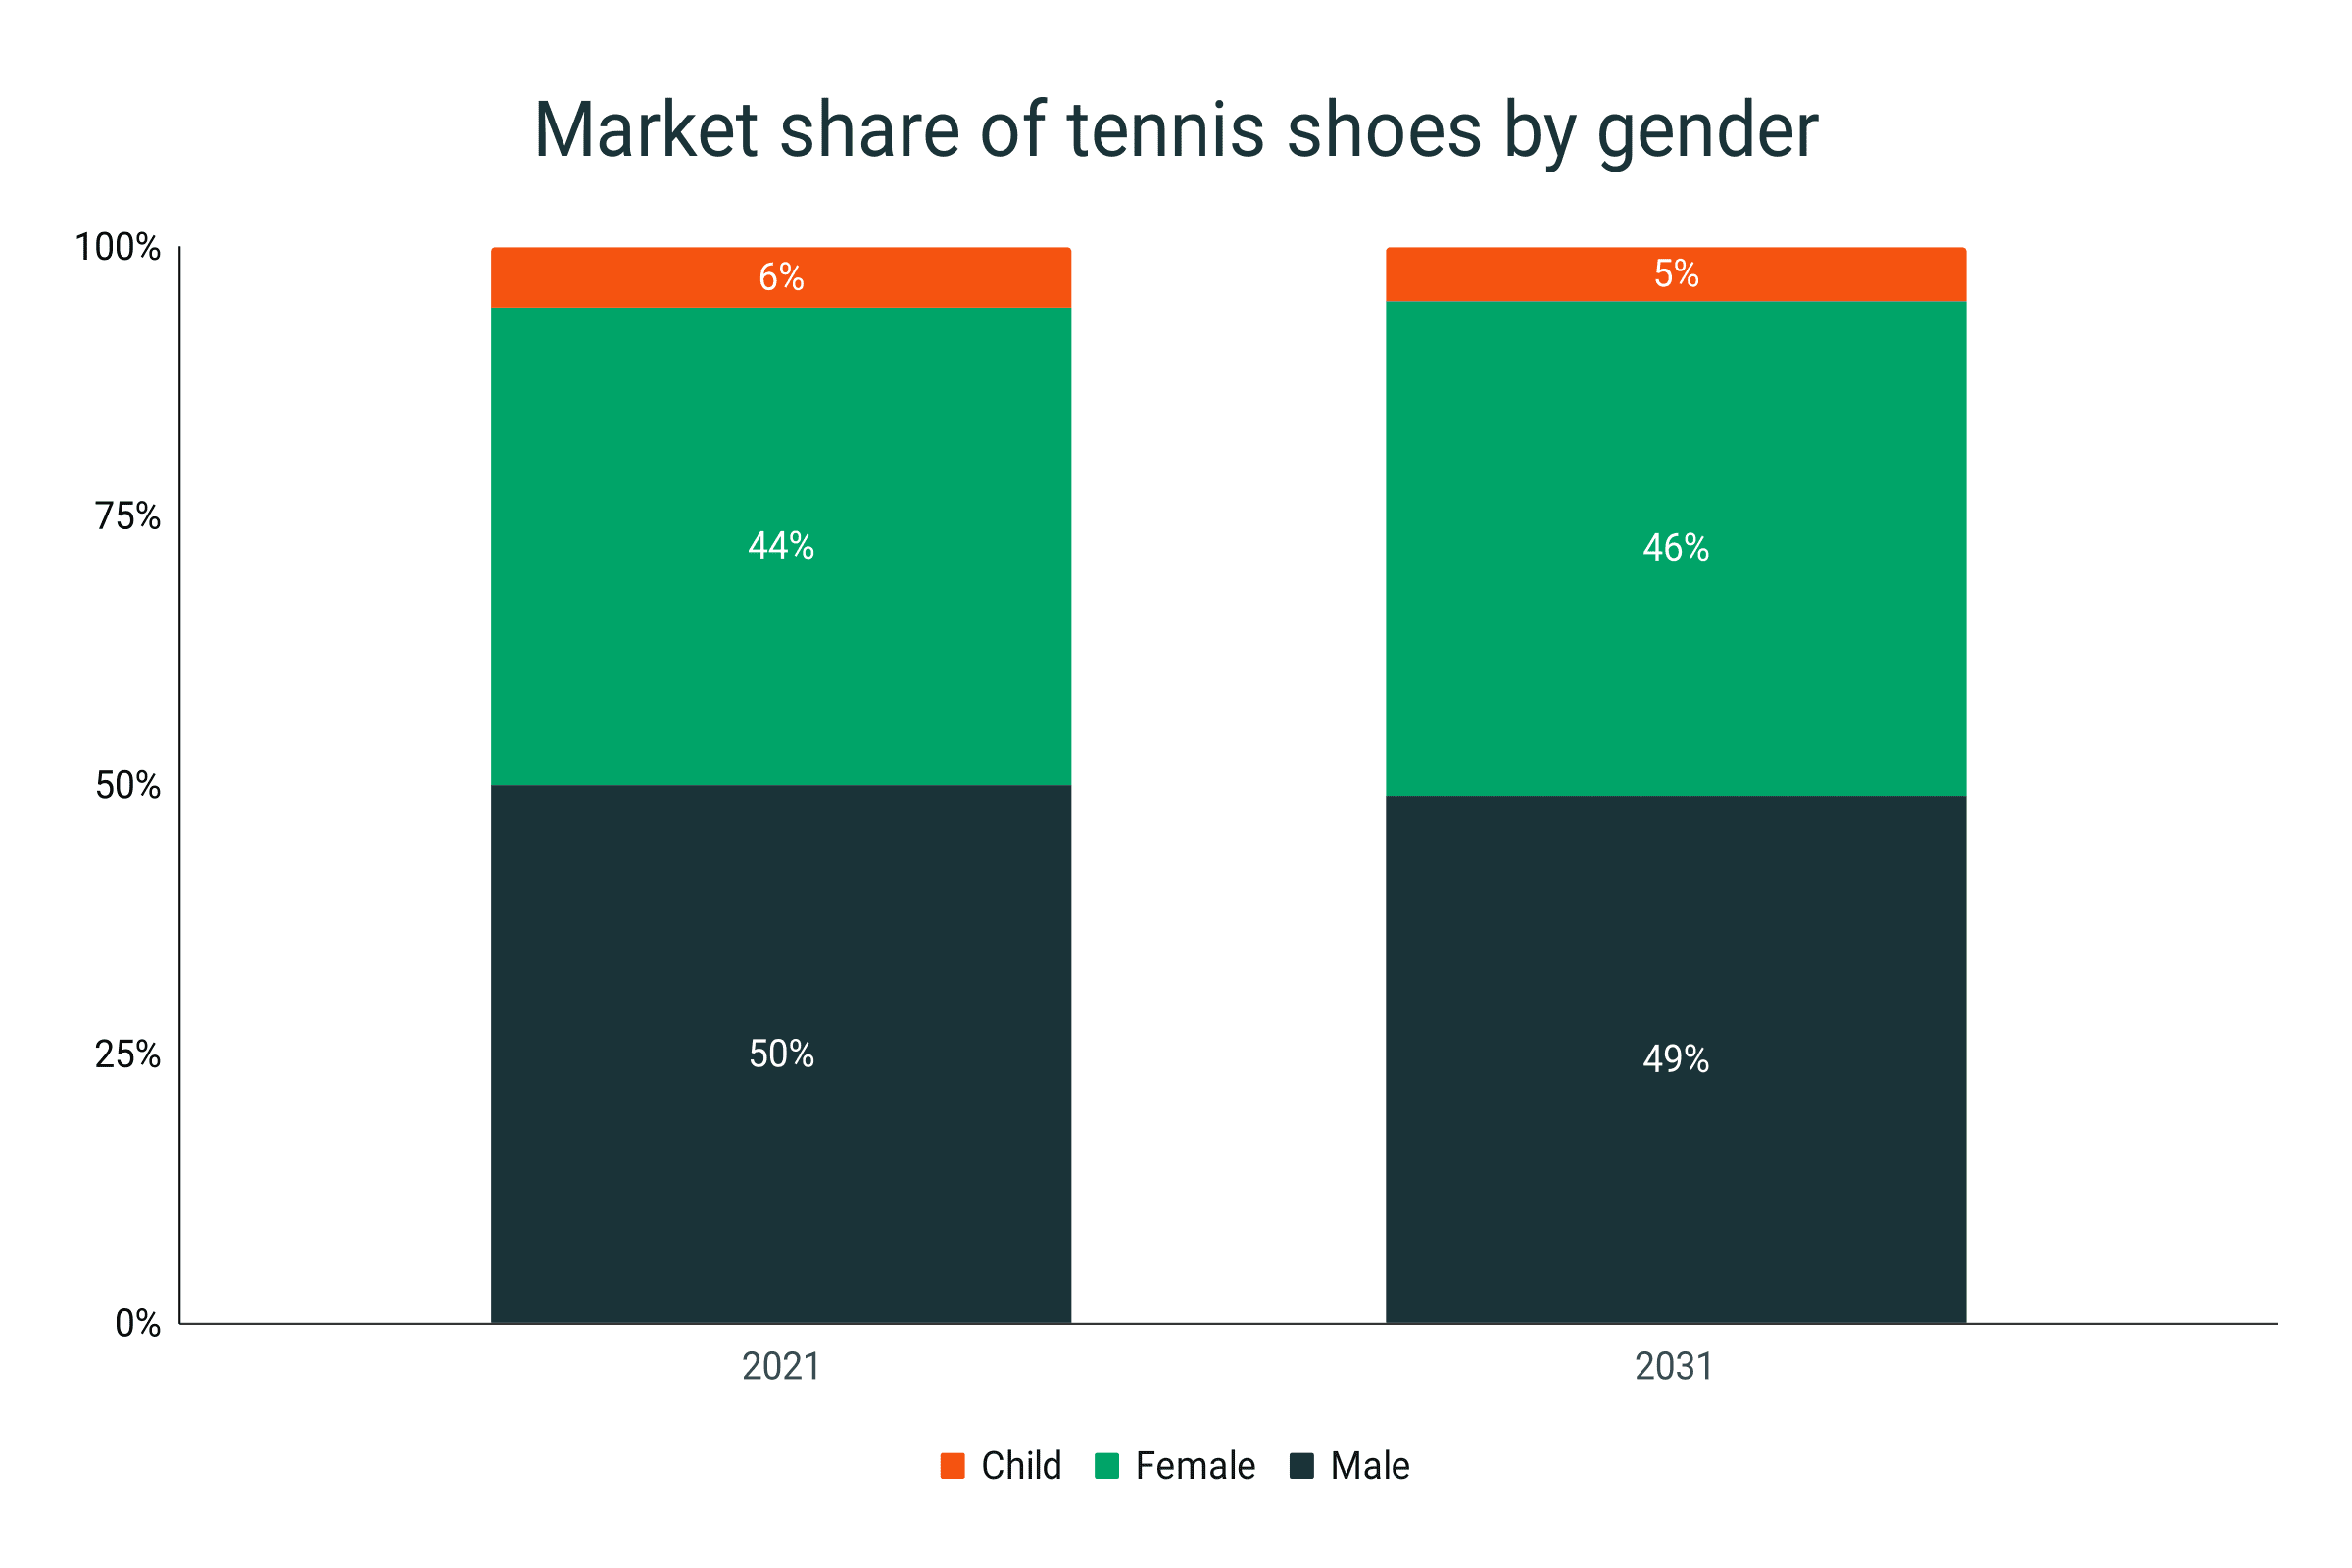
- Men’s tennis shoes share leadership of 50% in 2021 is expected to drop by 1%, while women’s tennis shoes shares at 44% in 2021 are expected to increase by 2%.
Tennis shoe market revenue by surface
- Hard-court tennis shoes have generated $ 1.26B in revenue in 2021 and are expected to grow by 46.8% in the next 10 years, reaching $1.85B in 2031.
- The clay-court tennis shoes market is sized at $1.18B in 2021 and is projected to grow to $ 1.61B by 2031.
- Grass-court tennis shoes sales in 2021 are at $ 0.06B and are expected to reach $ 0.14B in 2031.
- A 4.8% CAGR in hard-court tennis shoes is expected between 2021 and 2031.
- Clay-court tennis shoes are projected to have the lowest growth among the three categories. However, consistent growth is still expected at 4.0% CAGR.
- Grass court tennis shoes are expected to have the fastest growth at 10.3% CAGR (2021-2031), but will still have a relatively small market share by 2031 (4%).
|
Revenue (in $ million) |
2021 |
2031 |
CAGR |
|
Hard Court |
$1,264 |
$1,853 |
4.8% |
|
Clay Court |
$1,180 |
$1,607 |
4.0% |
|
Grass Court |
$57 |
$140 |
10.3% |
|
Total |
$2,501 |
$3,600 |
4.6% |

- Hard-court tennis shoes dominated the market with a 51% share in 2021. This share is expected to be maintained until 2031 because hard courts are the most cost-efficient and available surface to play on.
- Clay-court tennis shoes had a share of 47% in 2021, expected to drop by 2% in the next decade.
- Grass-court tennis shoes accounted for 2% of the tennis shoe market in 2021, expected to double to 4% by 2031 at the expense of clay-court shoes.
|
Market Share |
2021 |
2031 |
|
Hard Court |
51% |
51% |
|
Clay Court |
47% |
45% |
|
Grass Court |
2% |
4% |

Tennis shoe market revenue by channel
- Specialty stores contribute the largest amount of revenue to the tennis shoe market, generating $ 1.60B in 2021 which is expected to grow to $ 2.17B in 2031.
- The sales of tennis shoes from e-commerce channels are expected to jump from $ 0.39B in 2021 to $ 0.69B in 2031.
- Supermarket & hypermarket tennis shoe sales are expected to grow from $ 0.15B to $ 0.23B (53% growth) between 2021 and 2031.
- Other channels account for $ 0.36B in tennis shoe revenue in 2021, projected to reach $ 0.52B in 2031.
- Specialty shops post the slowest growth of tennis shoe sales, reflecting a CAGR of 3.2% in 2021-2031 versus the average of 3.8%
- E-commerce sales have the fastest growth with a CAGR of 5.8% from 2021-2031.
- Supermarket & Hypermarket sales grow quickly with a CAGR of 4.7% between 2021 and 2031.
- Other channel tennis shoe sales match the growth of the industry at 3.8% between 2021 and 2031.
|
Revenue (in $ million) |
2021 |
2031 |
CAGR |
|
Specialty Shops |
$1,599 |
$2,166 |
3.2% |
|
E-Commerce |
$395 |
$687 |
5.8% |
|
Supermarket / Hypermarket |
$146 |
$229 |
4.7% |
|
Others |
$360 |
$518 |
3.8% |
|
Total |
$2,500 |
$3,600 |
3.8% |

- Specialty stores are the most common channel from which tennis players buy tennis shoes, accounting for 64% in terms of 2021 revenue because of the store experience, the availability of complementary products, and promotions.
- E-commerce is expected to eat up some specialty store shares, reaching 19% in 2031 from only 16% in 2021.
- Supermarket & hypermarket tennis shoe shares are expected to stagnate between 2021 and 2031.
- Other channel tennis shoe shares are projected to remain the same between 2021 and 2031.
Market Share of Tennis Shoes by Sales Channel
|
Market Share |
2021 |
2031 |
|
Specialty Shops |
64% |
60% |
|
E-Commerce |
16% |
19% |
|
Supermarket / Hypermarket |
6% |
6% |
|
Others |
14% |
14% |
Tennis shoe market revenue by demographic
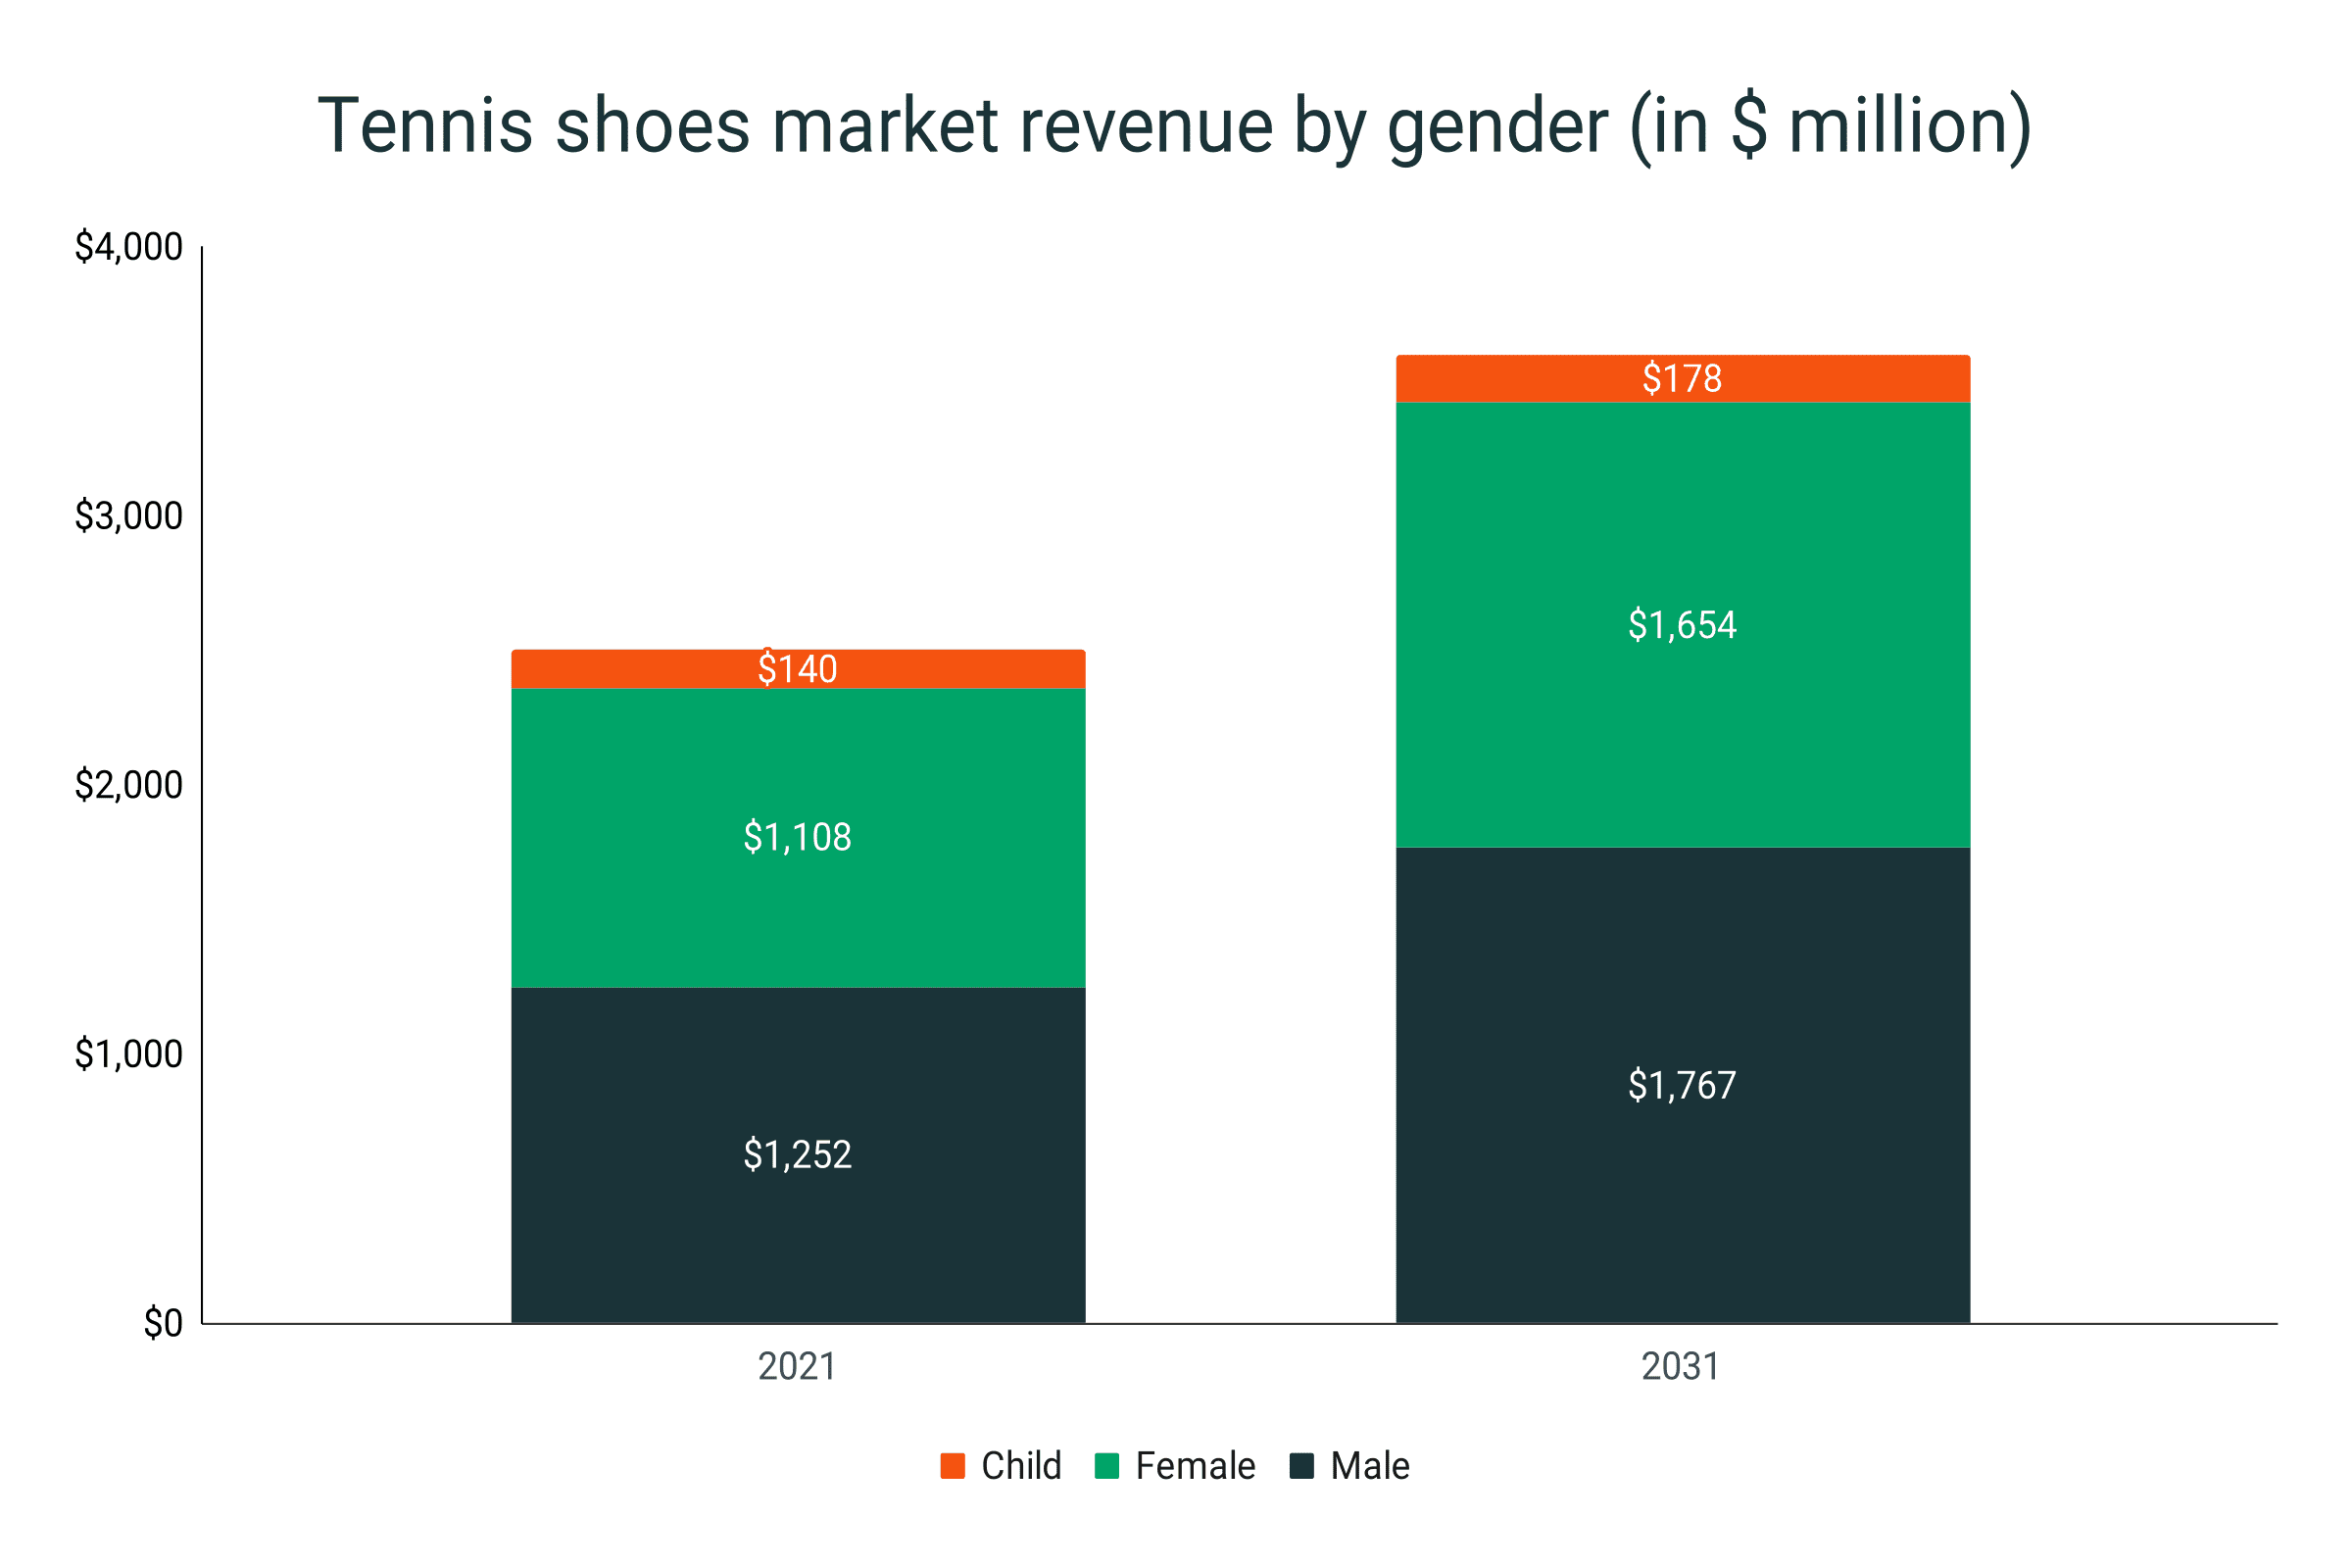
- Men’s tennis shoes generate the most revenue among any demographic with sales of $ 1.25B in 2021 and $ 1.77B in 2031.
- Women’s tennis shoes are expected to grow from $ 1.11B in 2021 to $ 1.65B in 2031, posting a growth of 48.6% within the period.
- Children’s tennis shoes sales were at $ 0.14B in 2021. The segment is expected to increase to $ 0.18B by 2031.
- Men’s tennis shoes’ CAGR of 3.5% between 2021 and 2031 is slower than the industry average (3.8%).
- Women’s tennis shoes are expected to grow slightly faster (4.1%) than the industry, explaining the growth in shares.
- Children’s tennis shoes post the lowest CAGR among all demographic groups - only 2.5% between 2021 and 2031.
|
Revenue (in $ million |
2021 |
2031 |
CAGR |
|
Male |
$1,252 |
$1,767 |
3.5% |
|
Female |
$1,108 |
$1,654 |
4.1% |
|
Child |
$140 |
$178 |
2.5% |
|
Total |
$2,500 |
$3,600 |
3.8% |
- Men’s tennis shoes are expected to retain share leadership throughout the period, losing only 1% of shares.
- The women’s category is a close second at 44% in 2021 and will inch closer to the men’s category, reaching 46% in 2031.
- Children’s tennis shoes, which provided 6% of the revenues in 2021, are expected to contribute a lower percentage of sales by 2031 (5%).
Market Share of Tennis Shoes by Demographic
|
Market Share |
2021 |
2031 |
|
Male |
50% |
49% |
|
Female |
44% |
46% |
|
Child |
6% |
5% |
Top 75 ATP-ranked players and their shoe sponsors
- Nike sponsors the most Top 75 ATP-Ranked players versus other brands with 15
- Nike is able to sponsor 6 out of the top 10 ranked players
- ASICS is a close second, sponsoring 14 Top 75 ATP-Ranked Players
- There’s a steep drop in number of sponsorships of remaining brands with Yonex leading the way with 6 sponsored players, with Adidas, K-Swiss and Lotto each having 5.
- Other brands (Lacoste, Fila, New Balance, Joma, Diadora, Mizuno, Wilson, Le Coq Sportif, On, Under Armour, Head) have 3 or less signed players.
- Only 4 out of the top 75 ATP-ranked tennis players are either unsigned or don’t have disclosed shoe sponsors.
- Most commonly worn shoe line among the top 20 ATP-Ranked Players is the Nike Air Zoom Vapour Pro line, worn by 6 players (combined Vapour Pro and Vapour Pro 2).
- 3 of the top 20 ATP-Ranked players wear the Adidas Barricade.
- 2 of the top 20 ATP-Ranked players wear the ASICS Court FF line. The same goes for the Yonex Power Cushion Eclipsion line.
|
Brand |
Players Sponsored |
|
Nike |
15 |
|
ASICS |
14 |
|
Yonex |
6 |
|
Adidas |
5 |
|
K-Swiss |
5 |
|
Lotto |
5 |
|
Lacoste |
3 |
|
Fila |
3 |
|
New Balance |
2 |
|
Joma |
2 |
|
Diadora |
2 |
|
Mizuno |
2 |
|
Wilson |
2 |
|
Le Coq Sportif |
2 |
|
On |
1 |
|
Under Armour |
1 |
|
Head |
1 |
|
Undisclosed |
4 |

Top 75 WTA-ranked players and their shoe sponsors
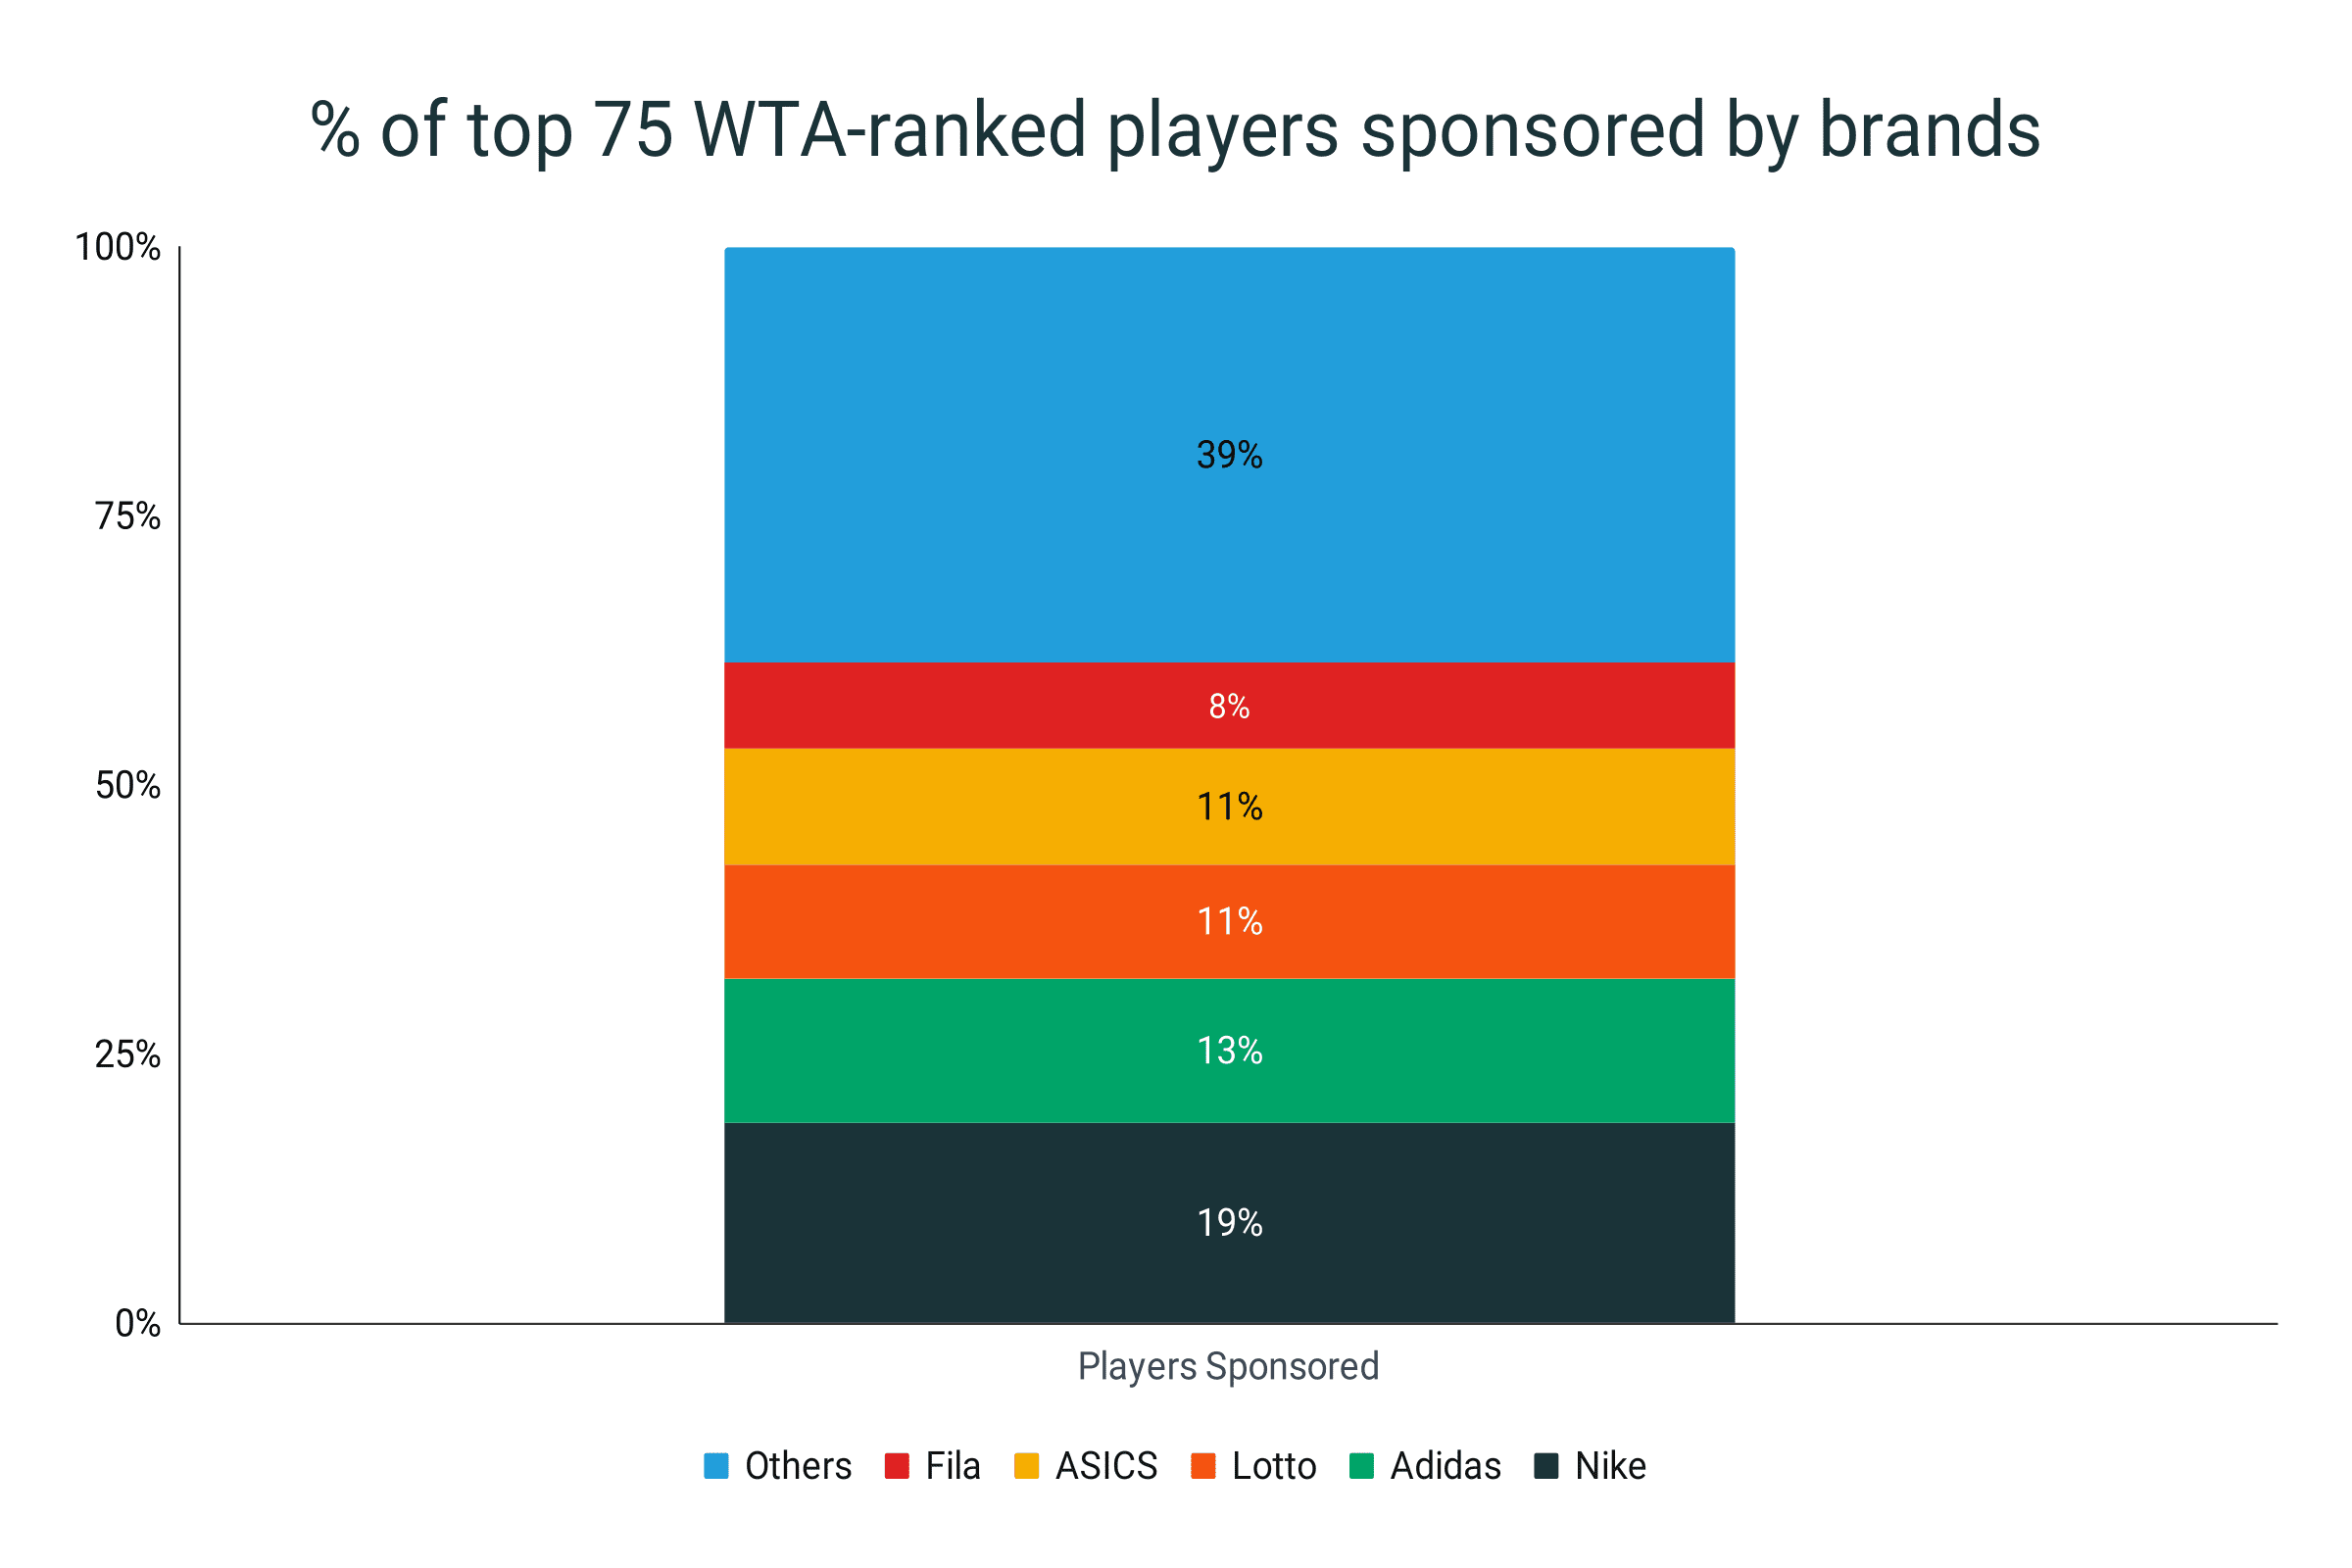
- Nike has the most top 75 WTA-ranked players sponsored with 14.
- Adidas follows with 10 sponsored players.
- Lotto and ASICS follows with 8, while Fila has 6 sponsored players.
- Other brands (Joma, Wilson, K-Swiss, Yonex, New Balance, On, EA7, Mizuno, Diadora) have 4 or less sponsored players.
- 10 Top 75 WTA-ranked players are either unsigned or have not declared their shoe sponsors publicly.
- There’s no dominant brand in the top 10.
- The Adidas Barricade is the most commonly used shoe by the top 20 WTA-Ranked Players with 4 users.
- The Nike Air Zoom Pro line (inclusive of Pro and Pro 2) is used by 4 of the top 20 WTA-Ranked Players.
- The Adidas Avacourt and the ASICS Solution Speed FF 2 both have 2 players each from the top 20 WTA-ranked players.
|
Brand |
Players Sponsored |
|
Nike |
14 |
|
Adidas |
10 |
|
Lotto |
8 |
|
ASICS |
8 |
|
Fila |
6 |
|
Joma |
4 |
|
Wilson |
3 |
|
K-Swiss |
3 |
|
Yonex |
3 |
|
New Balance |
2 |
|
On |
1 |
|
EA7 |
1 |
|
Mizuno |
1 |
|
Diadora |
1 |
|
Undisclosed |
10 |
Tennis shoe facts
- Tennis shoes usually wear out after 45-60 hours of use, equivalent to about 1 shoe per year for those who play one hour per week.
- In a singles match, a tennis shoe runs for an average of 3 miles due to the width of the court.
- Grass-court tennis shoes usually have nubs that help grip the slippery court.
- Clay-court tennis shoes are usually mud-resistant, have high levels of lateral support, and grip well.
- Hard-court tennis shoes need sturdy outsoles because of the tough court.
- Tennis shoes were originally called plimsolls in 1892 - these became the prototype for trainers.
- Keds is the oldest tennis shoe brand.