Puma Shoes Statistics
This report is a compilation of various qualitative data about the past, present, and future of the PUMA shoe brand.
Top PUMA shoe statistics
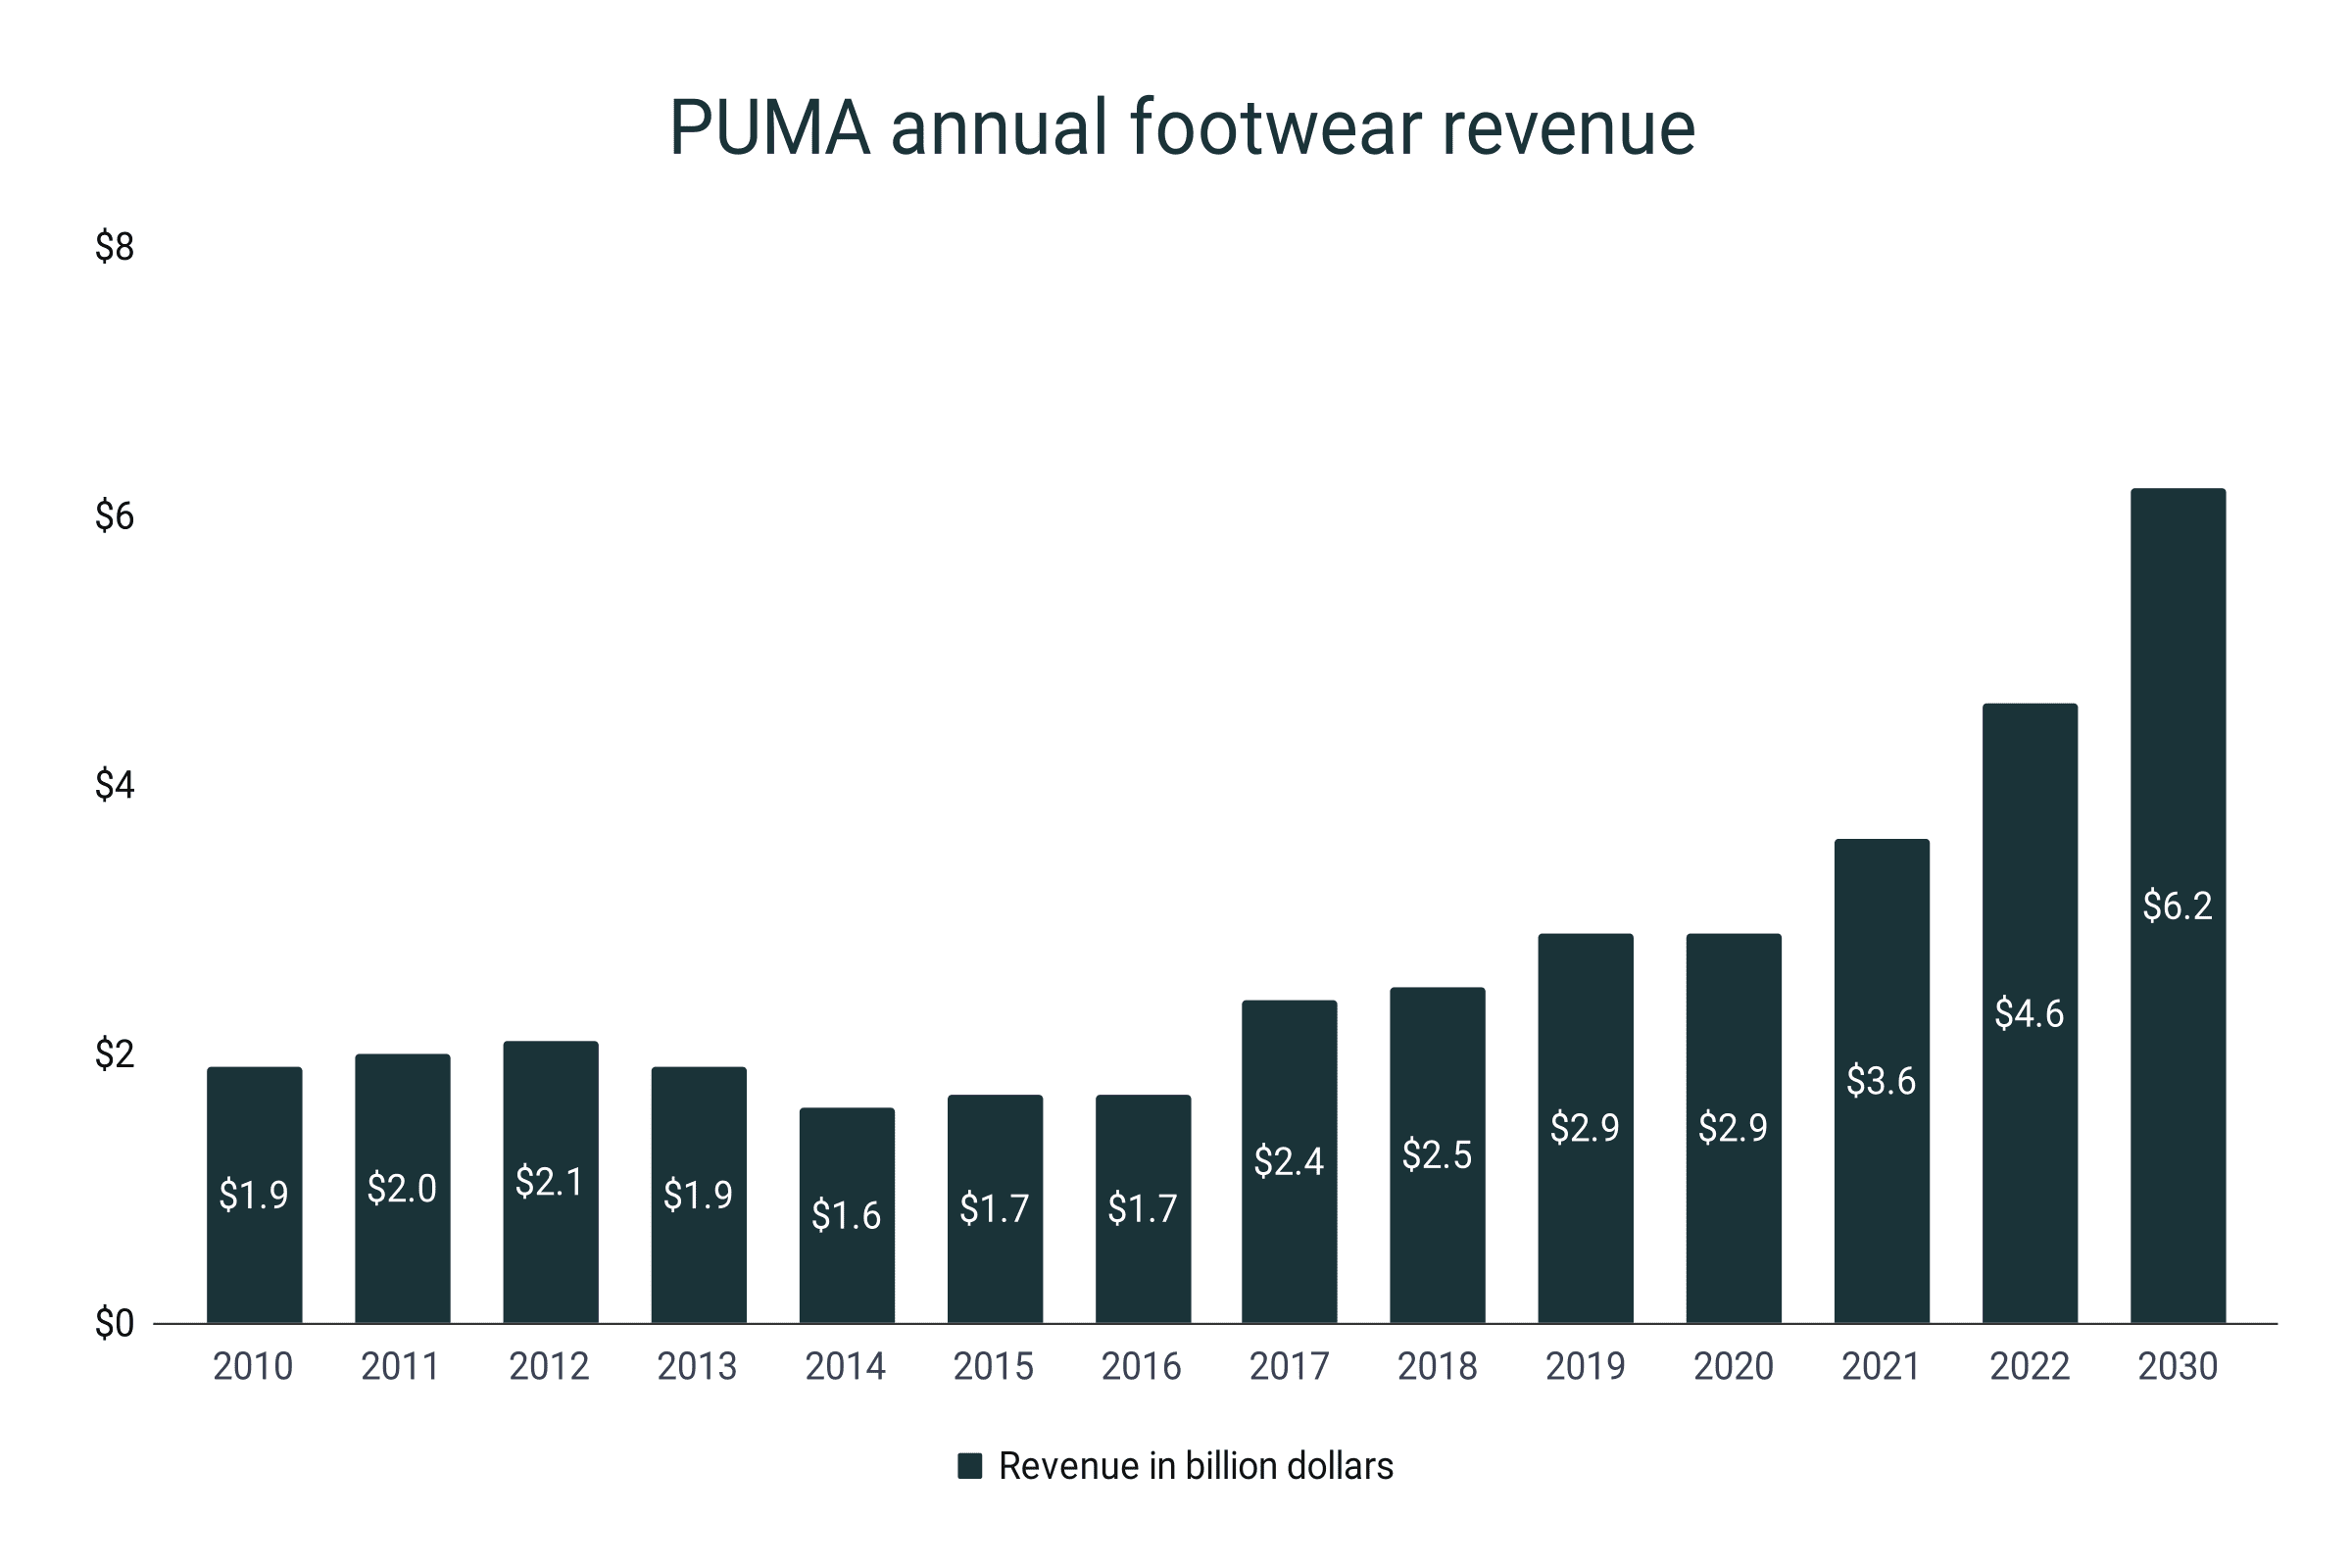
- The revenue of PUMA’s footwear products amounted to $4.6 billion in 2022.
- PUMA’s revenue from shoes experienced continuous growth from 2014-2022. If the trend continues, the company will reach $6.2 in footwear revenues by 2030.
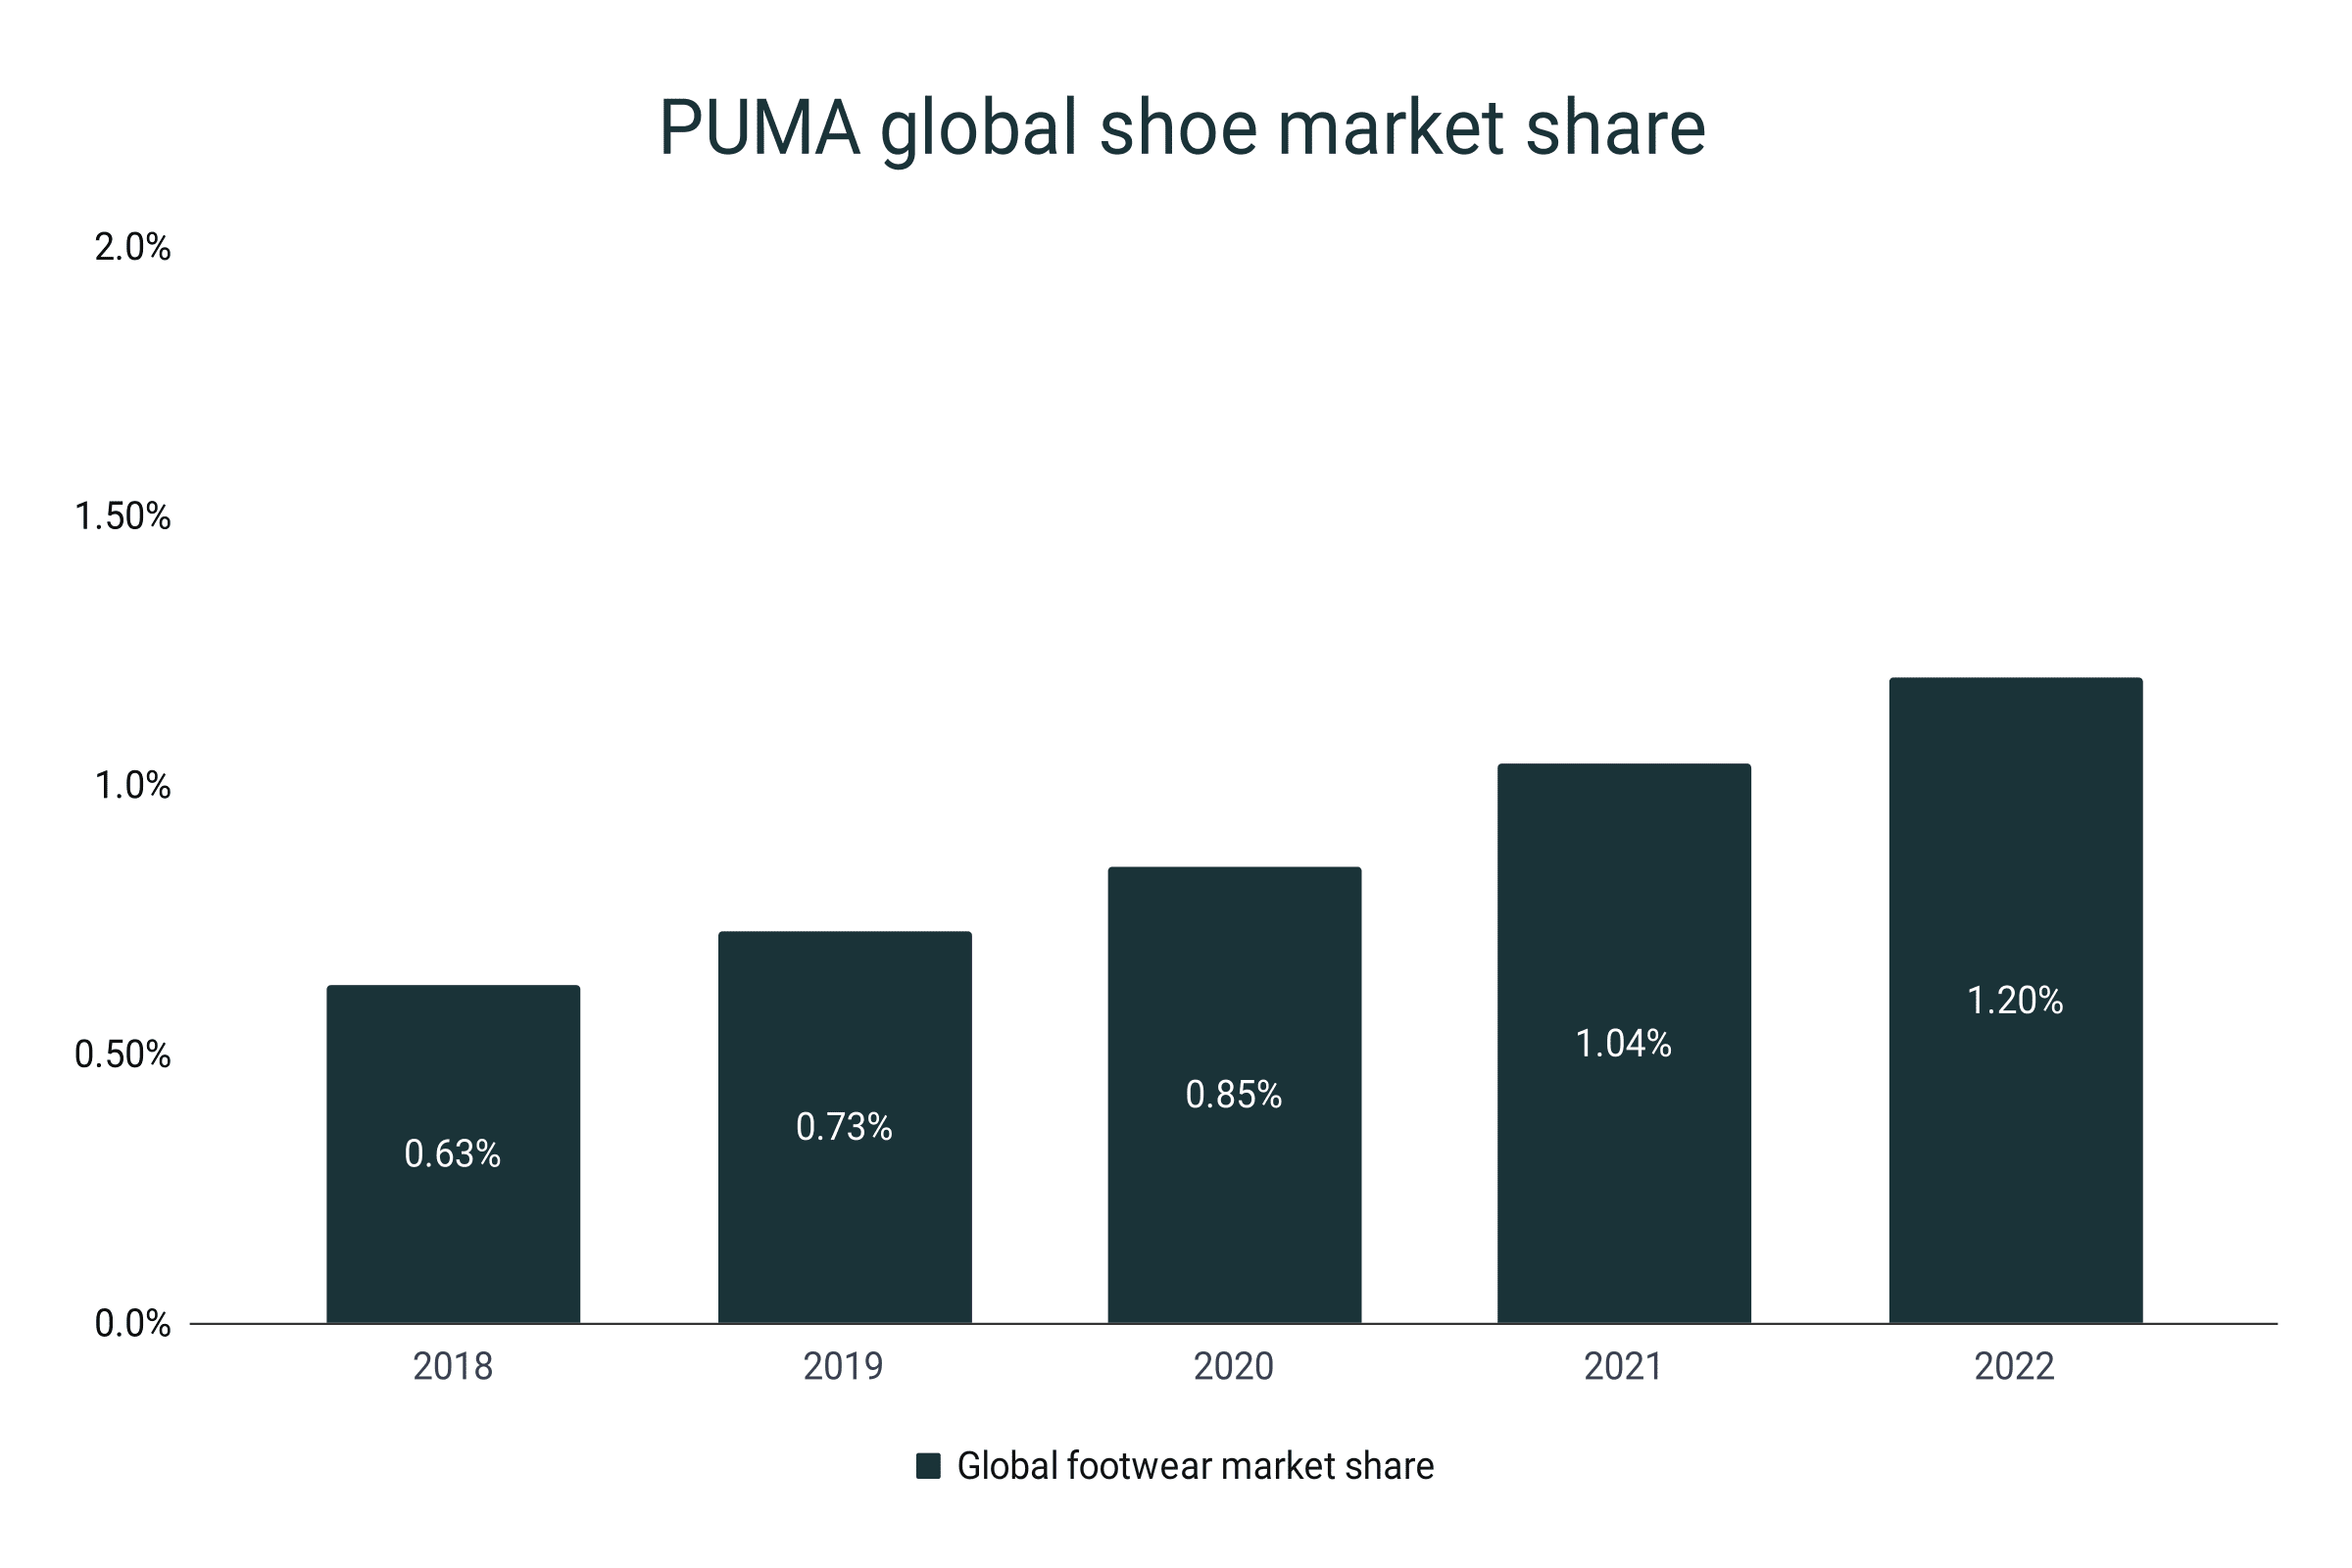
- As of 2022, the global shoe market share of PUMA is 1.2%.
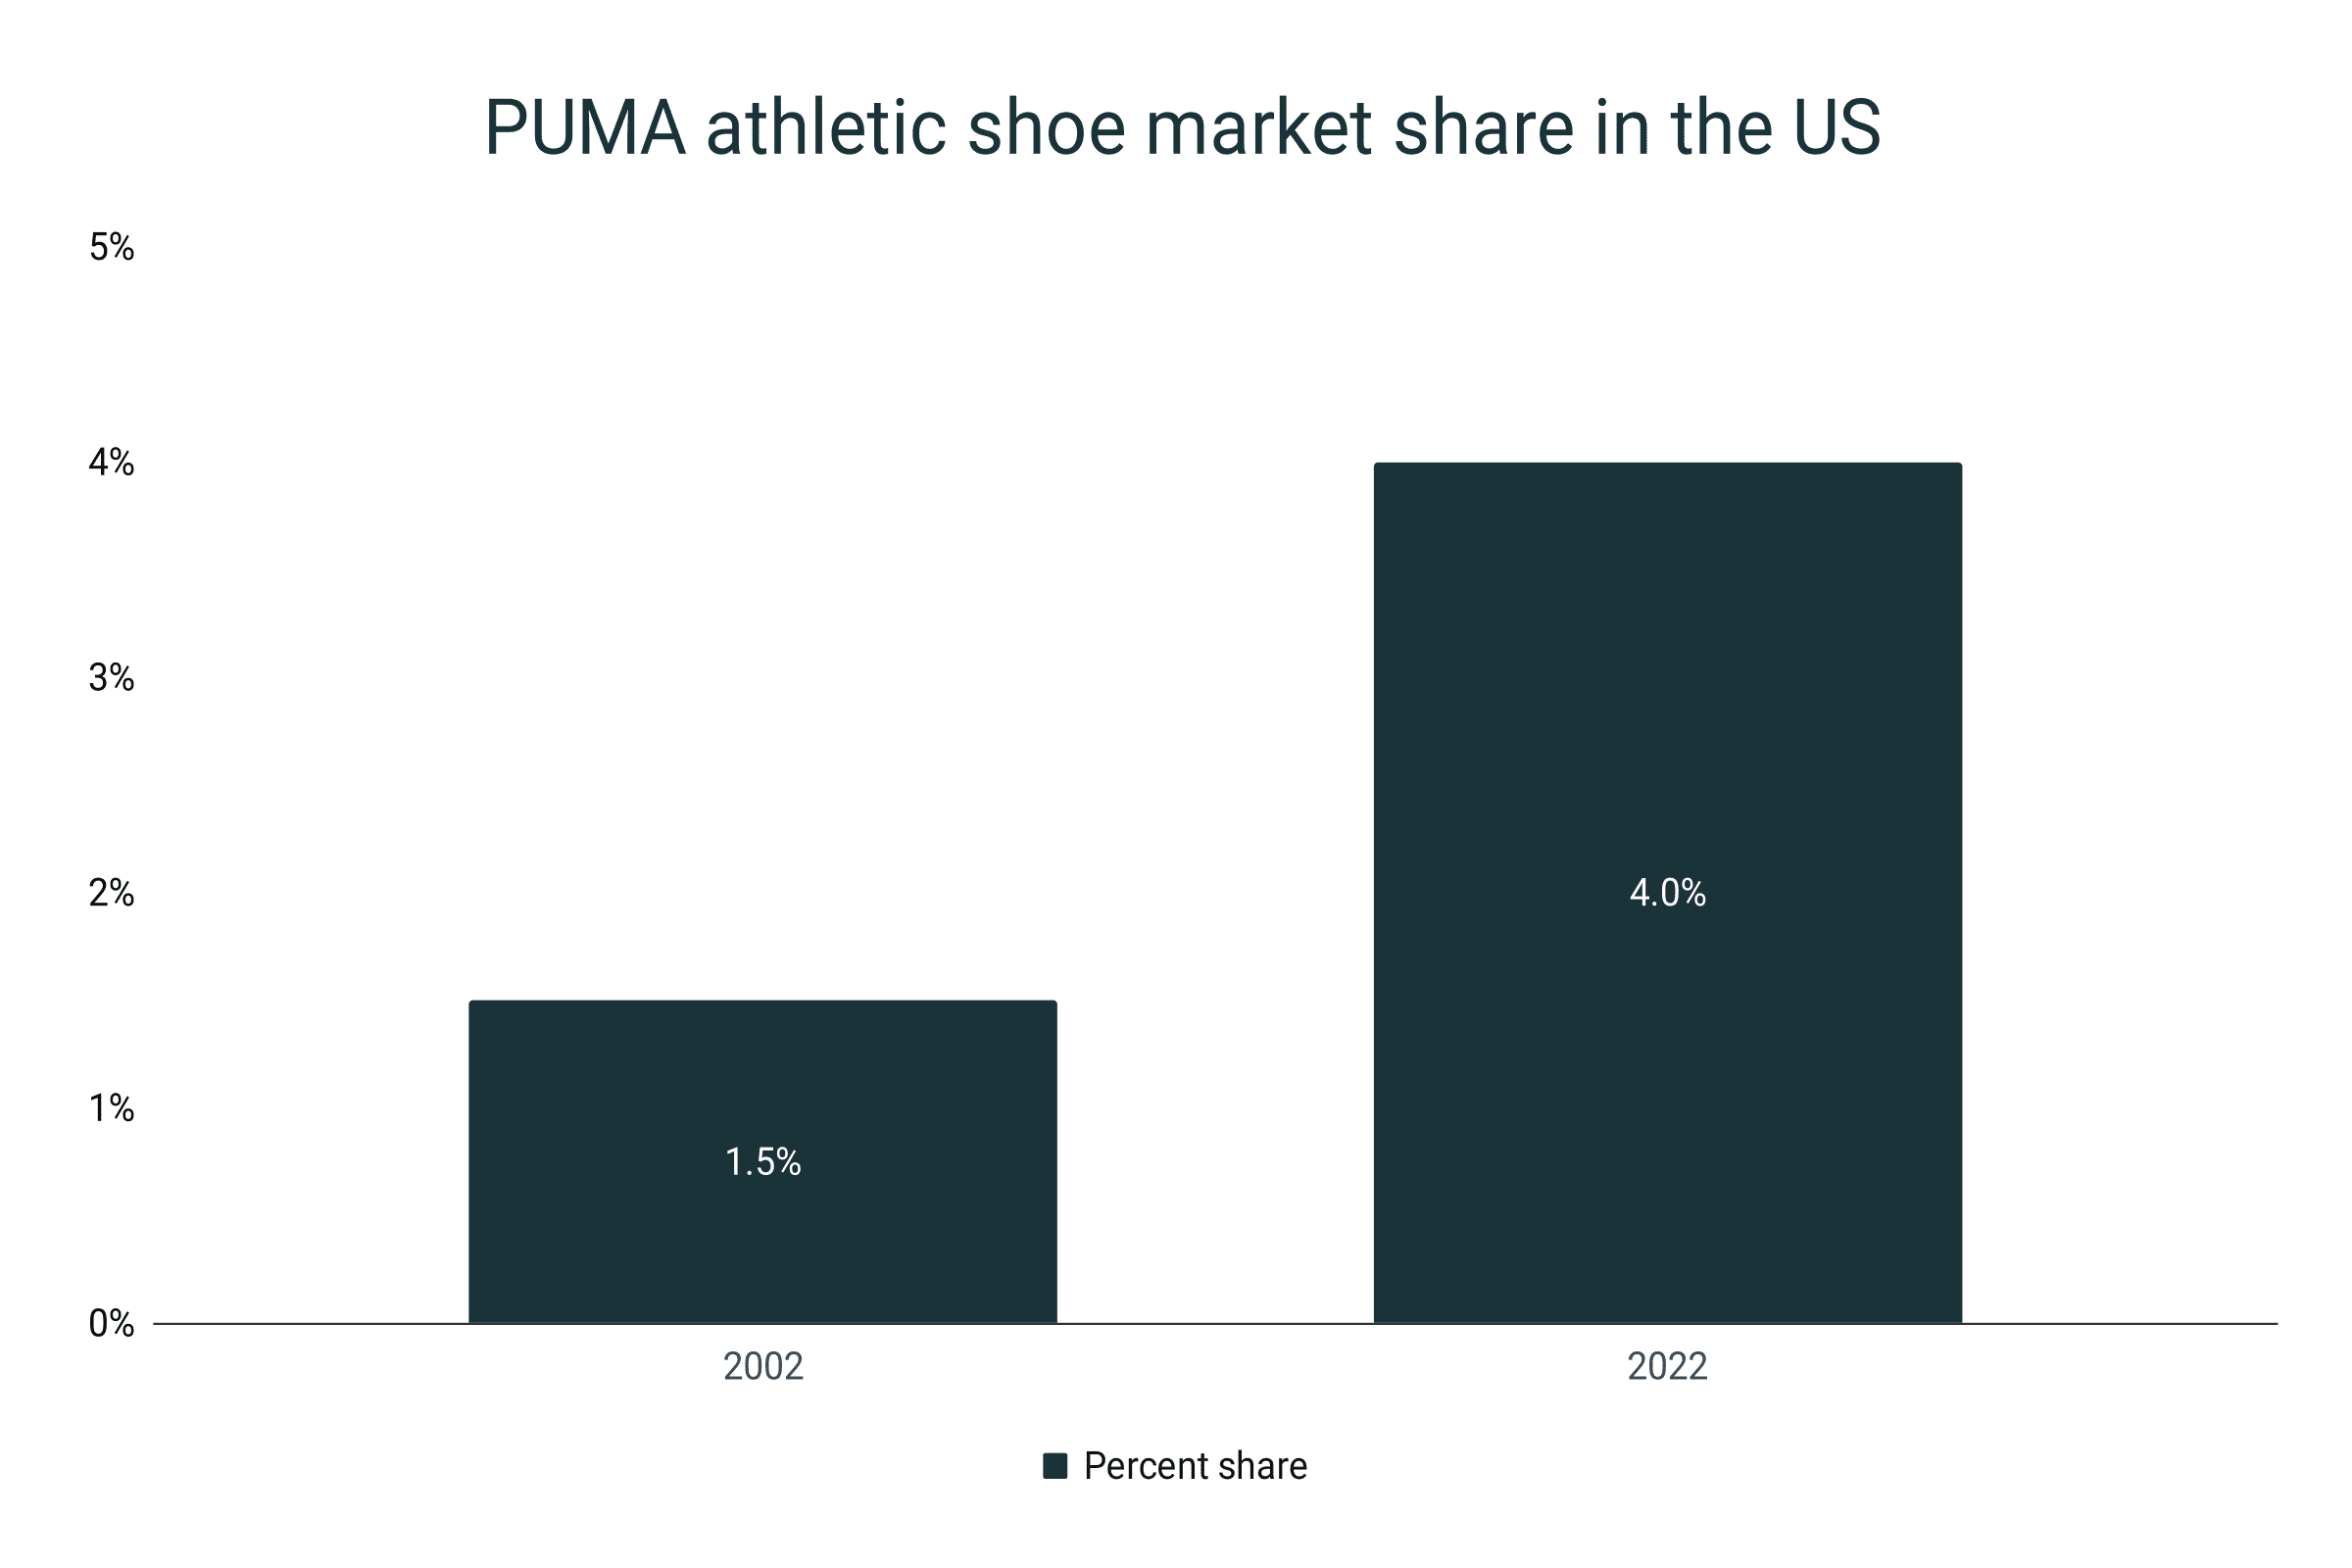
- Meanwhile, in the United States, the company holds 4% of the athletic shoe segment.
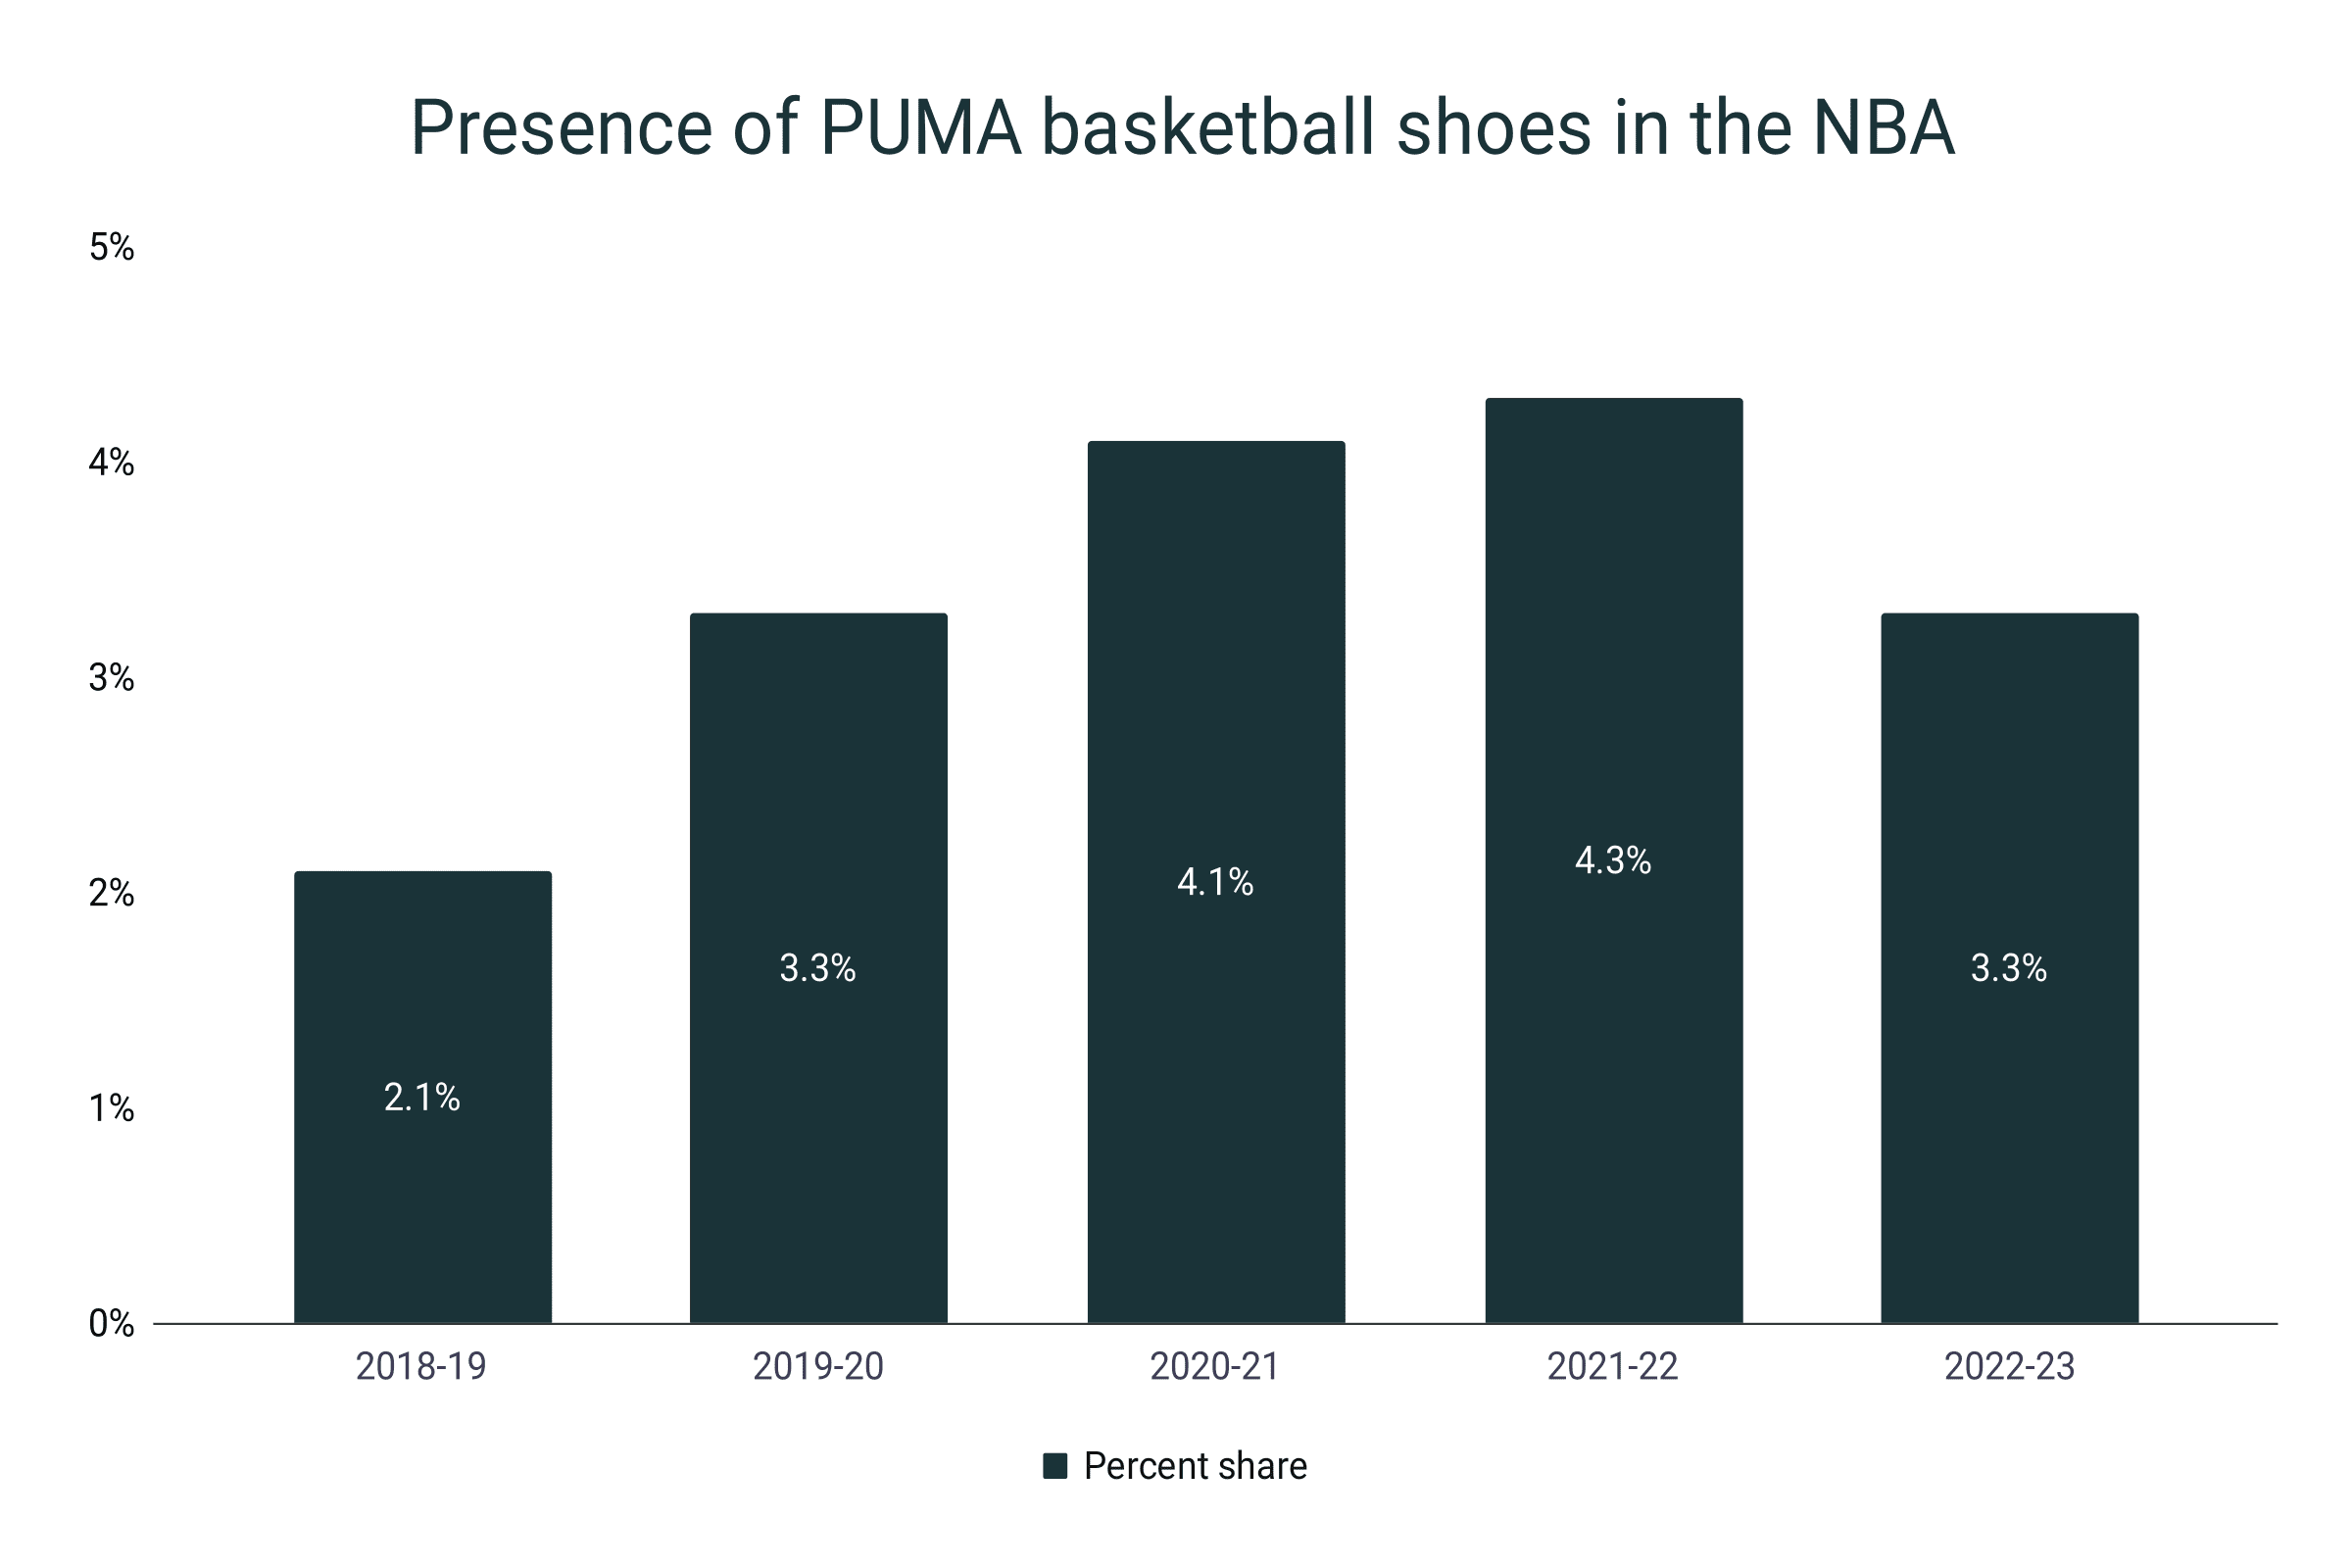
- PUMA is the fourth most popular basketball shoe brand in the NBA, averaging 3.4% for the past five seasons.
- In the global athletic footwear market, PUMA maintains a 2.1% share. In trainers, the shoe brand secured a 5.1% cut.
- 35 million pairs of PUMA shoes are produced annually.
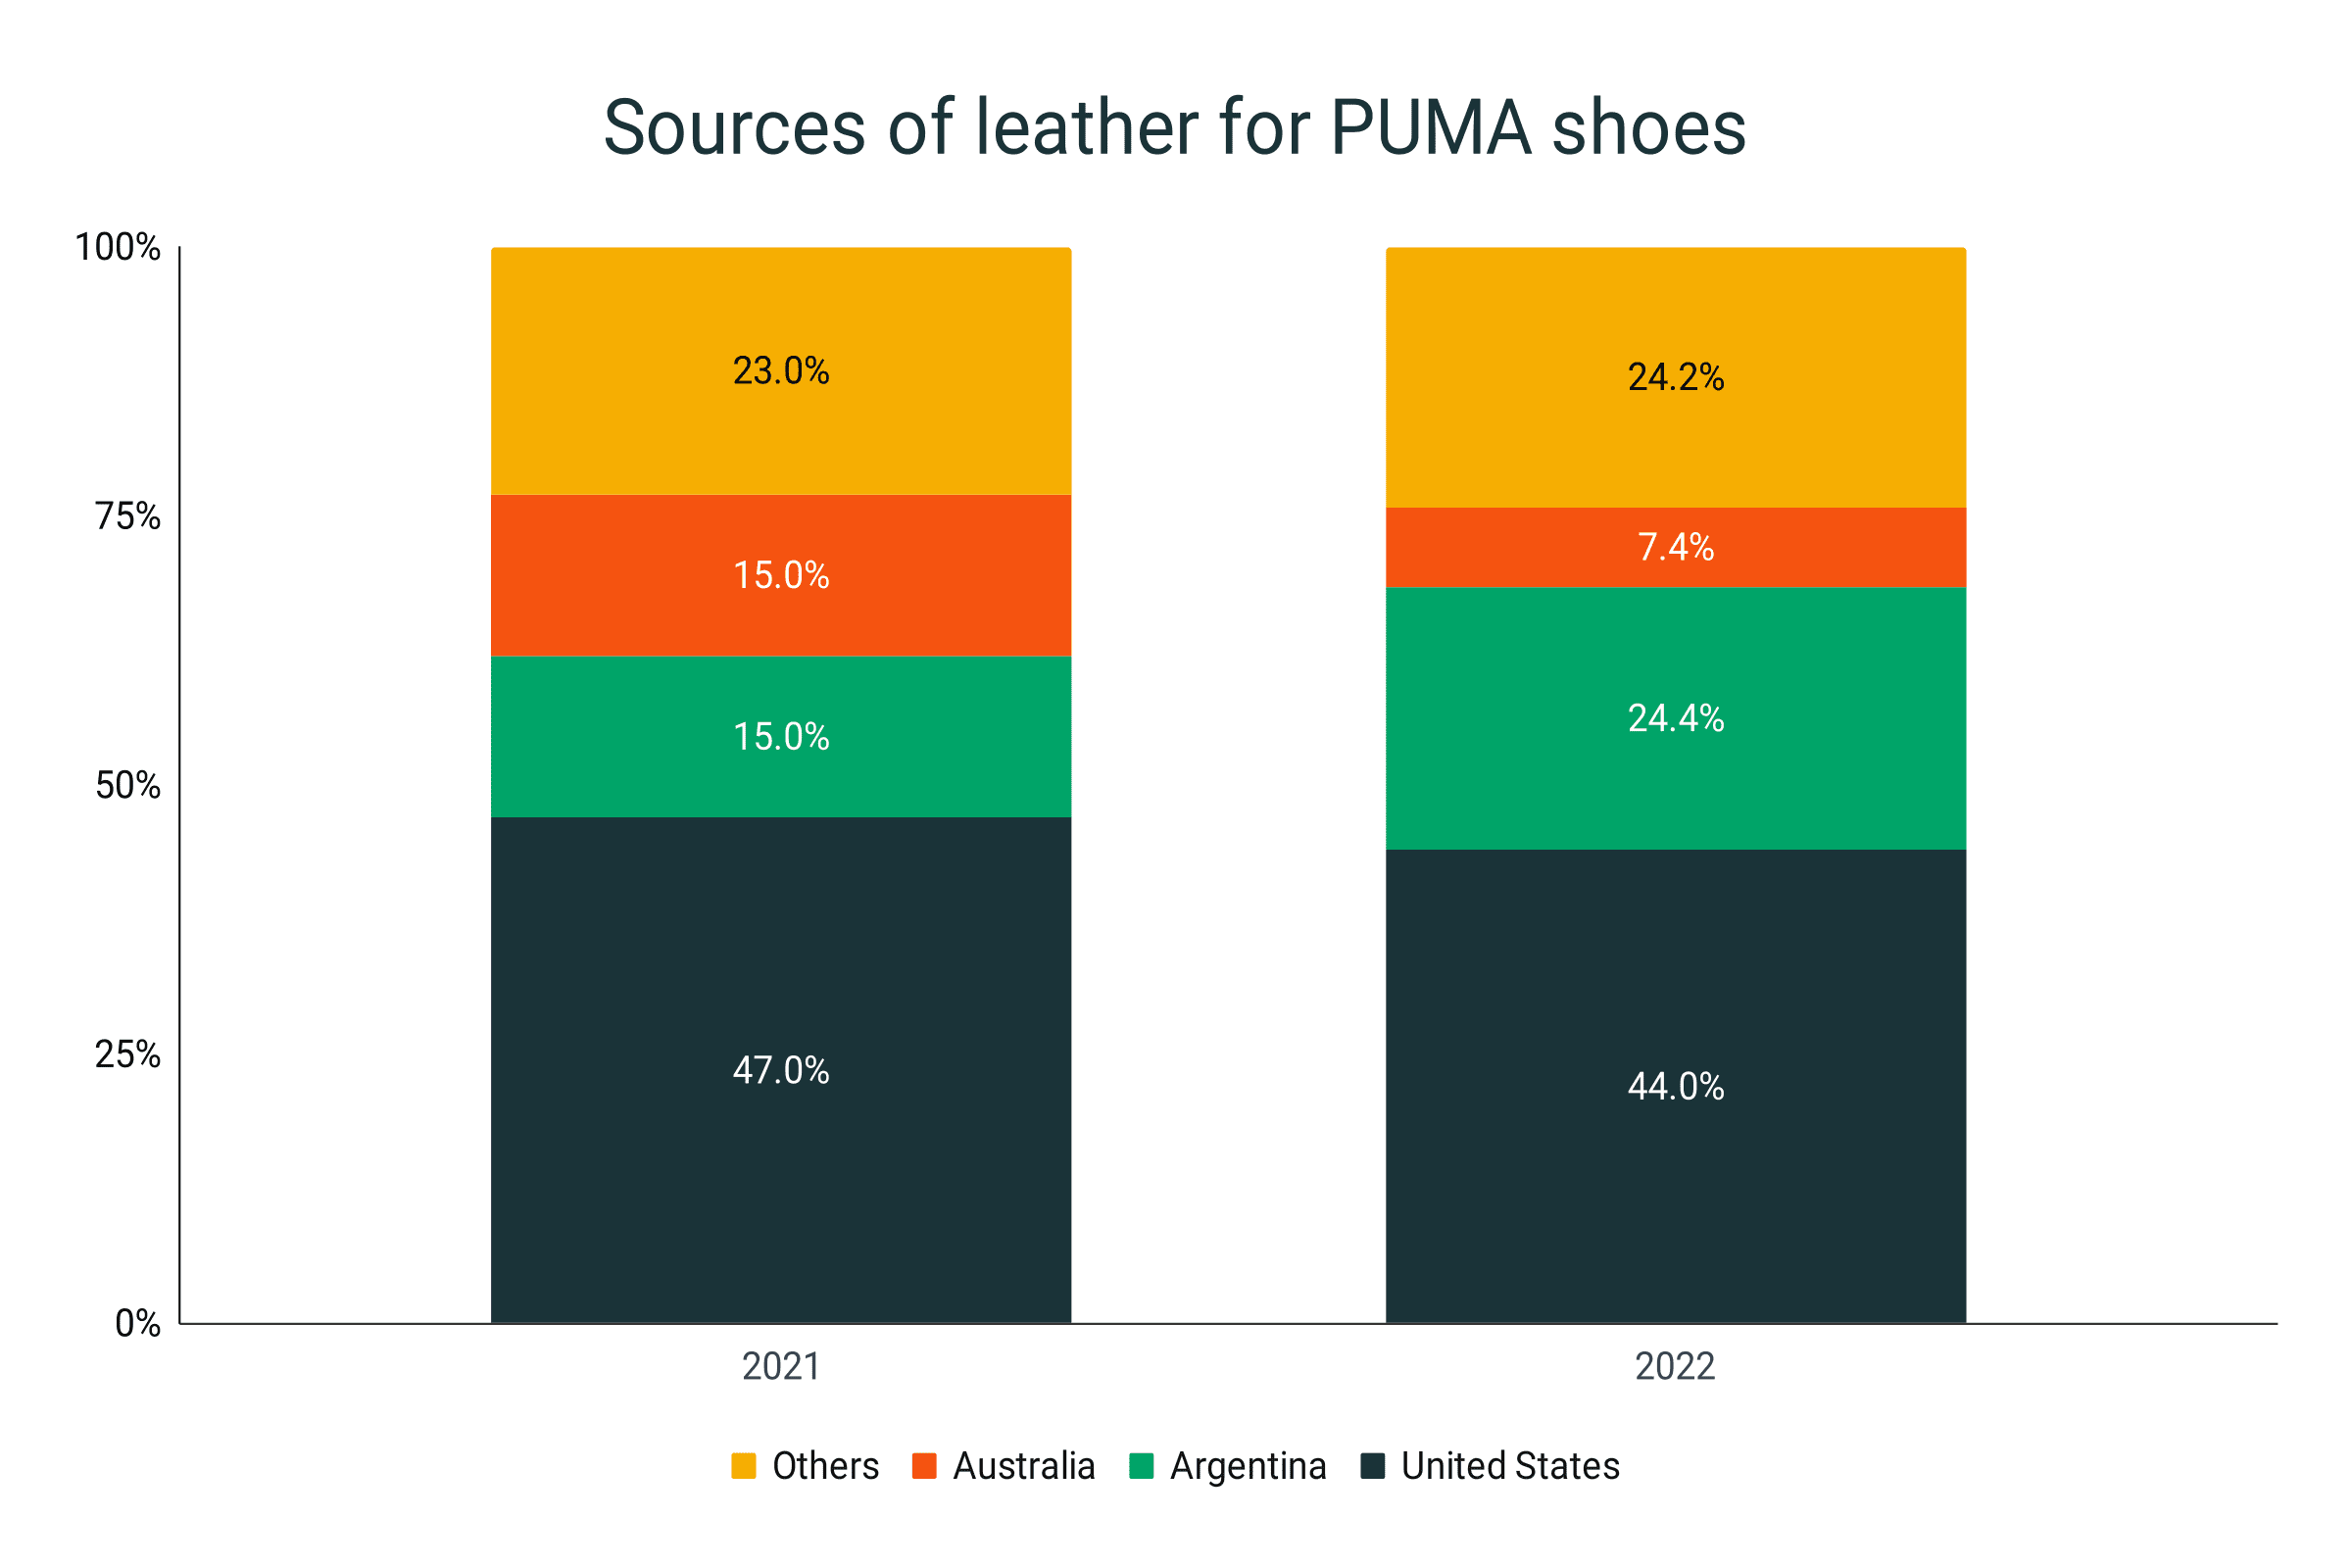
- In 2022, 44% of the company’s leather materials were sourced from USA.
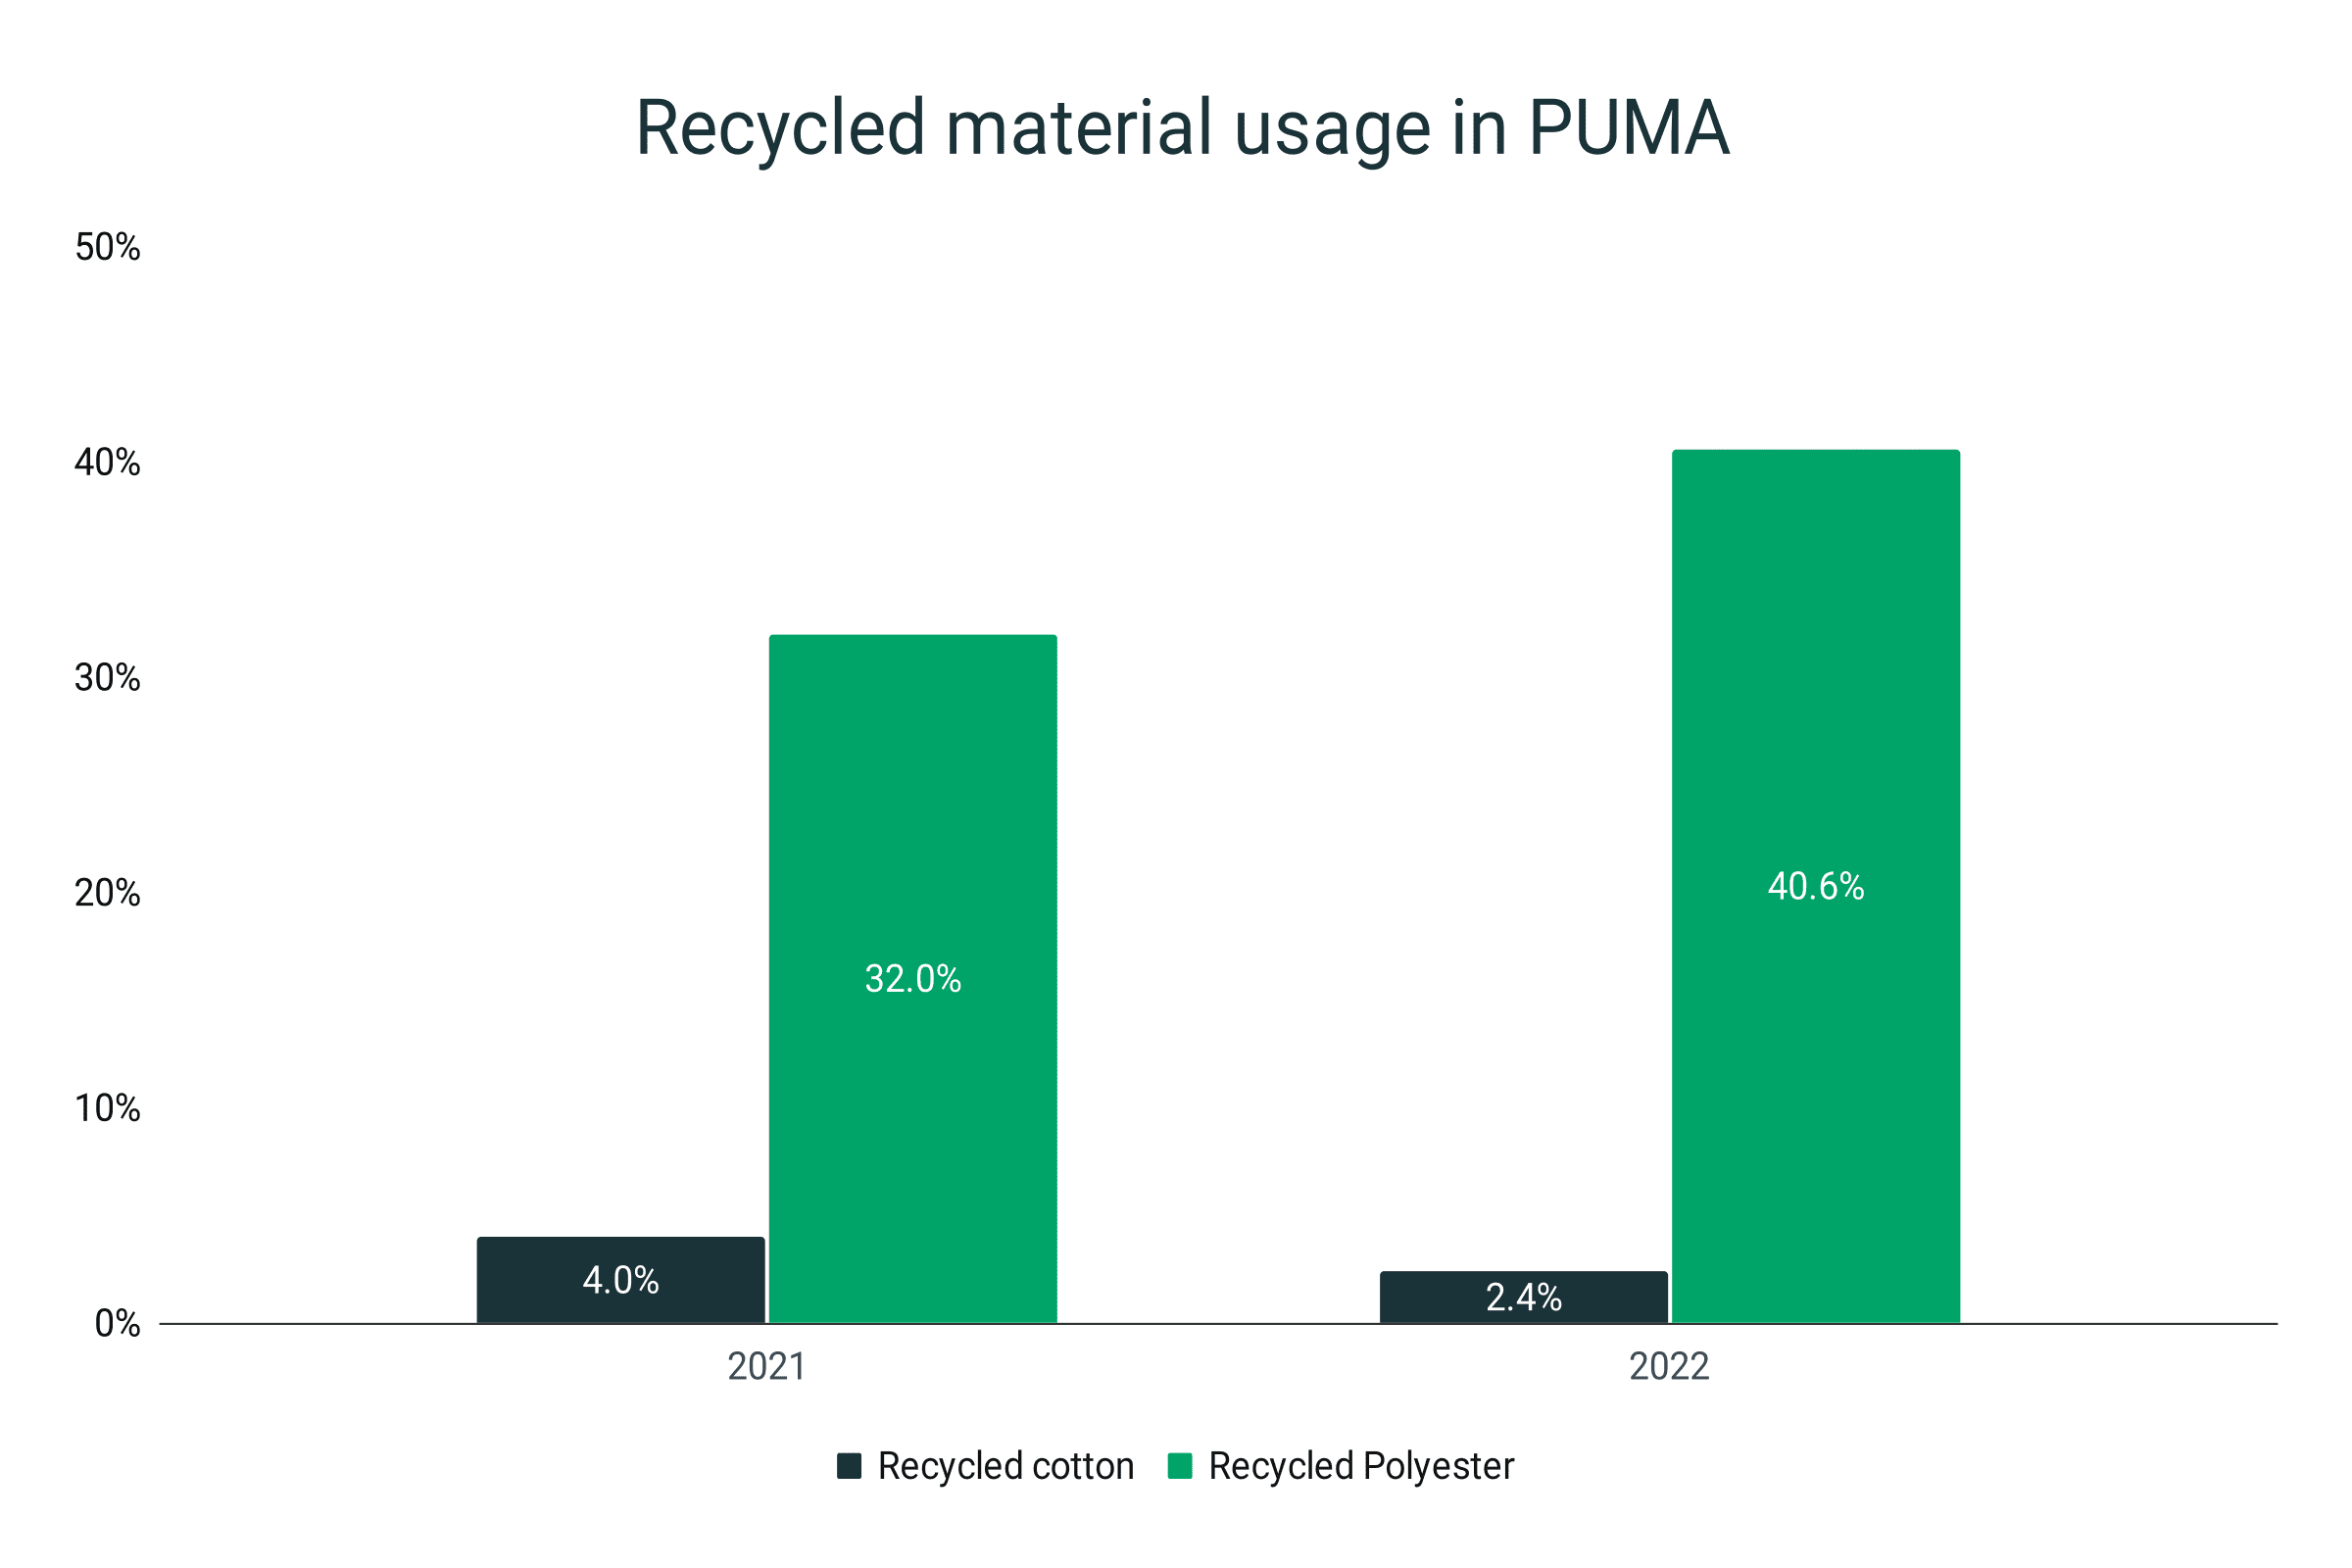
- The company uses 40.6% recycled polyester and 2.4% recycled cotton in its manufacturing process.
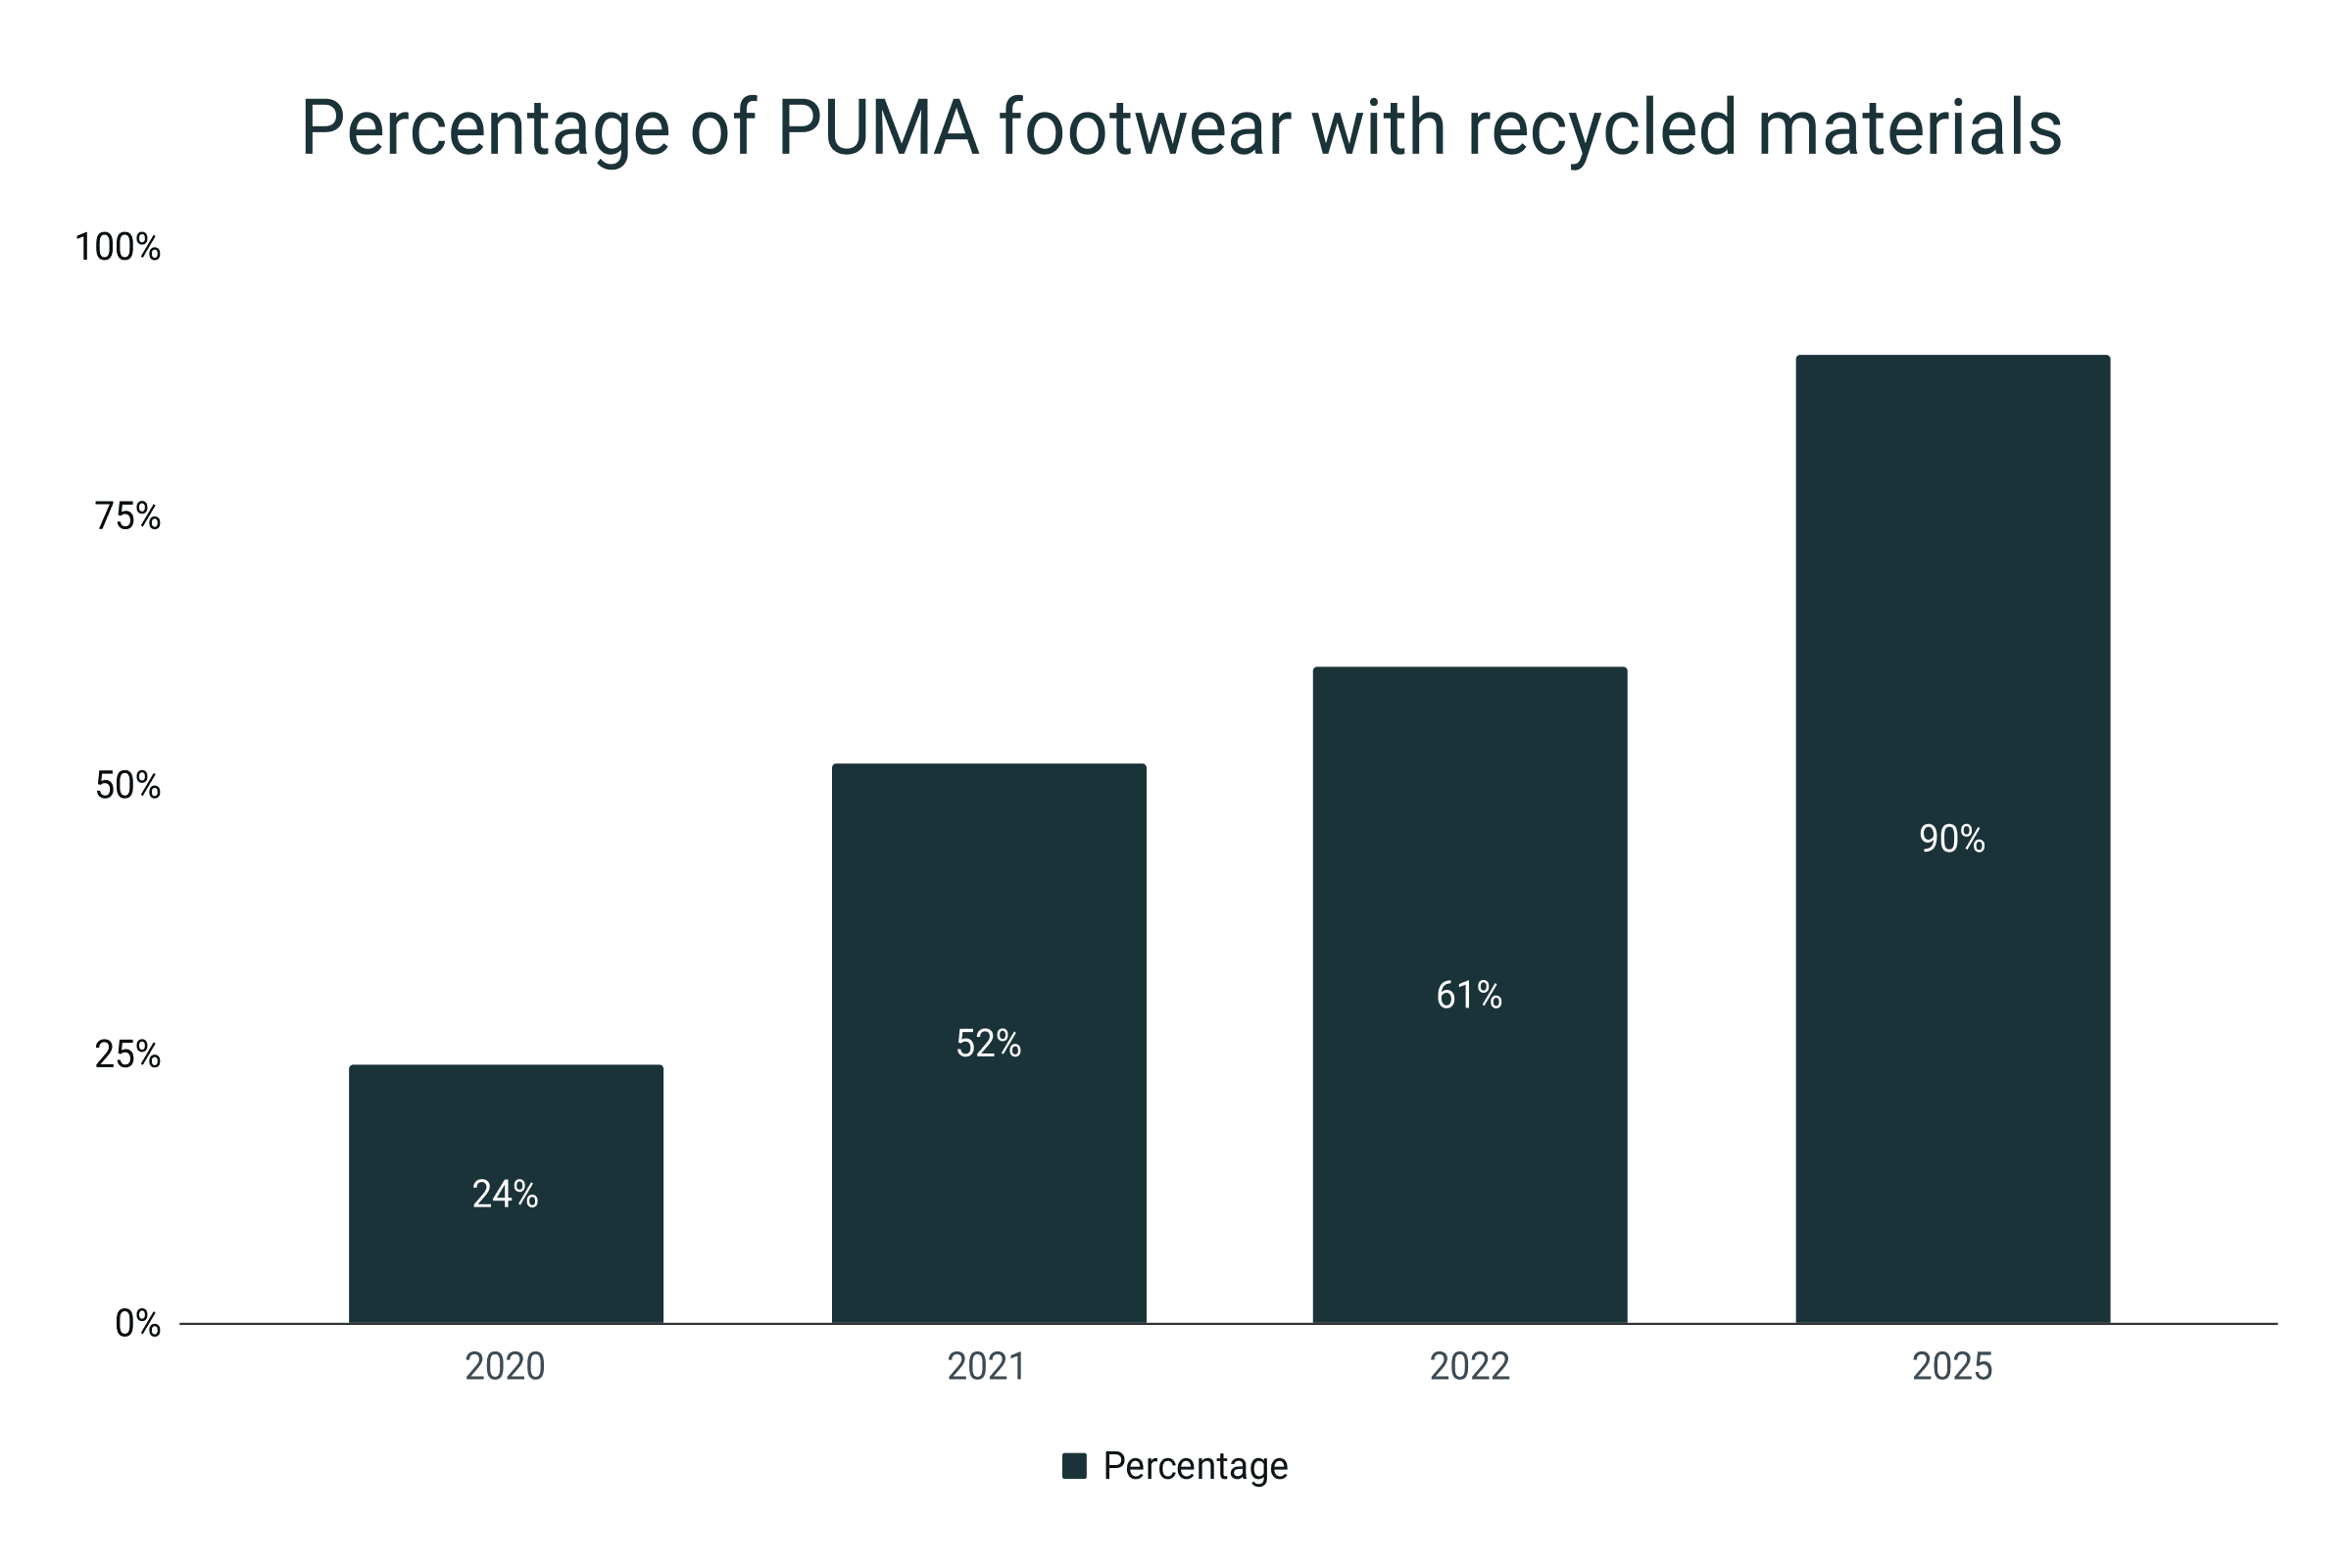
- 61% of the company’s shoes manufactured in 2022 used one or more sustainable components. The company’s target is to reach 90% by 2025.
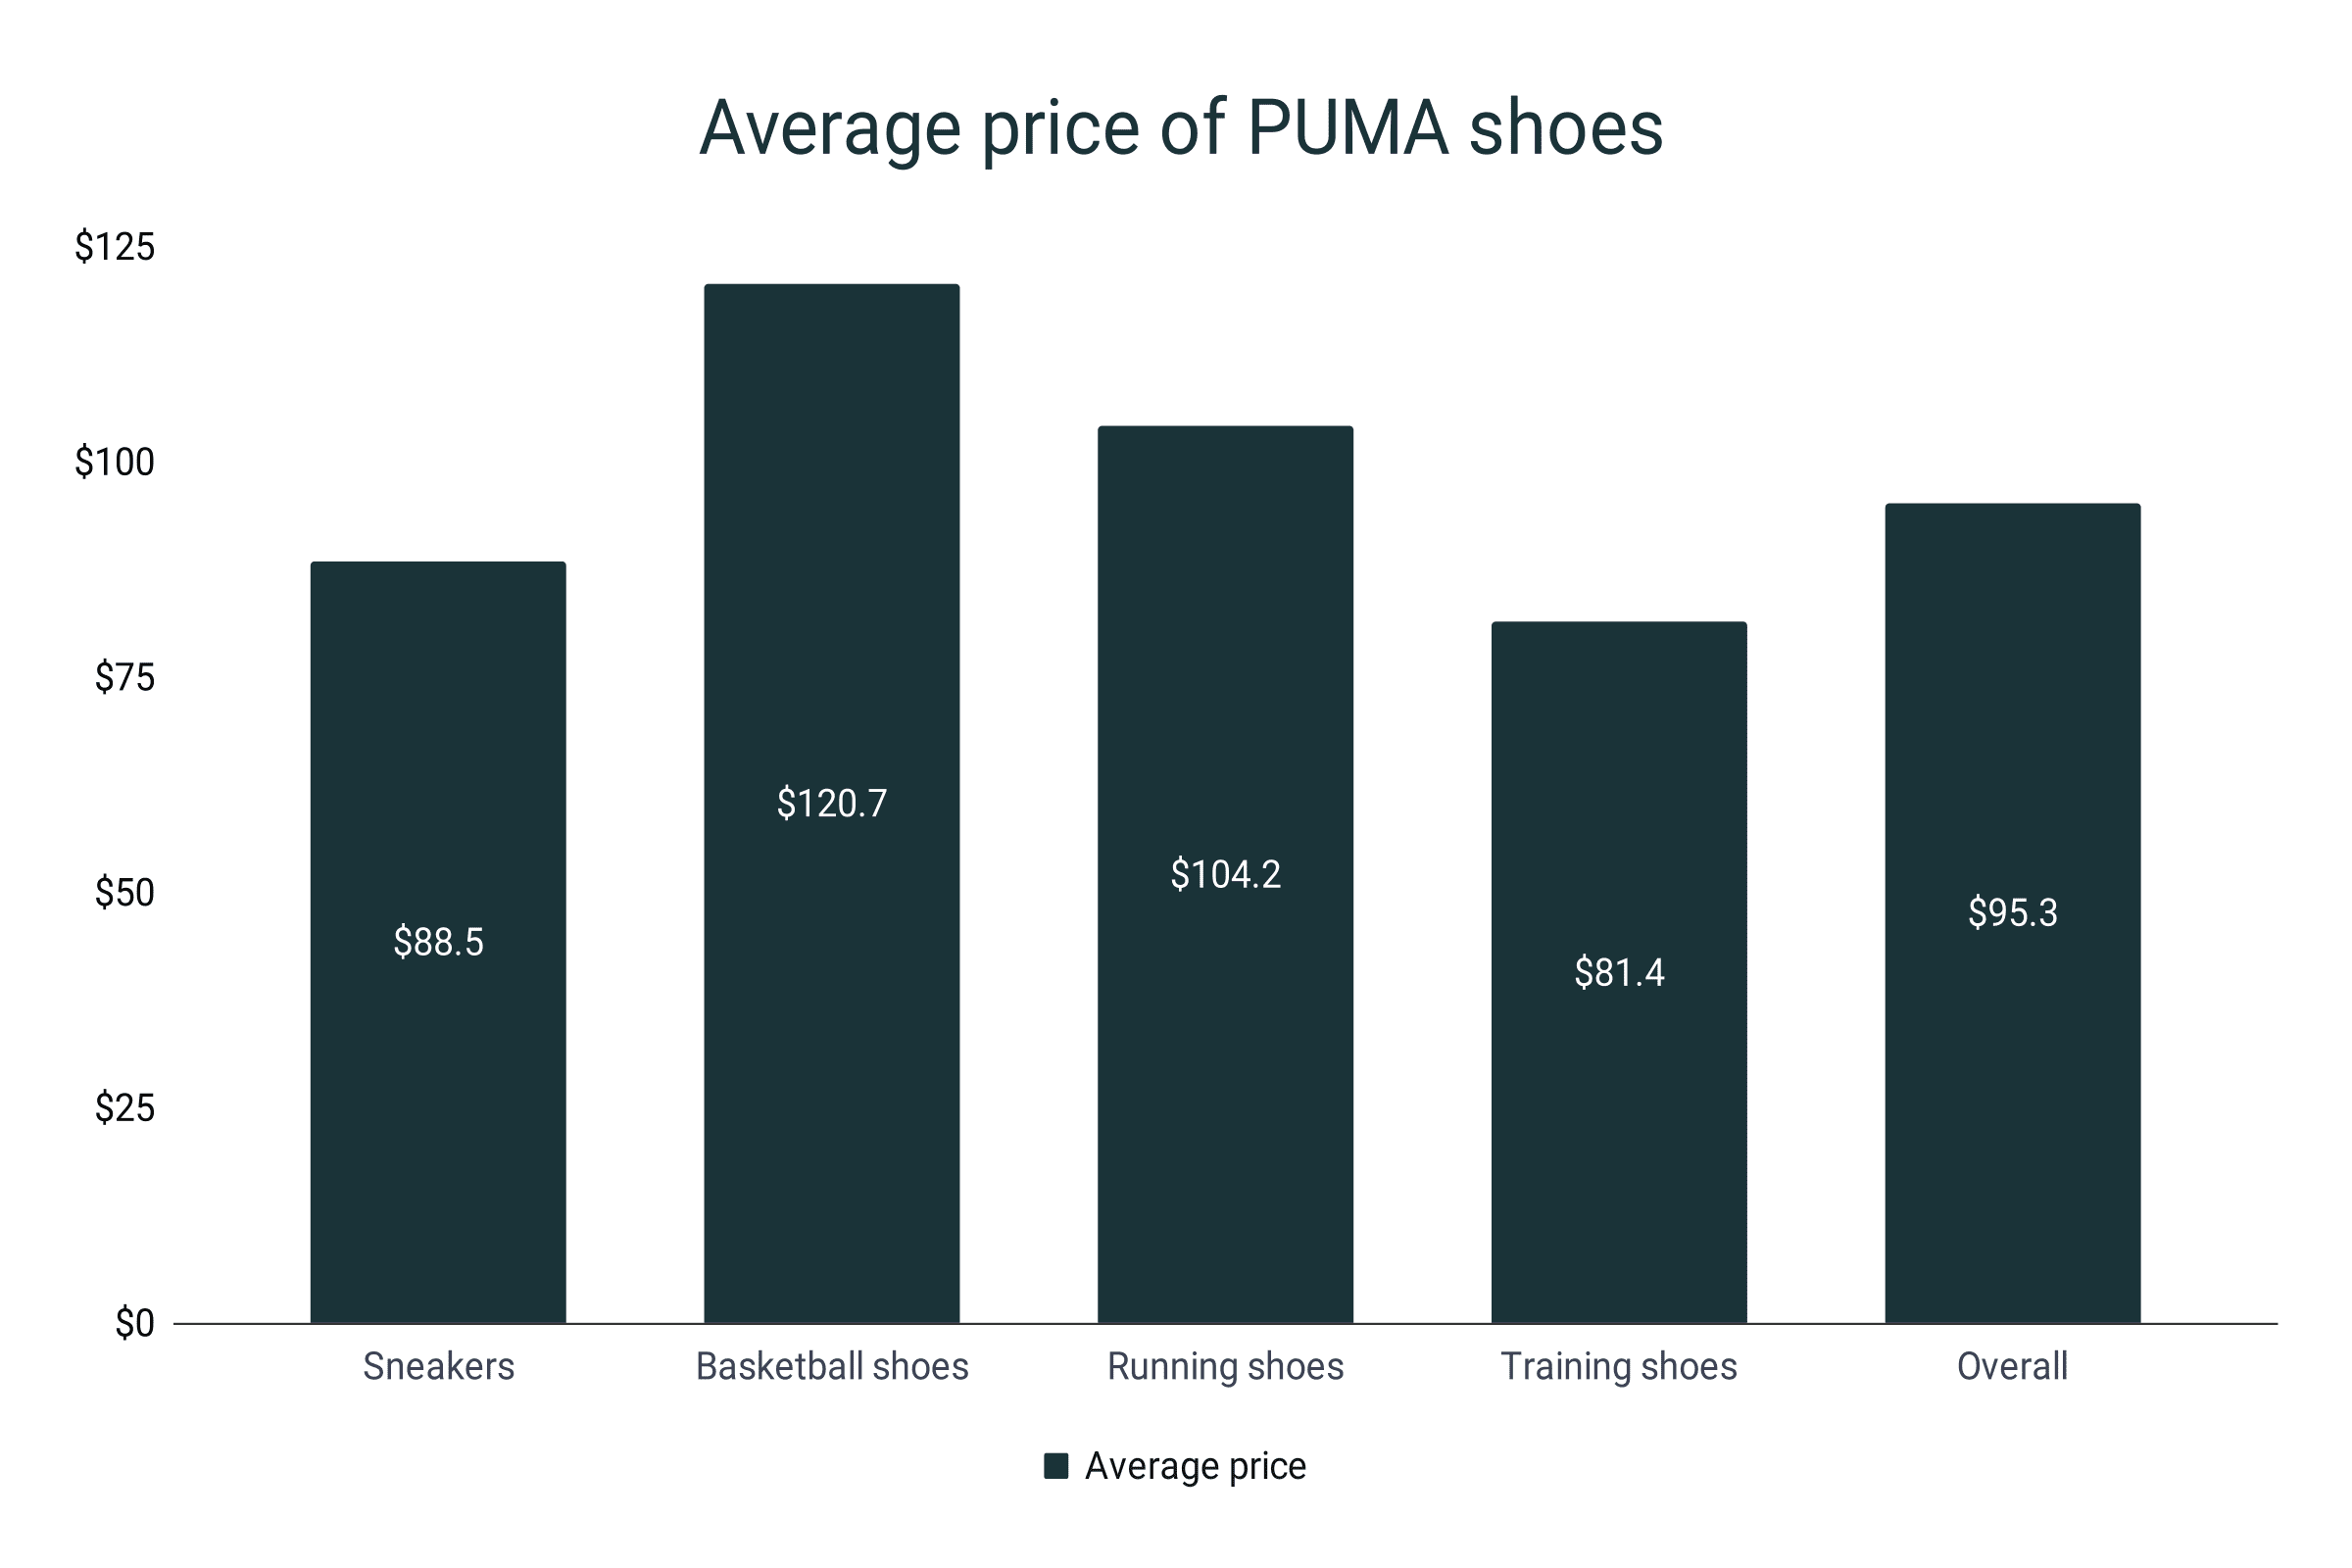
- The average price of a PUMA footwear product is $95.3.
- PUMA basketball shoes ($120.7) and training shoes ($81.4) are the most and least expensive in terms of mean prices.
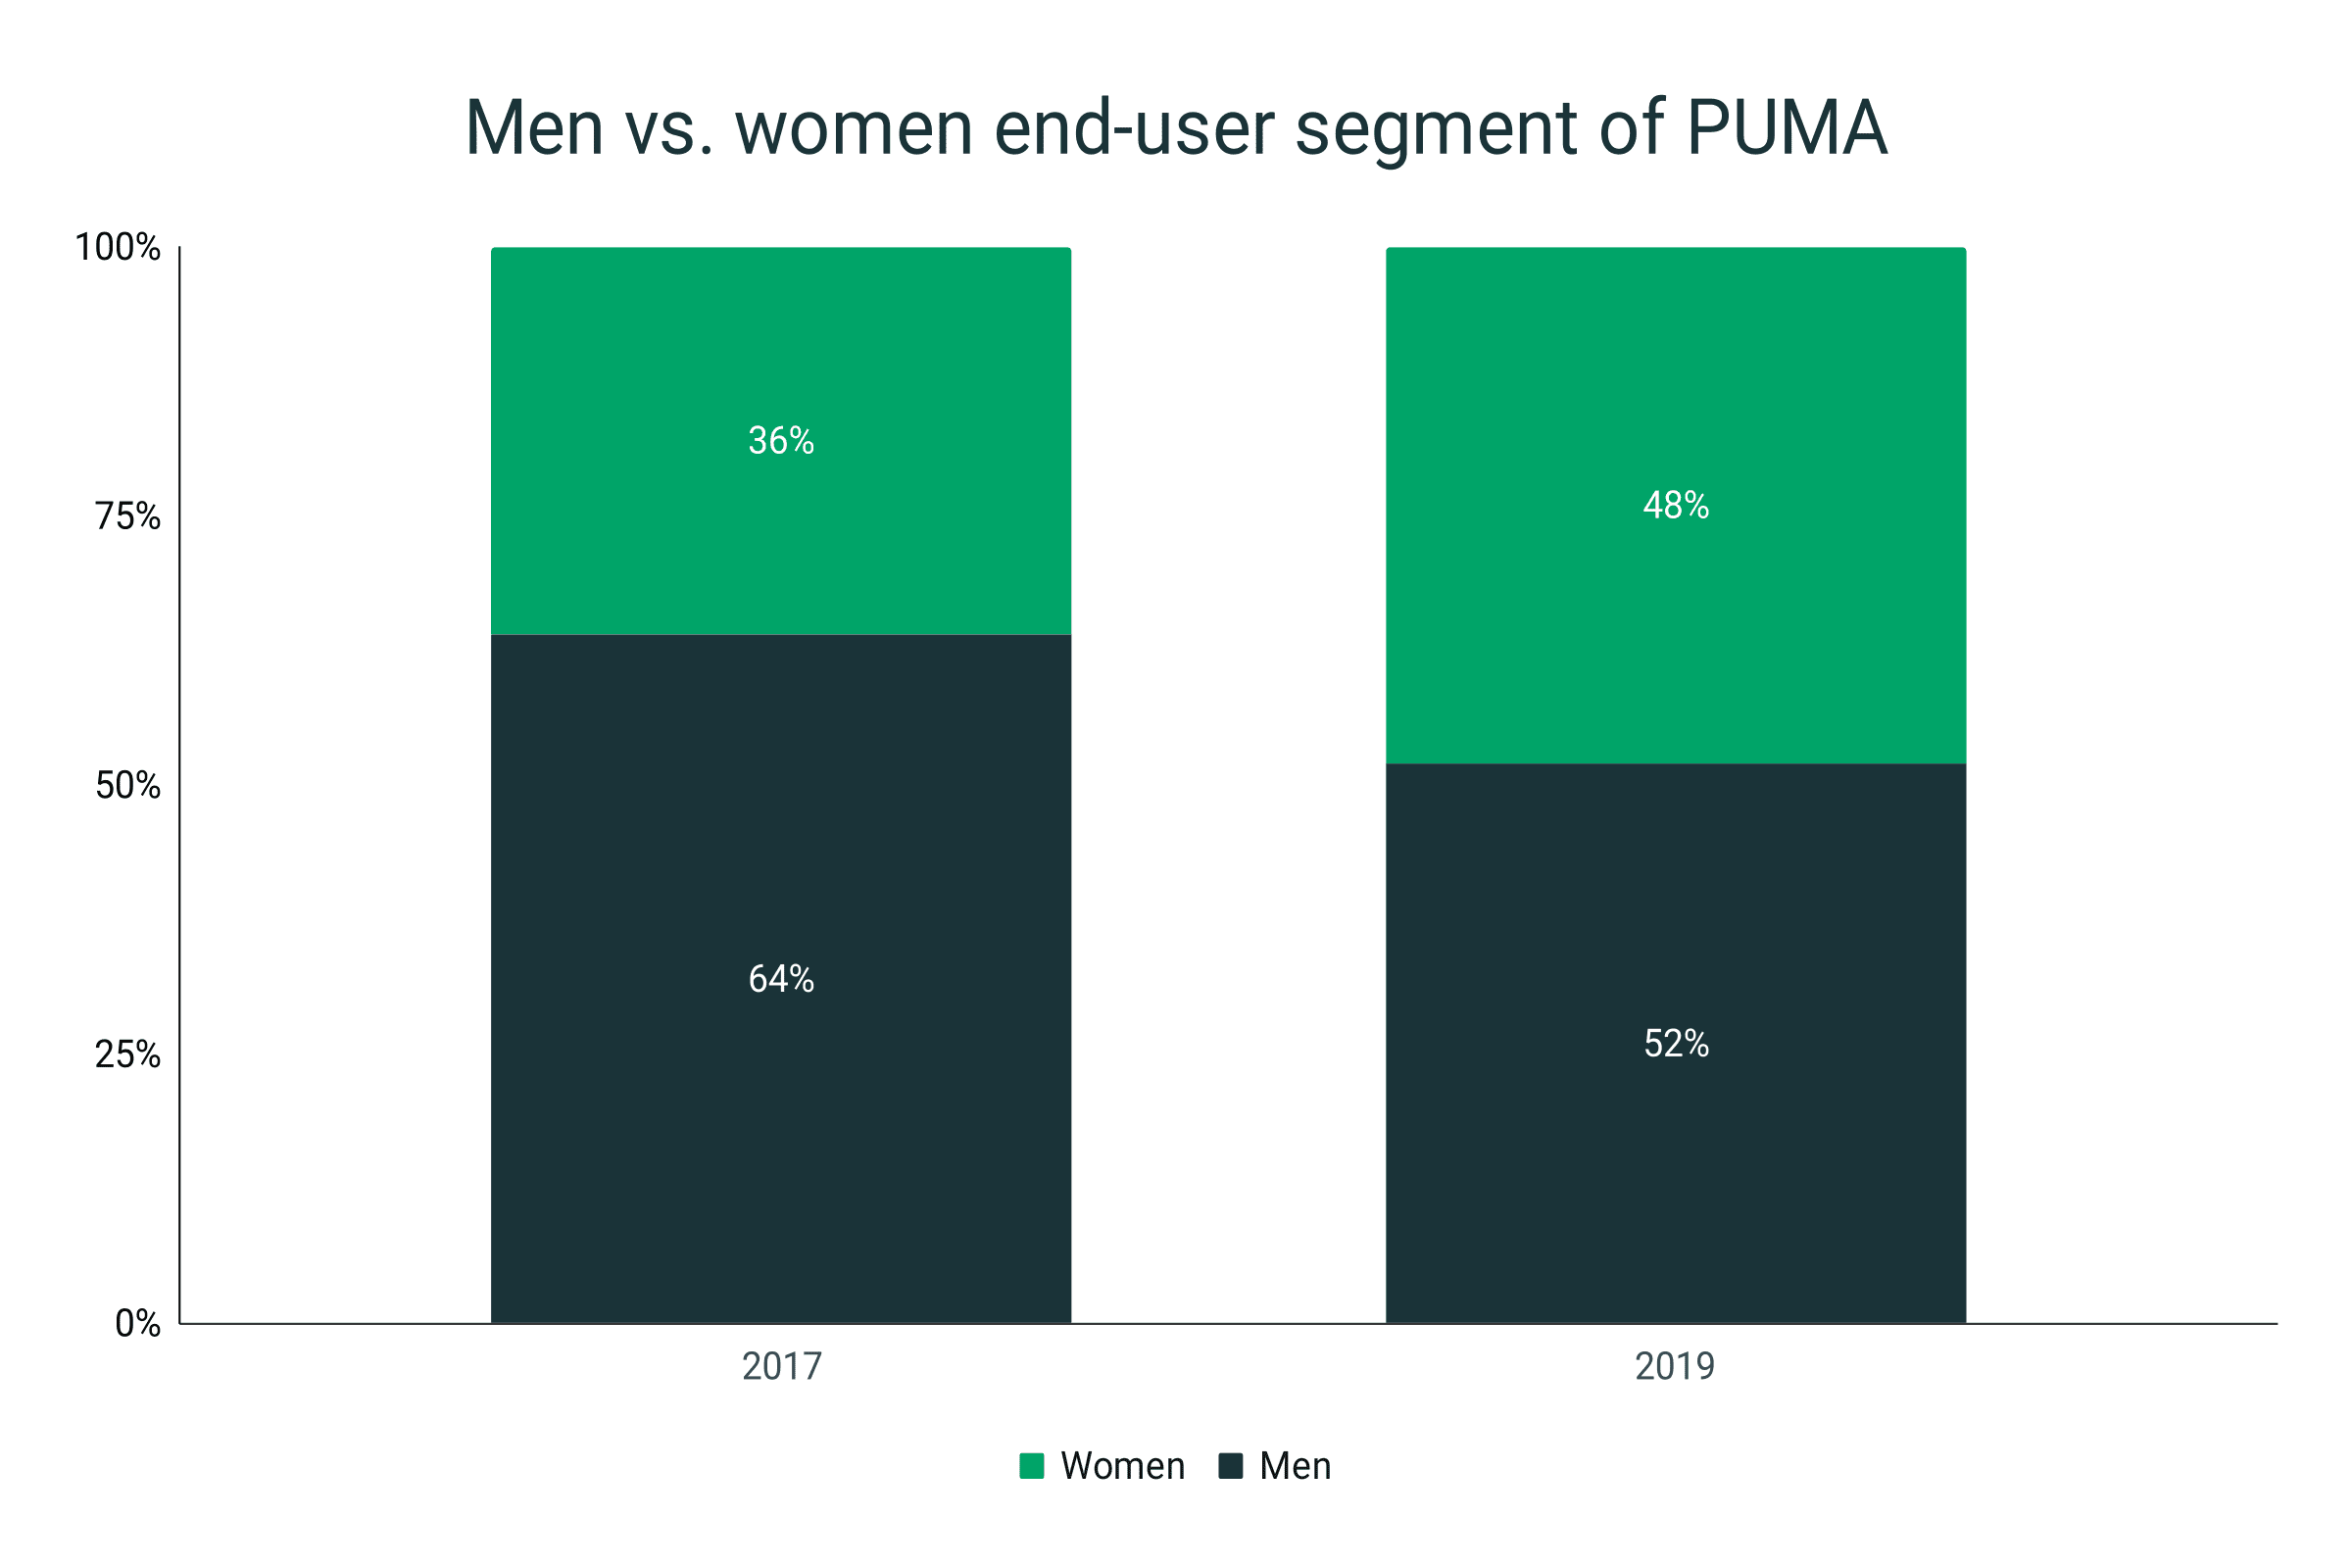
- In 2019, PUMA was able to expand their women's end-user segment to 48% compared to a 36% share in 2017.
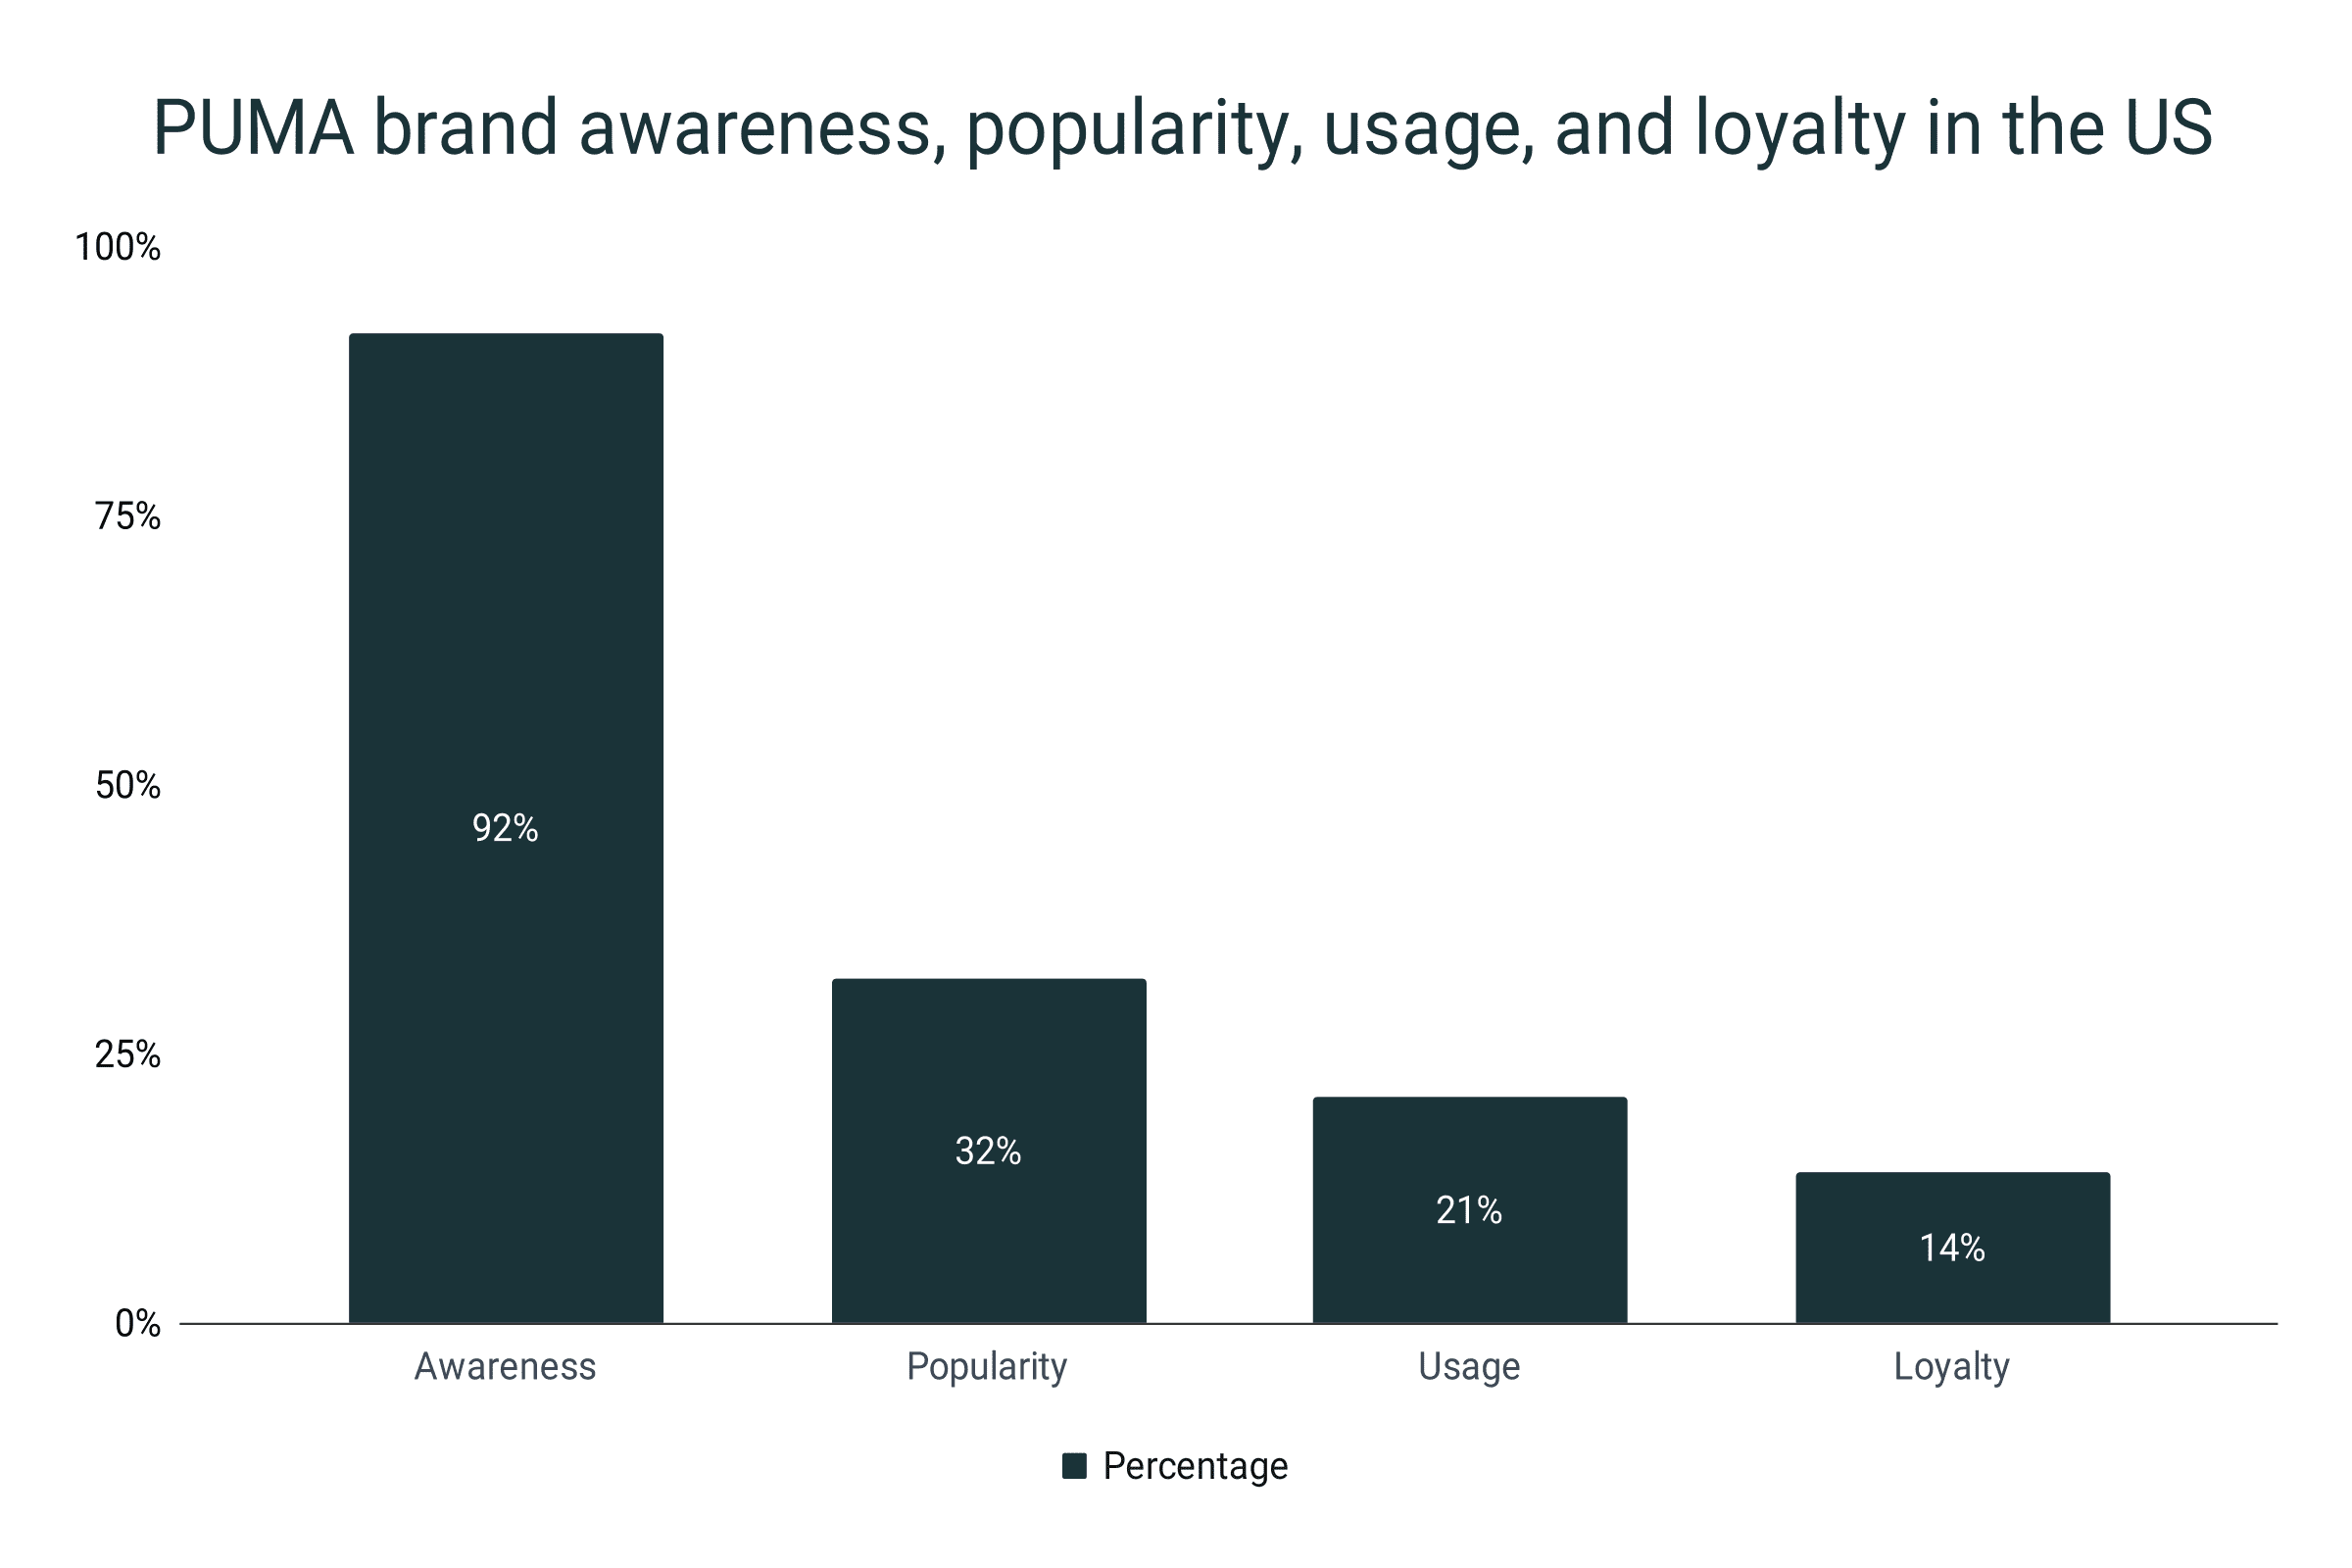
- About 21% of the American consumer population wears PUMA but only 14% are loyal to the brand.
PUMA shoe revenue
- PUMA closed the 2022 fiscal year with a strong $4.6 billion revenue in its footwear segment.
- The previous year, it scored $3.6 billion in revenues. The year-on-year growth is 28.8% from 2021 to 2022.
- Interestingly, PUMA was able to sustain its output despite the pandemic. From 2019 to 2020, the shoe brand generated $2.9 billion in revenues (plus: a 1.7% growth!).
- Since 2014, PUMA has seen an upward trajectory in its total shoe revenue. From $1.6 billion in 2014, it has ballooned by 187.5% in 2022.
- The greatest jump happened between 2016-17. From a $1.7 billion output, the shoe company pumped a $2.4 billion total, equivalent to a 40.9% increase.
- However, during the 2013 and 2014 fiscal years, PUMA’s shoe revenue experienced consecutive 10.9% and 17% losses, respectively.
- In 2010, the brand’s revenue from its footwear segment amounted to $1.9 billion. Thus, it experienced a whopping 142.1%
- This is equivalent to a compound annual growth rate of 7.6%.
- If the trend continues, PUMA will breach the $6 billion point by 2030.
PUMA annual footwear revenue
|
Year |
Revenue in billion dollars |
Growth |
|
2010 |
$1.9 |
|
|
2011 |
$2.0 |
5.3% |
|
2012 |
$2.1 |
6.0% |
|
2013 |
$1.9 |
-10.9% |
|
2014 |
$1.6 |
-17.0% |
|
2015 |
$1.7 |
5.8% |
|
2016 |
$1.7 |
3.6% |
|
2017 |
$2.4 |
40.9% |
|
2018 |
$2.5 |
3.7% |
|
2019 |
$2.9 |
14.4% |
|
2020 |
$2.9 |
1.7% |
|
2021 |
$3.6 |
23.0% |
|
2022 |
$4.6 |
28.8% |
|
2030* |
$6.2 |
34.8% |
*projected
PUMA shoe market share
- As of 2022, PUMA held a 1.2% portion of the global footwear market.
- It is higher compared to the 1.04% showing in 2021.
- For the past five years, PUMA has enjoyed an increase in its global shoe market presence. From 0.63% in 2018, it has almost doubled its market share in 2022.
PUMA global shoe market share
|
Year |
Global footwear market share |
|
2018 |
0.63% |
|
2019 |
0.73% |
|
2020 |
0.85% |
|
2021 |
1.04% |
|
2022 |
1.20% |
- In the sneaker department, PUMA is one of the top market players with a 5.1% share.
- PUMA sports shoes also hold about 2.1% of the global athletic footwear market.
- The shoe brand also scored a 2% share in the running shoe market.
- Meanwhile, for the American football shoes, PUMA holds a 7% portion.
- Additionally, 10.9% of athletes are wearing the shoe brand’s American football cleats.
- In the United States, PUMA took a 4% portion of the athletic shoe market.
- Back in 2002, the brand’s market share was only 1.5%.
- Meaning, PUMA was able to widen its presence by 166.7% in two decades.
- The growth in the American footwear market is attributed to the expansion efforts of the German company to the United States. In 2021, they opened their 150,000-square-foot North American headquarters located at Assembly Row in Somerville, Massachusetts.
PUMA athletic shoe market share in the US
|
Year |
Percent share |
|
2002 |
1.5% |
|
2022 |
4% |
PUMA basketball shoe statistics
- PUMA’s basketball shoe sales took up about 27% of the brand’s entire footwear sales.
- Consequently, PUMA is the fourth biggest player in the National Basketball Association (NBA). Over the past five seasons, PUMA has averaged a 3.4% share.
- The company enjoyed a 3.3% share in the 2022-23 NBA season.
- The year prior, in 2021, PUMA registered its highest showing with a 4.3% portion of all NBA players.
- In the 2018-19 season, the brand’s share was at 2.1%. Compared to the brand’s current performance, its NBA presence enjoyed a 57.1% increase.
- PUMA Clyde All-Pro and Clyde Hardwood are two of the most popular choices among players. The All-Pro was worn by 10 players during the 2020-21 season. On the other hand, Hardwood was sported by 12 players during the 2019-20 NBA season.
Presence of PUMA basketball shoes in the NBA
|
Season |
Percent share |
|
2018-19 |
2.1% |
|
2019-20 |
3.3% |
|
2020-21 |
4.1% |
|
2021-22 |
4.3% |
|
2022-23 |
3.3% |
|
Ave. (2018-2023) |
3.4% |
PUMA shoe production
- PUMA reportedly produces 100,000 pairs of shoes per day.
- That is equivalent to more than 35 million pairs in a year.
- On average, a PUMA shoe weighs 8.3 oz (235.3g).
- According to PUMA, nearly 50% of its golf shoes are manufactured in China and Vietnam.
- Additionally, about 5.5% of all PUMA shoes in the USA are imported from Vietnam.
- However, in terms of raw materials, the United States is the primary source of leather for PUMA. The company sourced 44% of its leather from the country in 2022.
- In 2021, 47% was from the US.
- Argentina is the second main source of leather with 24.4% in 2022 and 15% in 2021.
- The third biggest supplier of leather is Australia with 7.4% and 15% in 2022 and 2021, respectively.
Sources of leather for PUMA shoes
|
Year |
United States |
Argentina |
Australia |
Others |
|
2021 |
47% |
15% |
15% |
23% |
|
2022 |
44% |
24.4% |
7.4% |
24.2% |
PUMA shoe sustainability
- 61% of PUMA footwear in 2022 was manufactured with a sustainable and/or recycled component.
- This is a significant increase from the 52% figure in 2021.
- In 2020, only 24% of the shoes produced by PUMA have sustainable materials.
- The company targets that by 2025, at least 90% of its footwear products will be manufactured with sustainable and recycled materials.
Percentage of PUMA footwear with recycled materials
|
Year |
Percentage |
|
2020 |
24% |
|
2021 |
52% |
|
2022 |
61% |
|
2025* |
90% |
*Company target
- As of 2022, PUMA was able to increase its utilisation of recycled polyester to 40.6%. Previously, it marked a 32% usage in 2021.
- For recycled cotton, however, the company dropped to a 2.4% utilisation.
- In 2021, the shoe brand used recycled cotton for 4% of its products.
- The drop is attributed to the company’s switching back to conventional cotton in 2022. It accounted for 93.7% of the cotton the company used.
Recycled material usage in PUMA
|
2021 |
2022 |
|
|
Recycled cotton |
4% |
2.4% |
|
Recycled Polyester |
32% |
40.6% |
- PUMA targets to use 100% certified recycled cardboard on its packaging by 2025.
- As of 2021, the company was able to reach 88% utilisation.
- Additionally, PUMA reported that it sourced 99.9% of its leather from LWG-certified tanners.
- The company also achieved 100% reliance on RDS-certified down feathers in 2020.
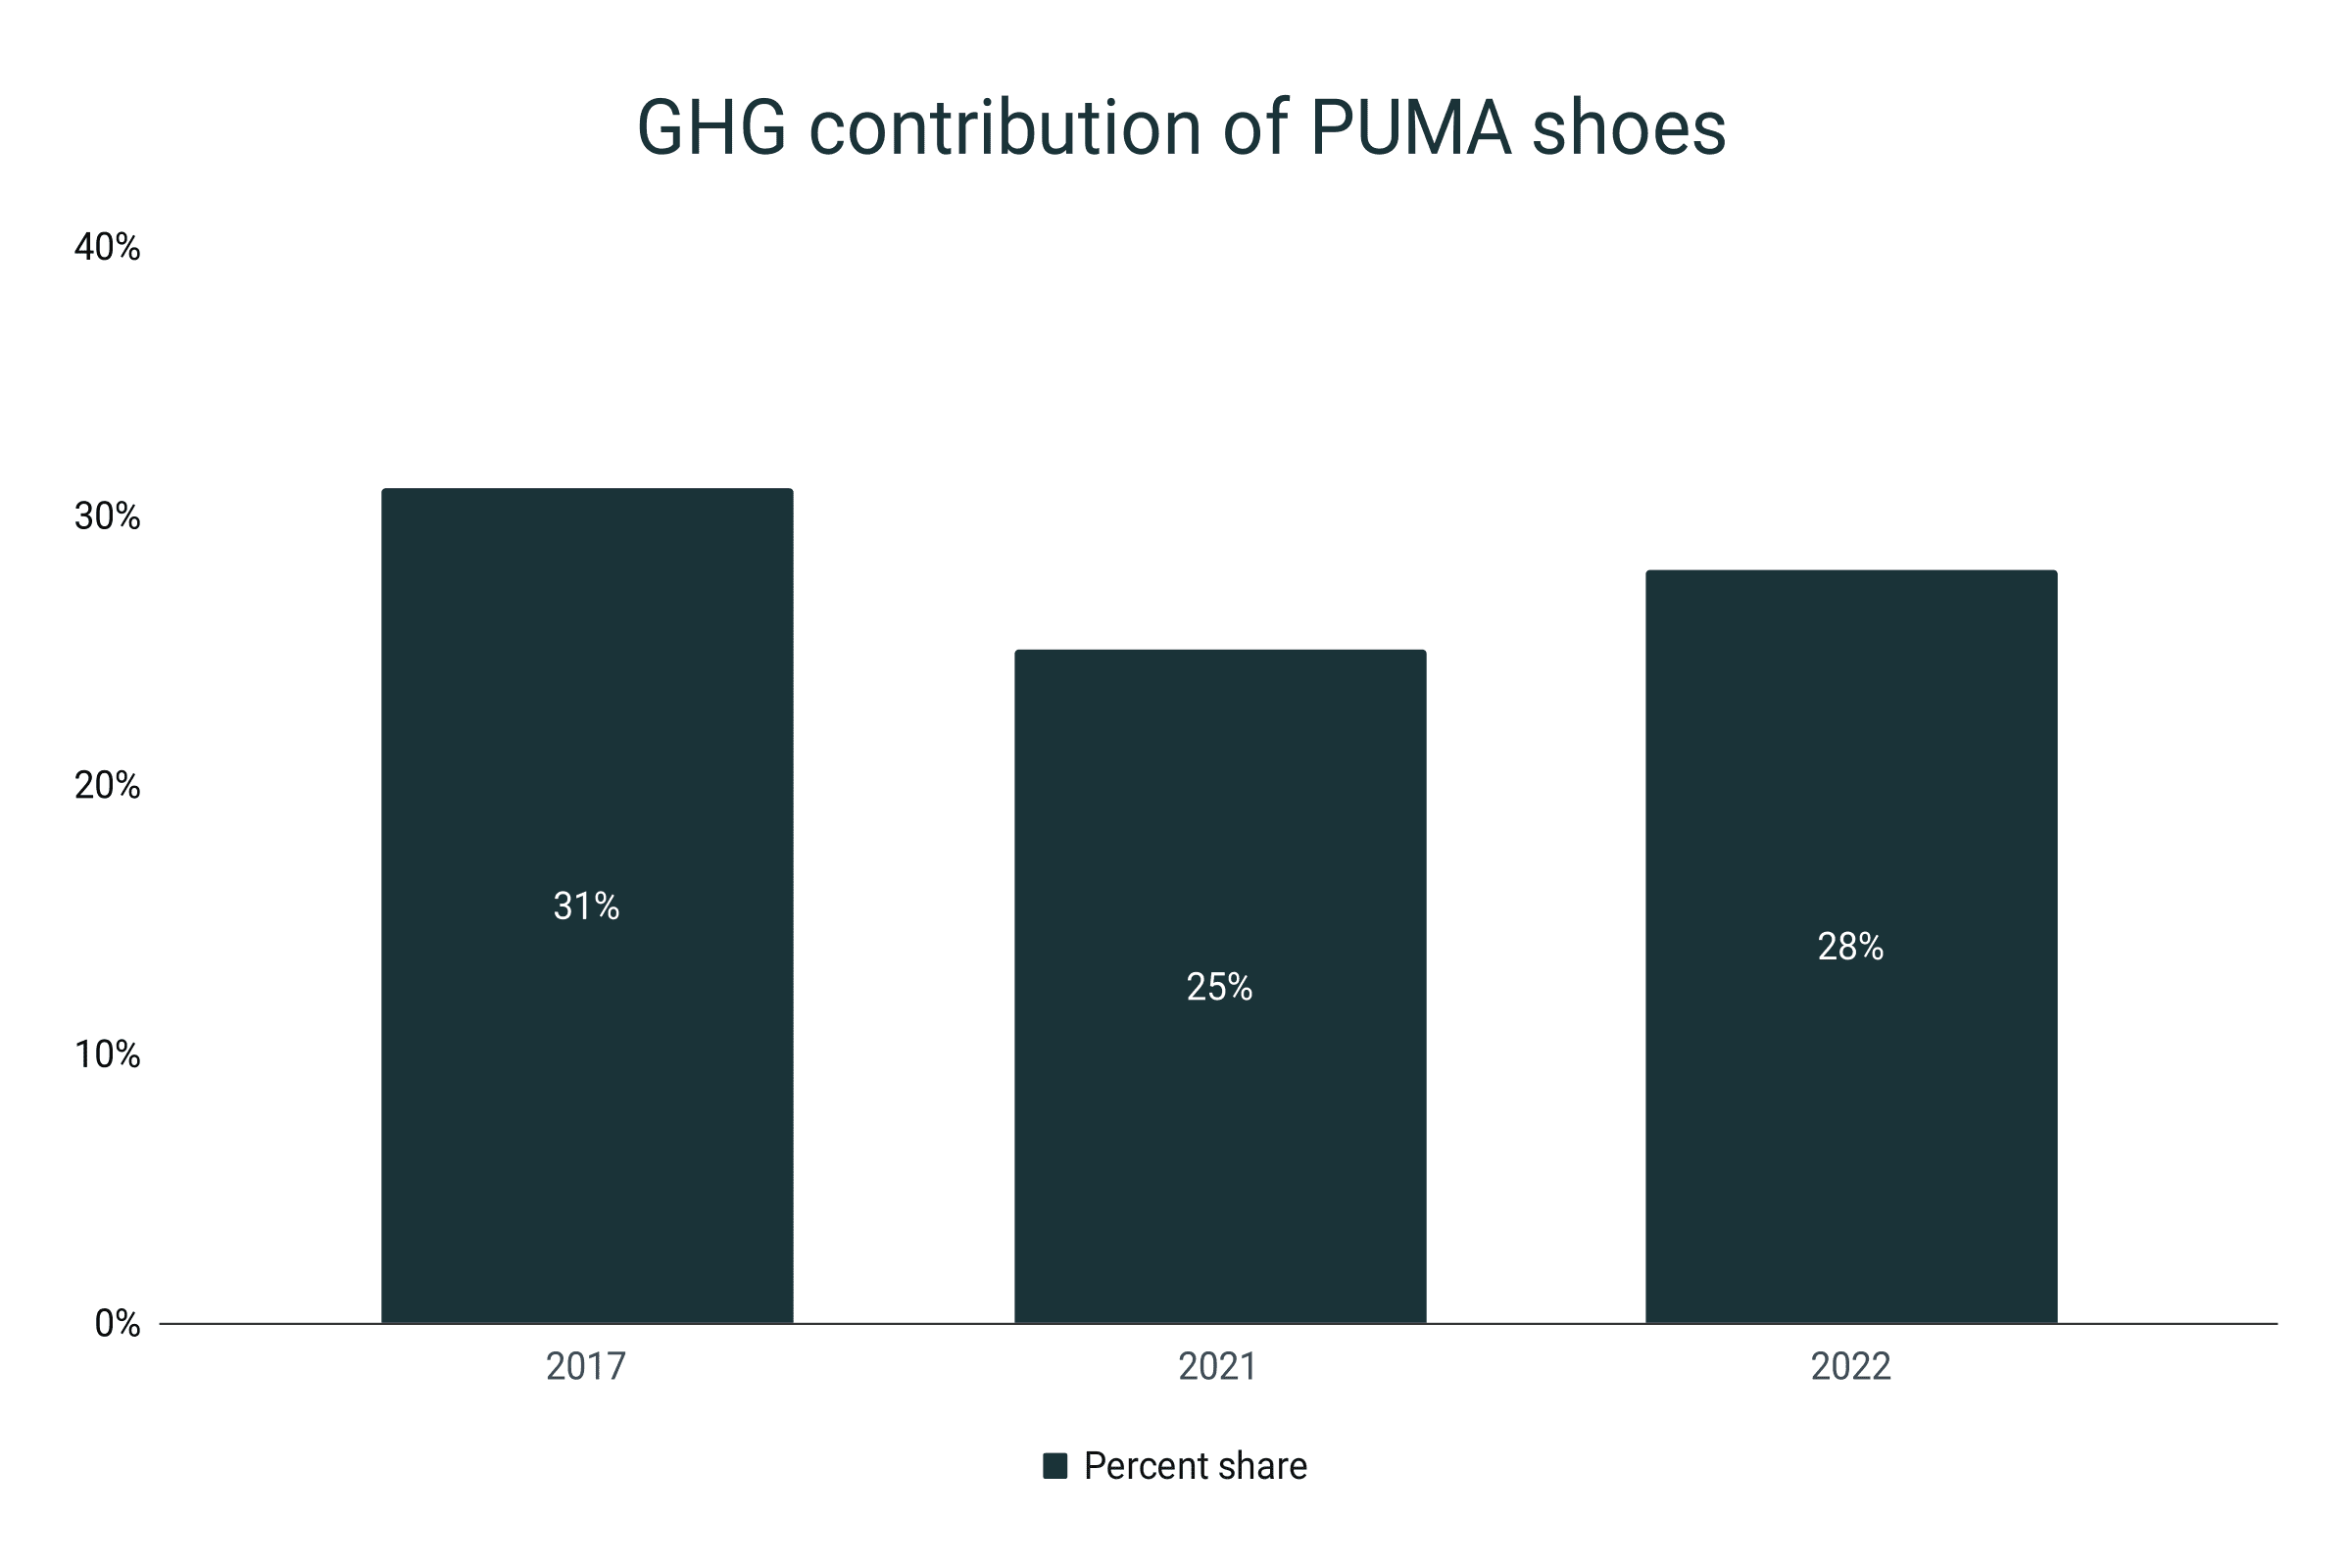
- In terms of greenhouse gas (GHG) contribution, PUMA recorded that 28% of its emissions are from manufacturing shoes.
- The percent share of the footwear department in the GHG output is about 25%.
- Way back in 2017, 31% of PUMA’s GGHG emissions were due to its footwear segment.
Greenhouse gas contribution (GHG) of PUMA shoes
|
Year |
Percent share |
|
2017 |
31% |
|
2021 |
25% |
|
2022 |
28% |
Average PUMA shoe prices in 2023
- Based on the RunRepeat database, the average price of all PUMA footwear products is $95.3.
- Basketball shoes are some of the most expensive PUMA products. They cost about $120.7 a pair.
- The mean price of a PUMA running shoe, on the other hand, is $104.2.
- Below the average line are the trainers and training shoes with price tags of $88.5 and $81.4, respectively.
- Meaning, a PUMA basketball shoe is 26.7% more expensive than the average PUMA shoe.
- Moreover, their training shoes are 14.6% more affordable than the average PUMA kicks.
Average price of PUMA shoes
|
Type |
Average price |
|
Trainers |
$88.5 |
|
Basketball shoes |
$120.7 |
|
Running shoes |
$104.2 |
|
Training shoes |
$81.4 |
|
Overall |
$95.3 |
PUMA shoes’ popularity among consumers
- In 2019, PUMA was able to increase its women user share to 48%.
- Two years ago, the women's market share in PUMA was only 36%.
- Thus, PUMA was able to pump its women end-user segment by 33.3% in just two years.
- Consequently, the men’s end-user segment of the company is still dominant at 64% and 52% for 2017 and 2019, respectively.
Men vs. women end-user segment of PUMA
|
Gender |
2017 |
2019 |
|
Men |
64% |
52% |
|
Women |
36% |
48% |
- Data from 2022 reported that PUMA enjoyed a 92% brand awareness among US shoppers
- In popularity, however, the shoe company fared at 32%.
- 21% of the American population uses PUMA footwear products.
- About 14% are loyal to the brand.
PUMA shoe brand awareness, popularity, usage, and loyalty in the US
|
Parameter |
Percentage |
|
Awareness |
92% |
|
Popularity |
32% |
|
Usage |
21% |
|
Loyalty |
14% |
Sources
https://about.puma.com/en/investor-relations/financial-reports
https://bashabearsbasketball.com/what-percent-of-puma-footwear-sales-are-basketball-shoes/
https://www.slideserve.com/armand-dyer/puma-commercial
https://ivypanda.com/essays/planning-an-integrated-marketing-communications-campaign/
https://www.openpr.com/news/2522197/global-footwear-market-emerging-trends-major-key-players
https://rubbersoles.wordpress.com/tag/market-share/
https://www.nbcnews.com/id/wbna11026473
https://lebasic.com/wp-content/uploads/2016/06/BASIC-ESE_Foul-PLay-Report_2016_Final-1.pdf
https://www.statista.com/statistics/278834/revenue-nike-adidas-puma-footwear-segment/
https://priceonomics.com/how-much-do-shoes-cost-for-men-vs-women/
https://medium.com/@ScrapeHero/most-popular-shoe-brands-on-amazon-94e3c49252ba
