On Shoes Statistics
At the height of the pandemic, the Swiss footwear giant On expanded to over 6,000 retail stores worldwide. This report is a compilation of relevant and up-to-date facts, figures, and future projections detailing the company’s humble beginnings and its rise to becoming a global phenomenon.
Top On shoe statistics
- On has breached the $1 billion mark in 2022. The company’s shoe sales tallied a total of $1.31 billion by the end of the year.
- For three consecutive years, the shoe company experienced positive growth. In 2022, On shoe net sales registered a 70.9% year-on-year growth, making the company one of the fastest-growing footwear brands.
- The footwear segment of On contributed 95.5% of the company’s total sales in 2022.
- The shoe brand started the 2023 fiscal year with $448.6 million and $479.6 million in sales during the 1st and 2nd quarters.
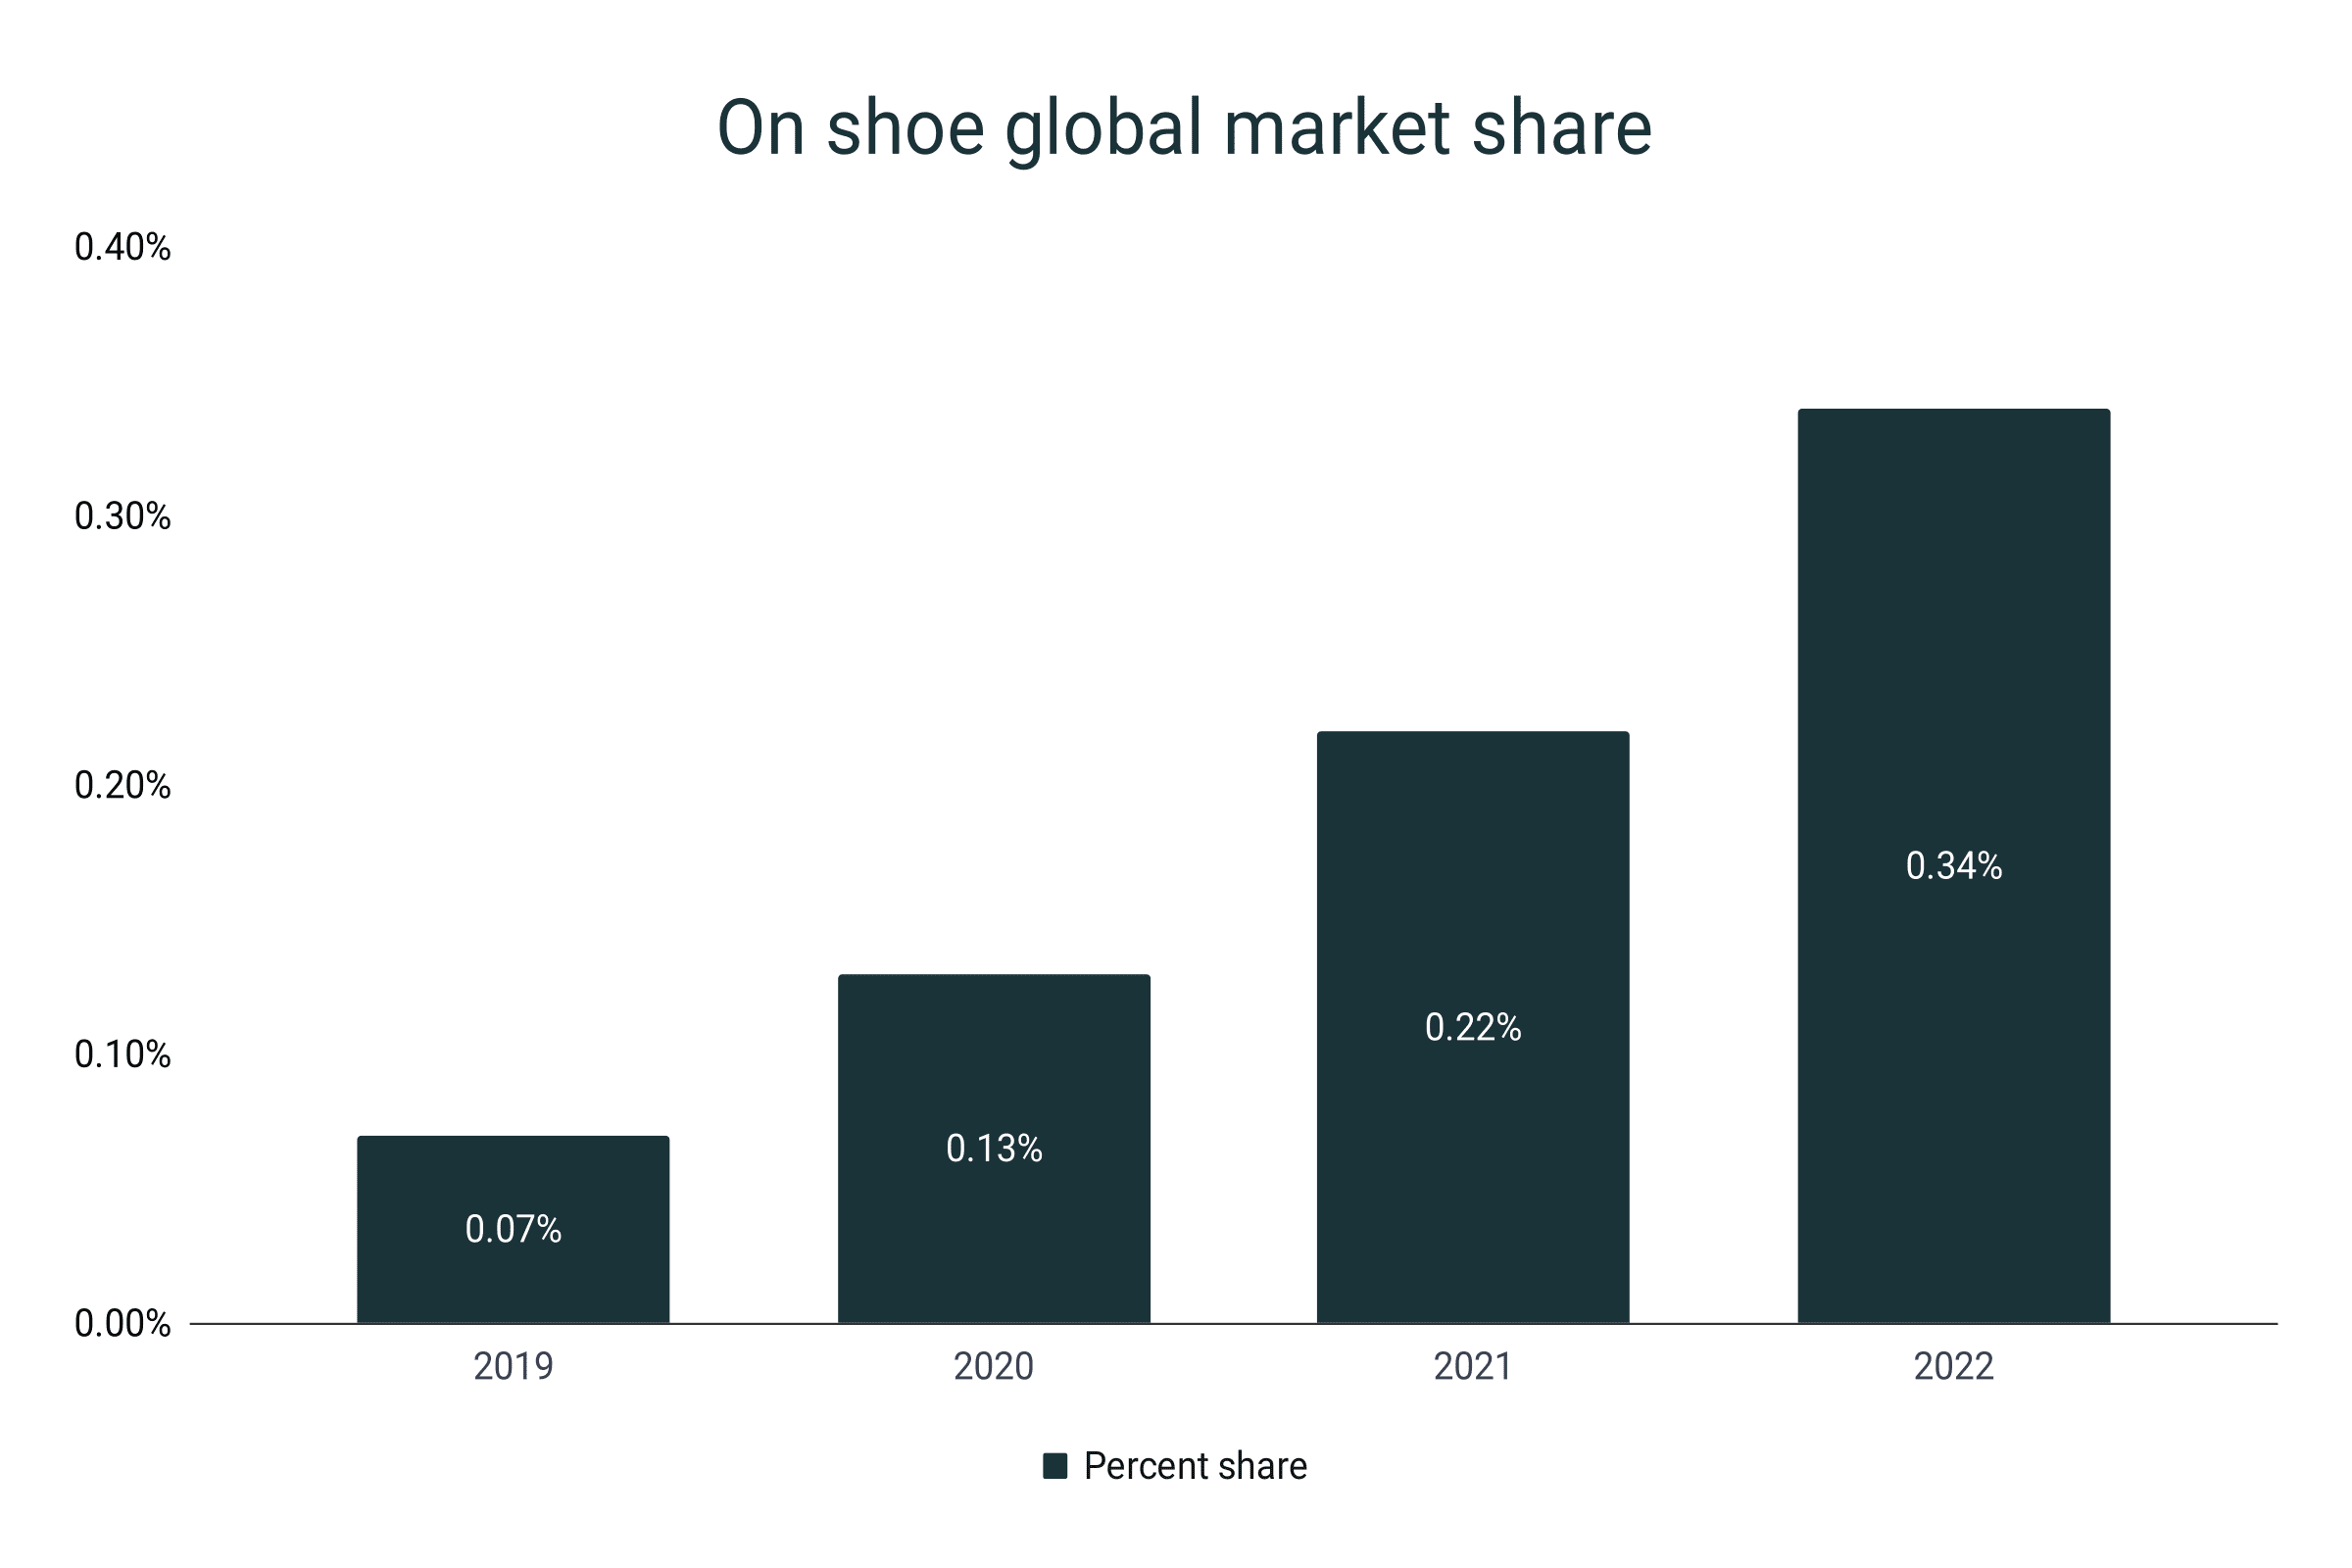
- By the end of 2022, On established a 0.34% global market share.
- In the United States, On snagged an 8% footwear market share by the end of 2021.
- The average price of a pair of On shoes is $165.2 while the shoe prices range from $130 to $270.
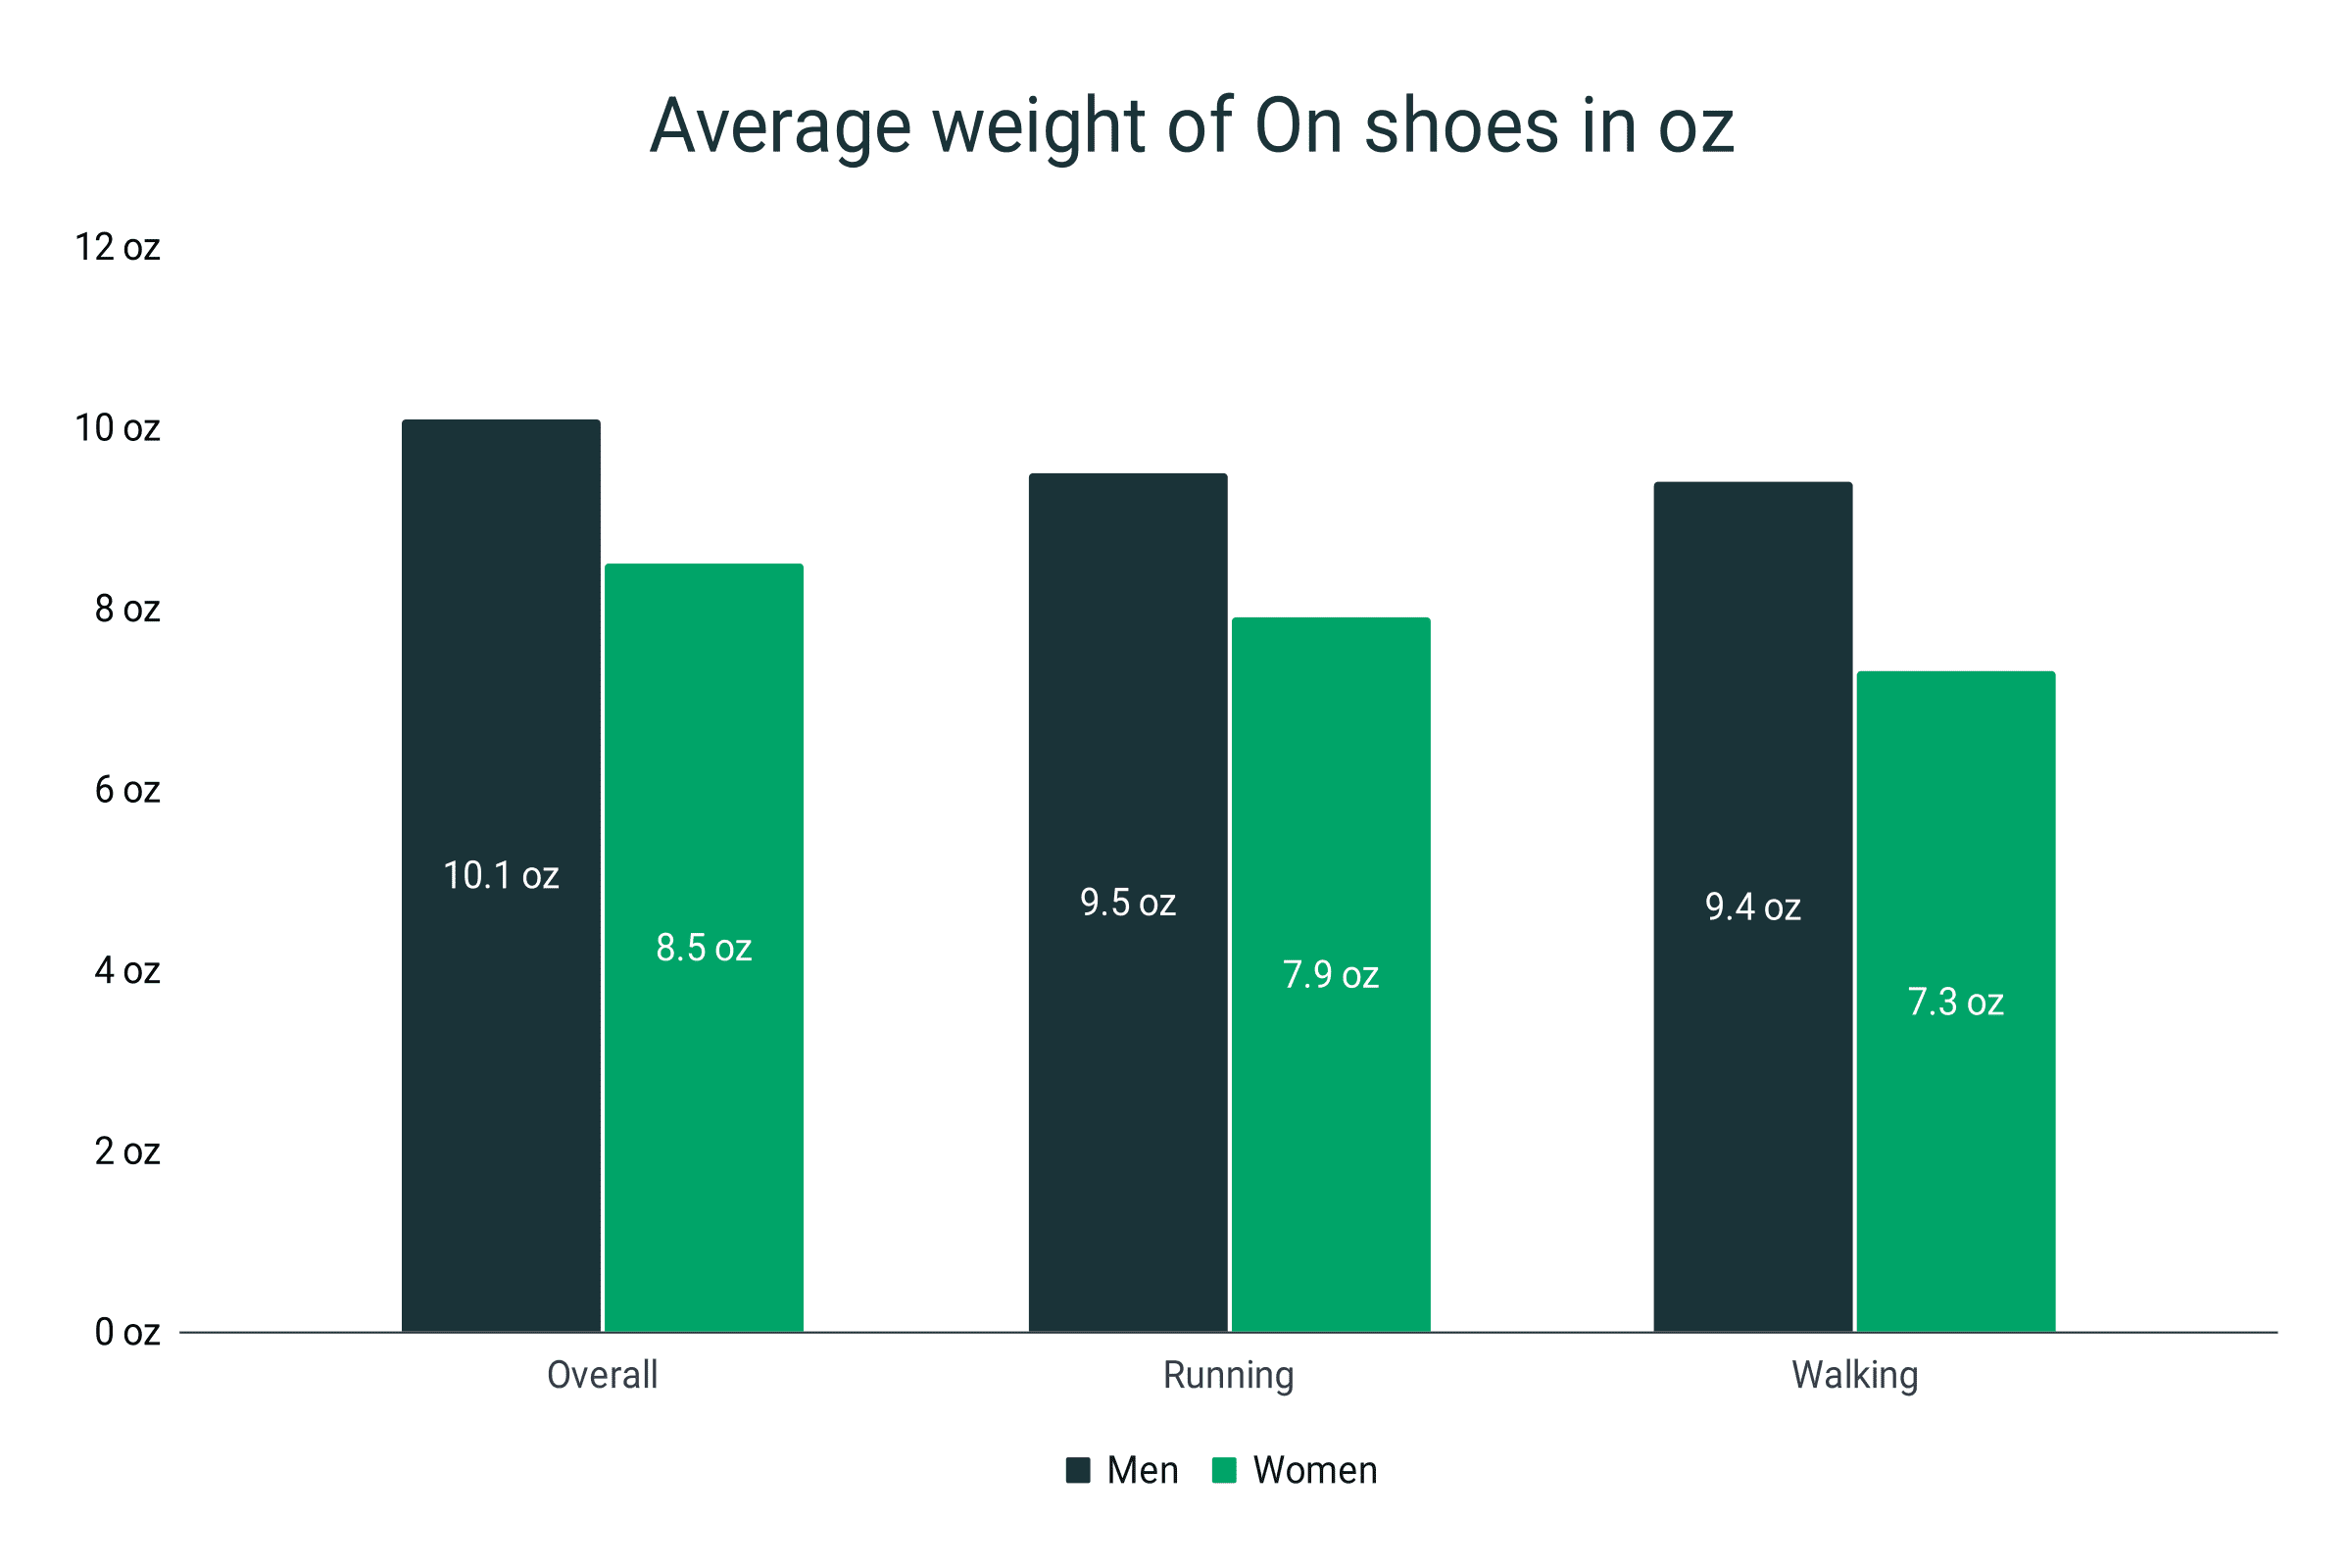
- The average weight of a for-men On shoe is 10.1 oz or 287.6g while for women, a pair weighs 8.5 oz (240.6g).
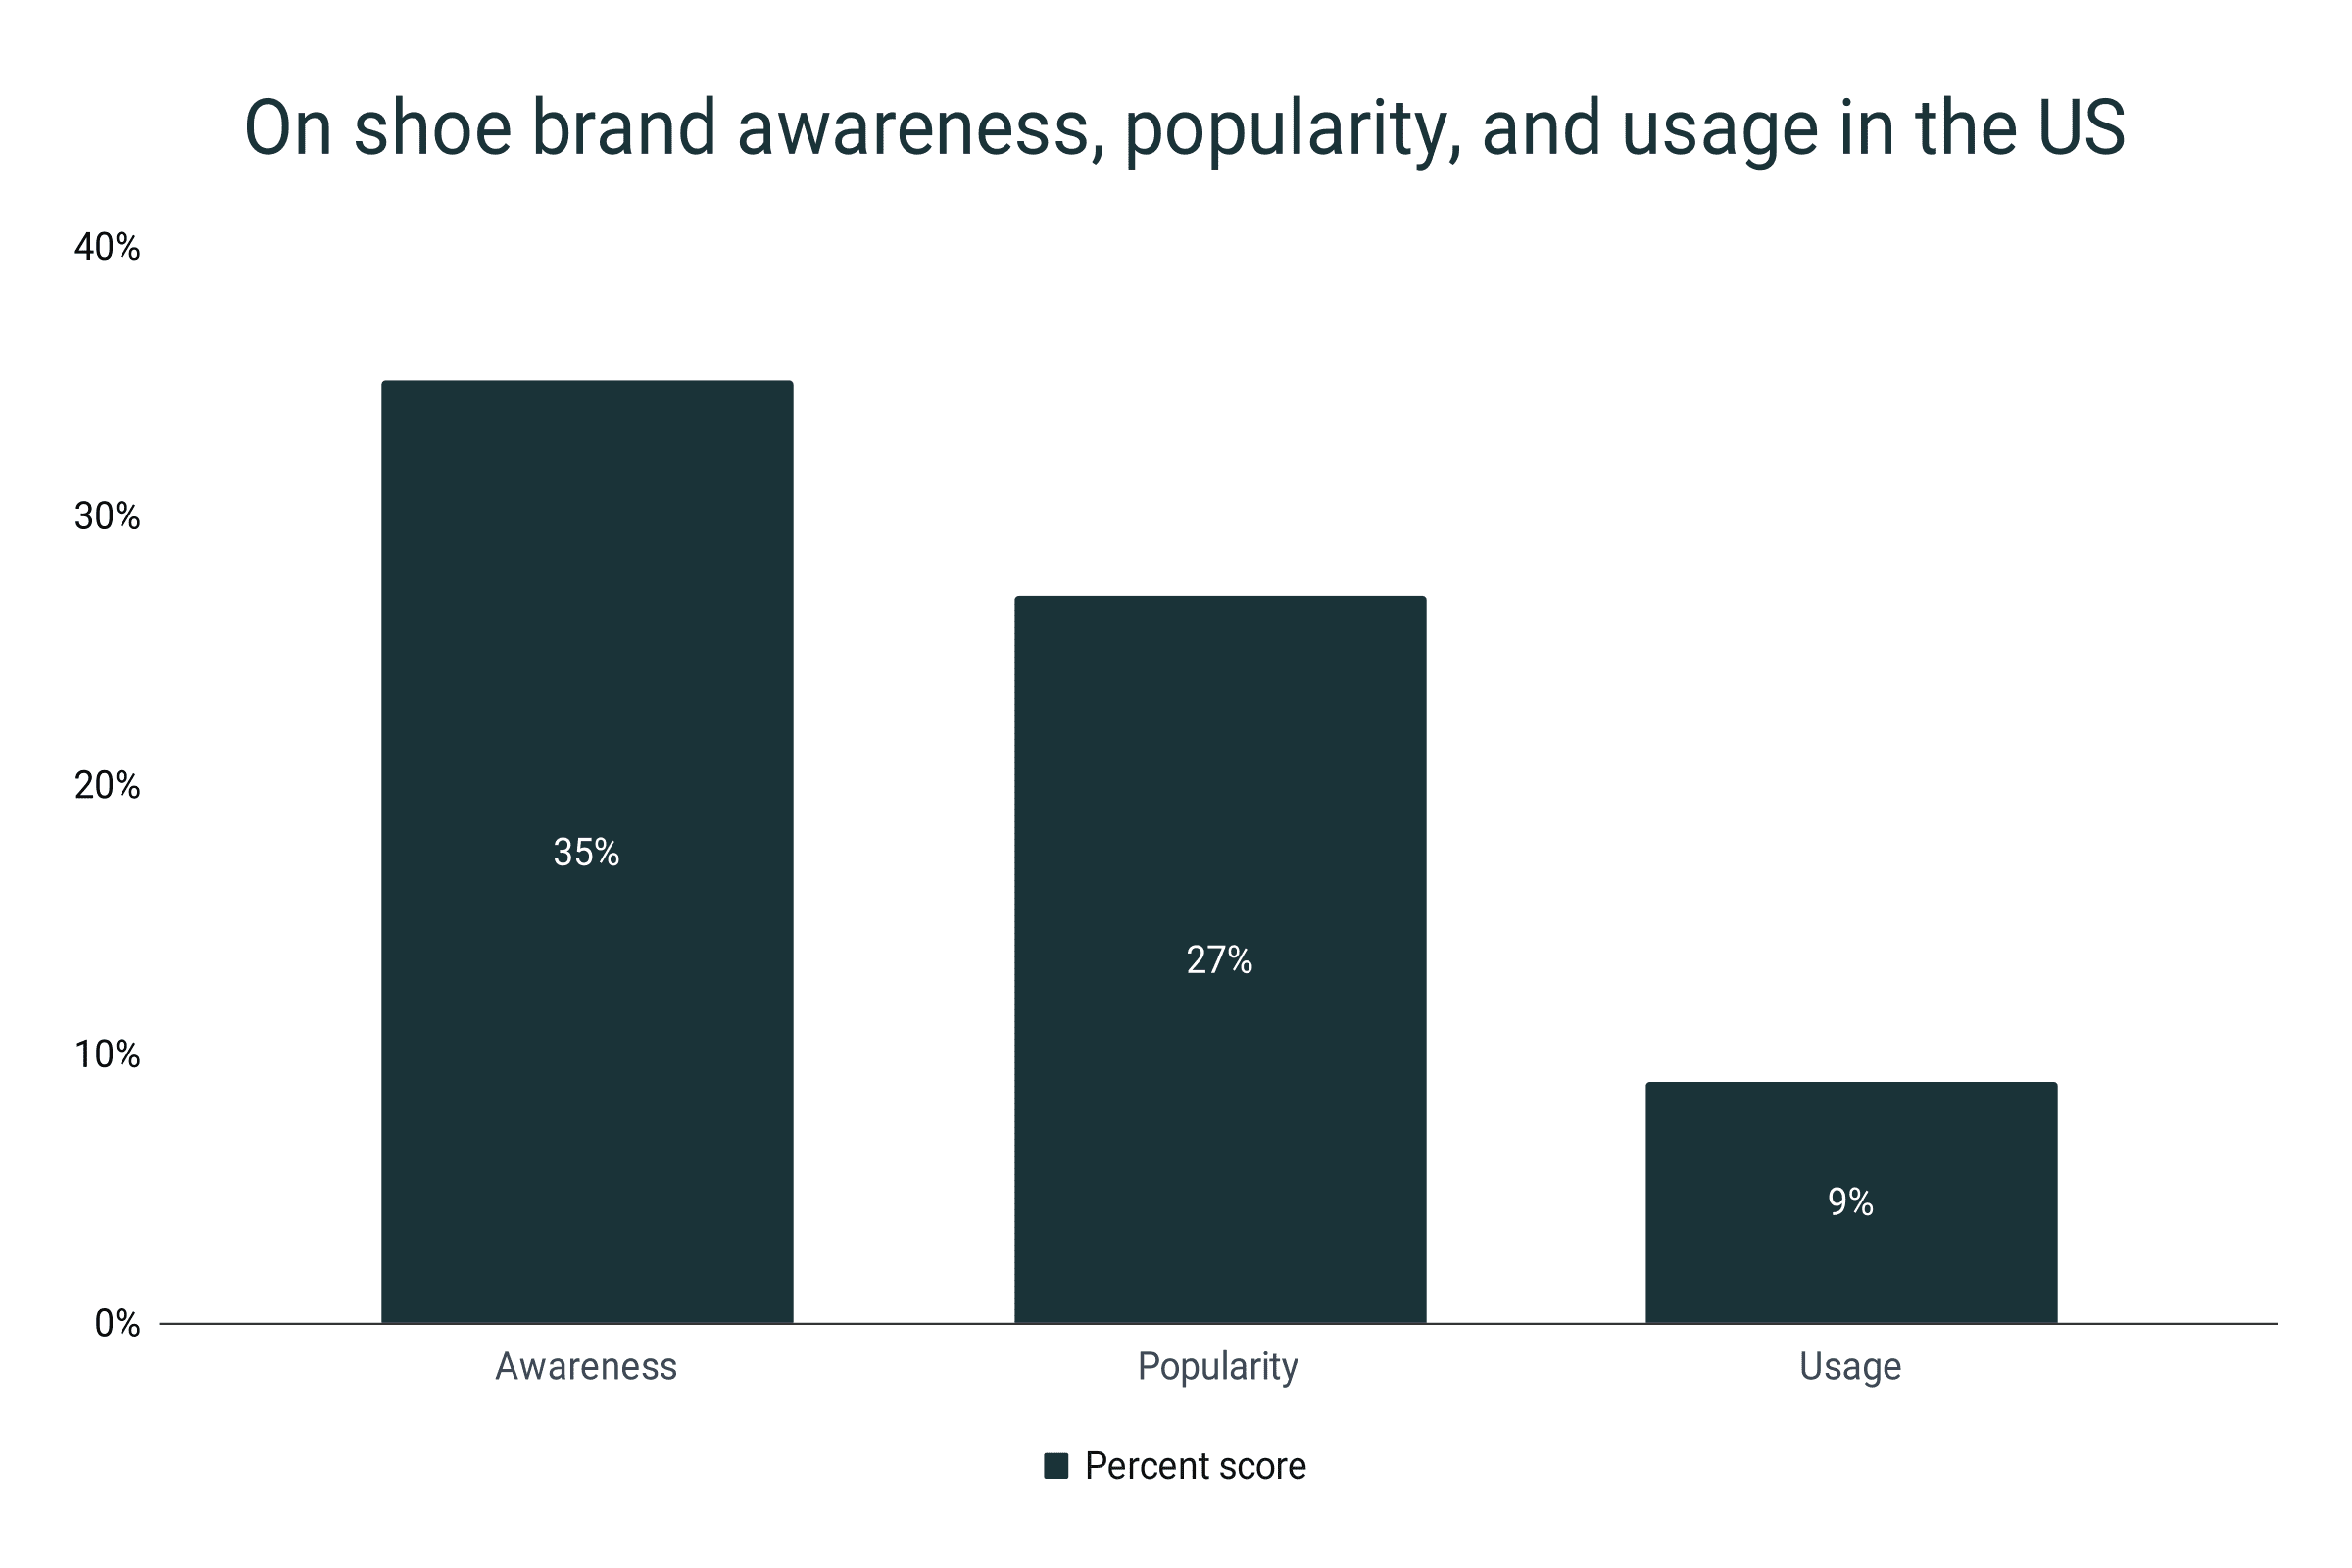
- 30% or about 1 in every 3 American shoppers have heard about On shoes. But only about 9% have bought and used them.
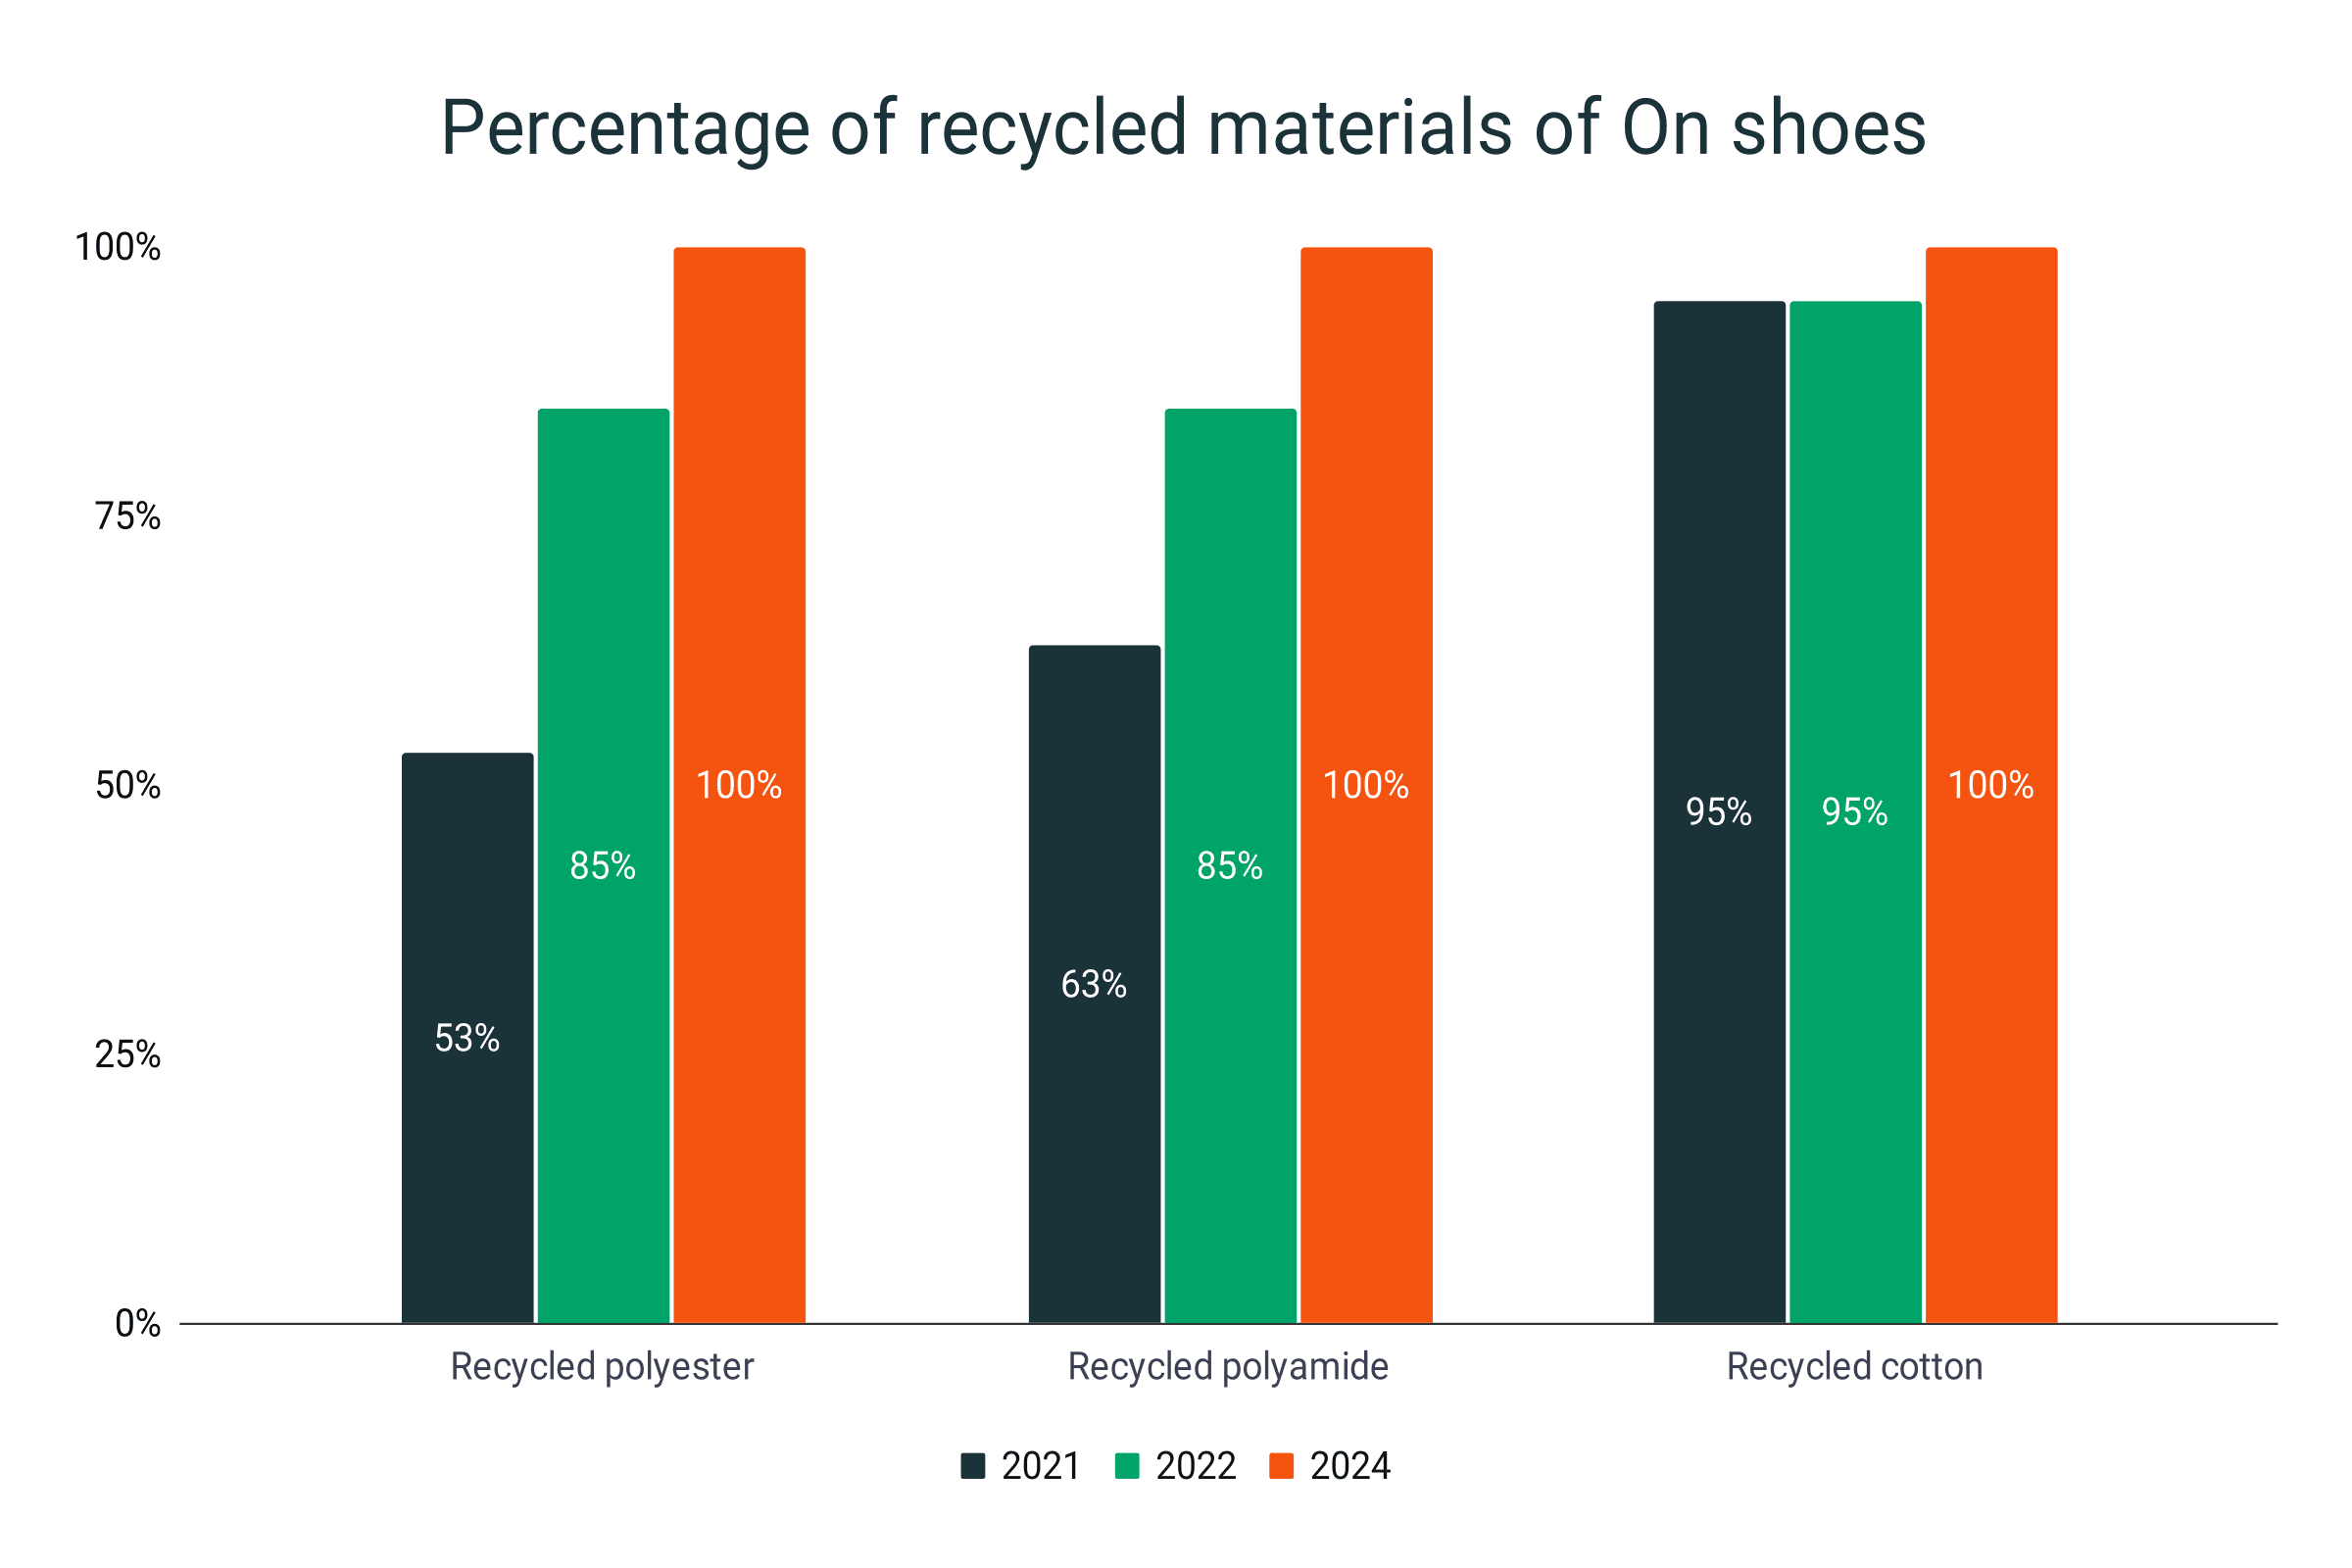
- On targets to achieve 100% usage of recycled polyester, polyamide, and cotton by 2024. As of 2022, the shoe company registered 85%, 85%, and 95% completion, respectively.
On shoe net sales by year
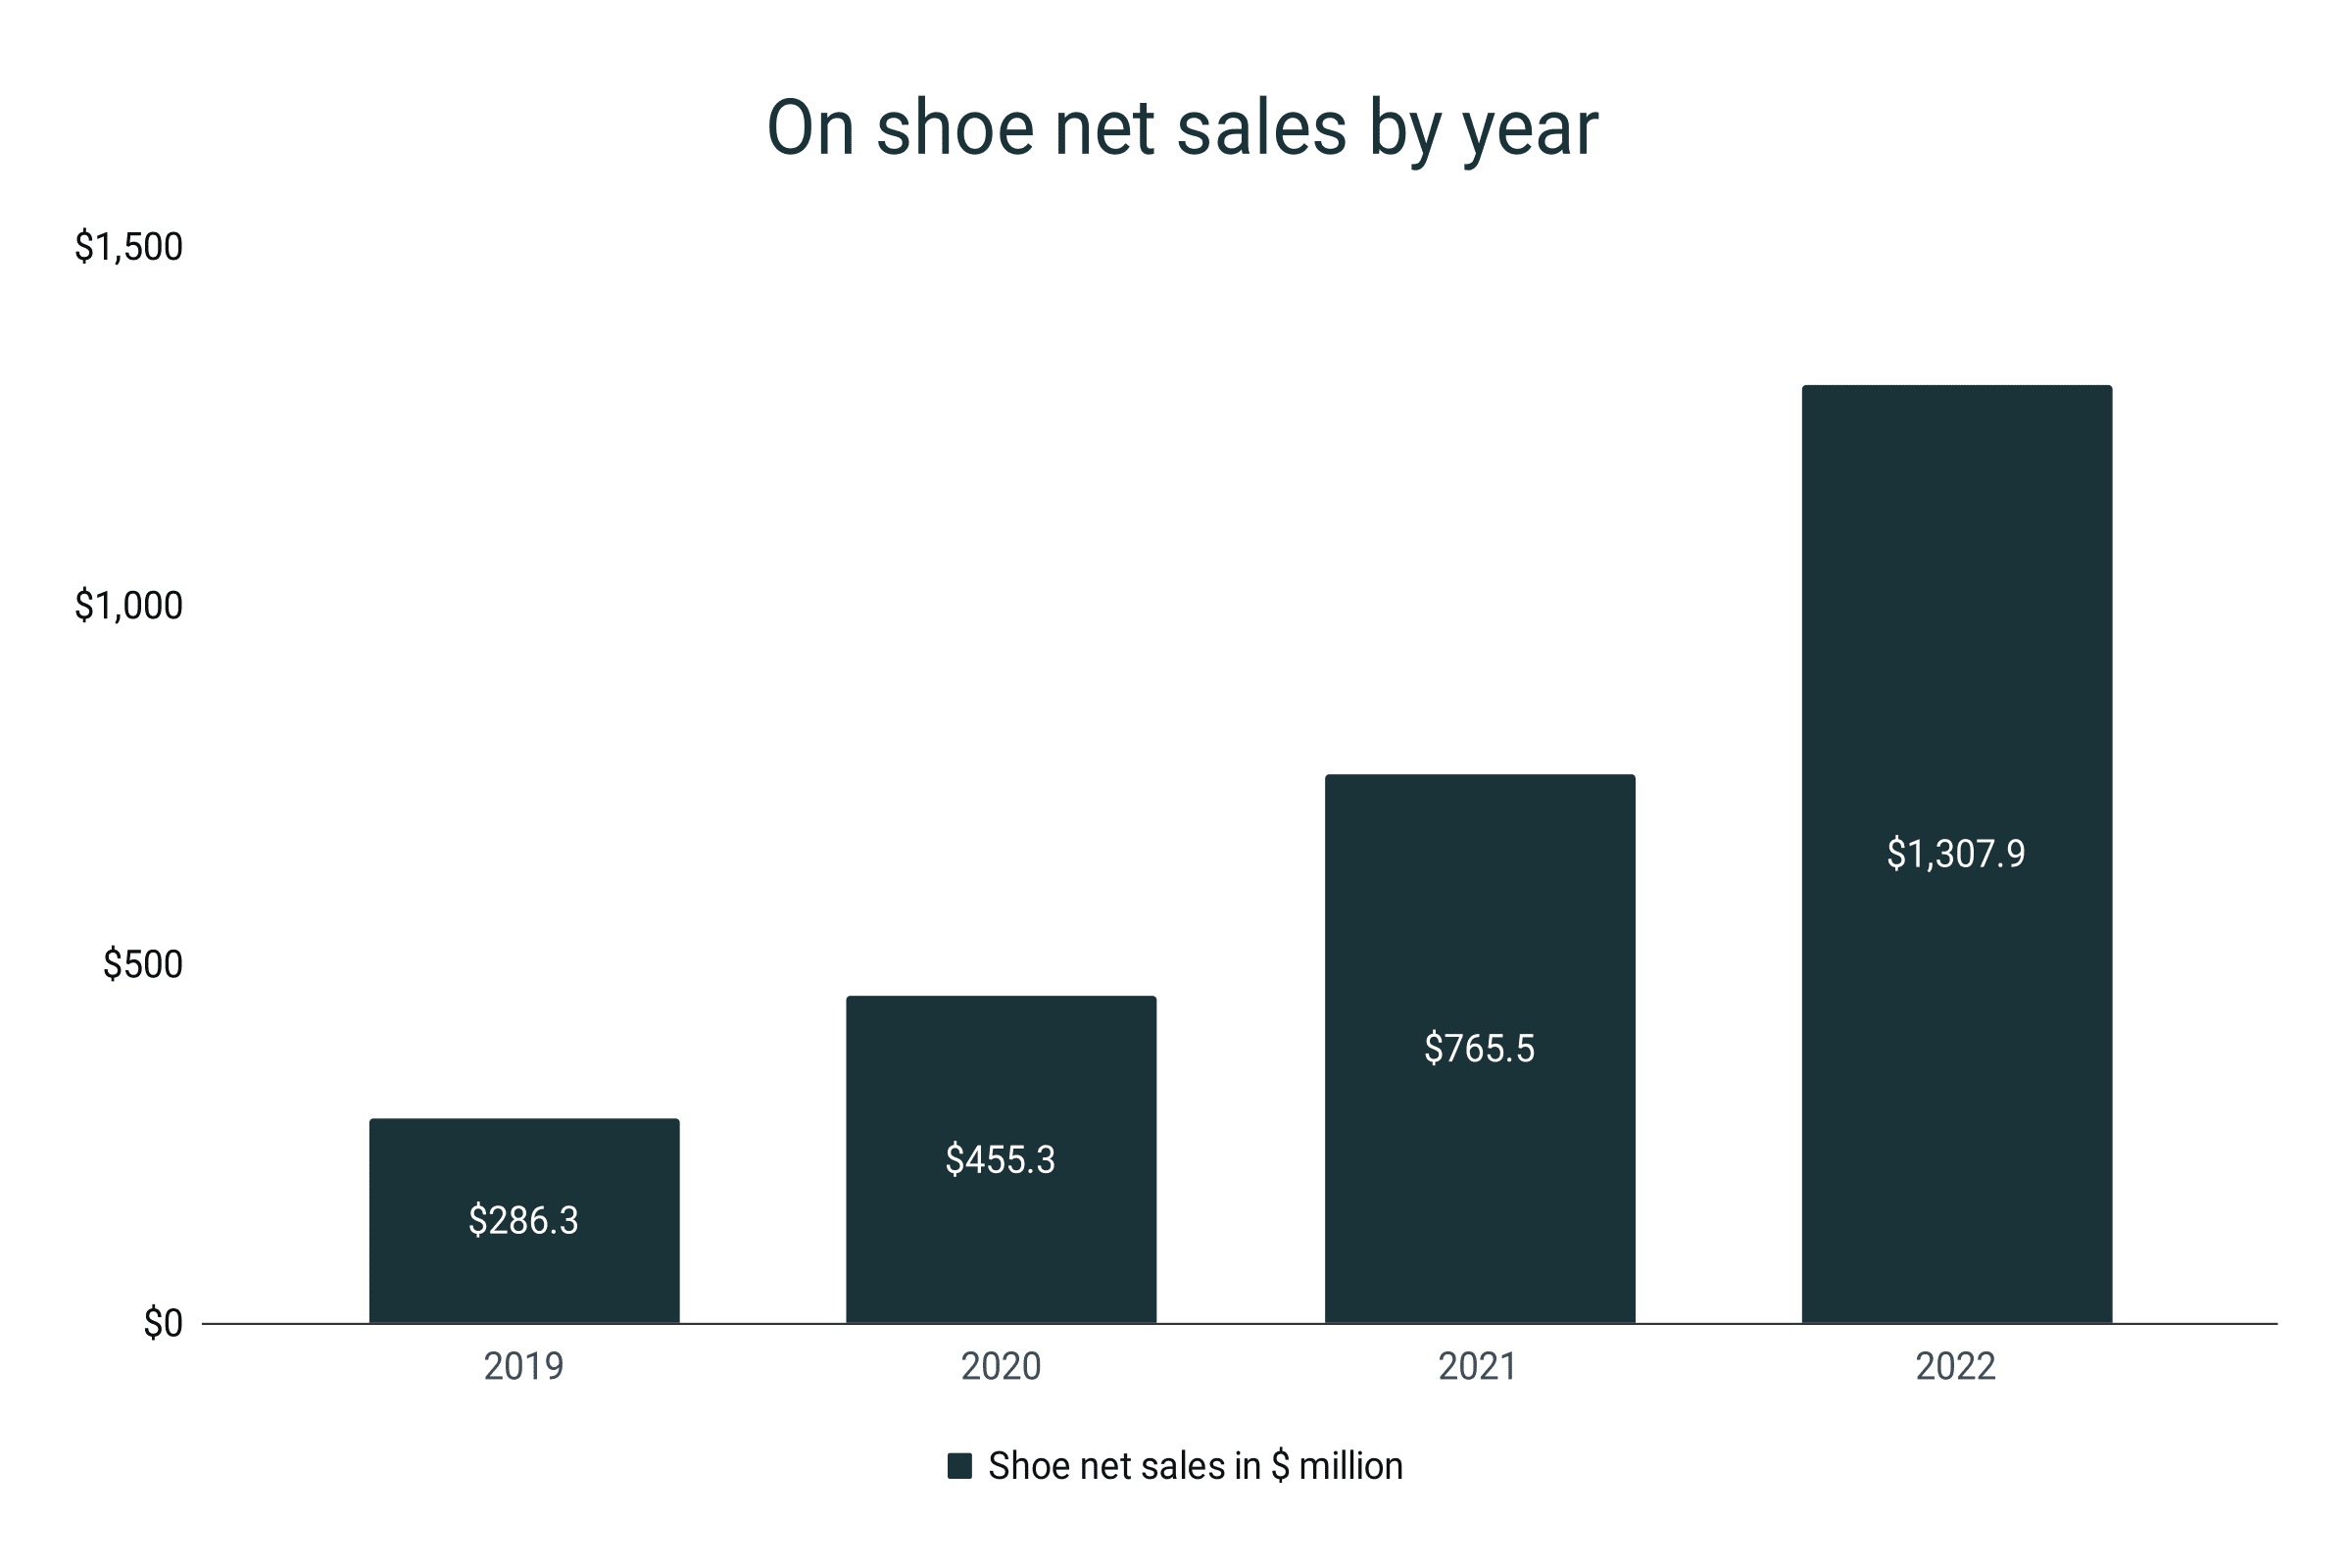
- On shoe sales tallied a $1,307.9 million net sales by the end of 2022. This is the first time the company breached the $1 billion mark in its footwear sales.
- This also marked an impressive 70.9% growth from its 2021 $765.5 million output.
- It is also worth noting that during the pandemic, the net sales of On actually experienced a 59% increase.
- From $286.3 million in 2019, On shoe net sales reached a total of $455.3 million in 2020.
- Overall, the shoe brand has ballooned by over 356.8% from 2019 to 2022.
On shoe net sales by year
|
Year |
Shoe net sales in $ million |
Year-on-year growth |
|
2019 |
$286.3 |
|
|
2020 |
$455.3 |
59.0% |
|
2021 |
$765.5 |
68.1% |
|
2022 |
$1,307.9 |
70.9% |
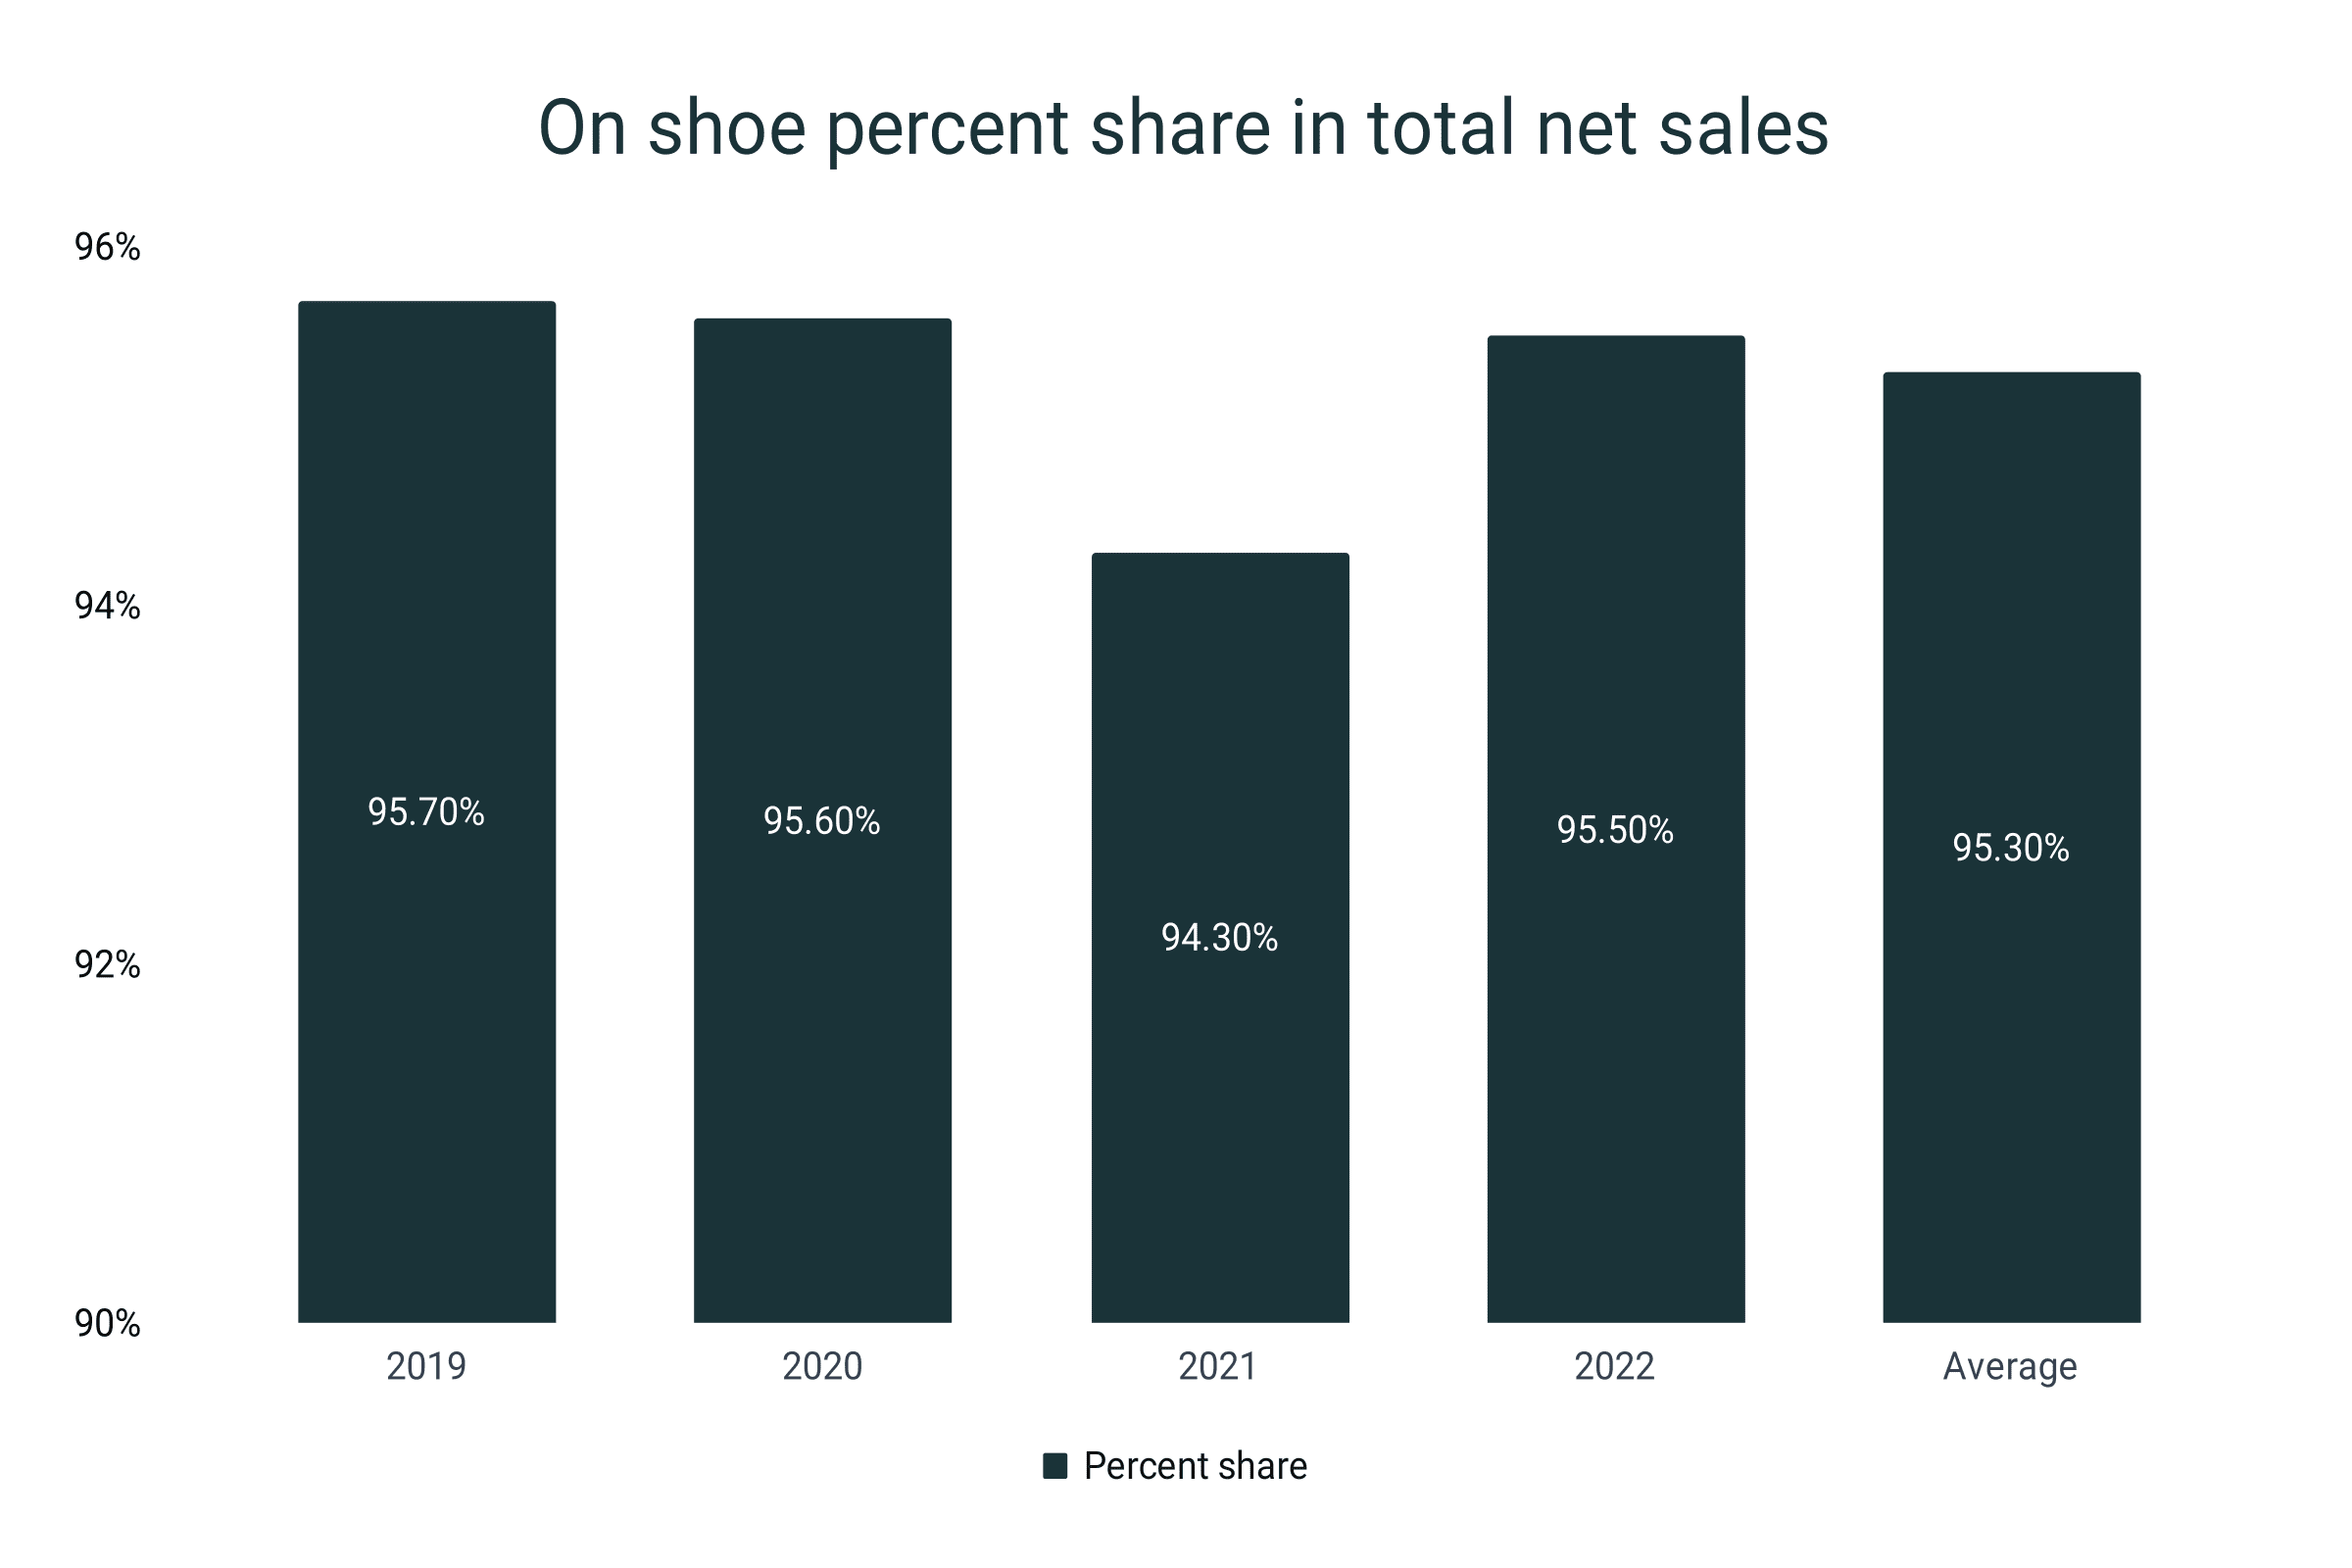
- In terms of percent share, the footwear segment pulled in 95.5% of the company's total sales in 2022.
- The portion was lower at 94.3% in 2021.
- In 2019 and 2020, the shoe sales of On equated to 95.7% and 95.5% shares, respectively.
- On average, the footwear department of On takes a 95.3% bulk of the company sales.
On shoe percent share in total net sales
|
Year |
%share to total sales |
|
2019 |
95.7% |
|
2020 |
95.6% |
|
2021 |
94.3% |
|
2022 |
95.5% |
|
Average |
95.3% |
On shoe net sales by quarter
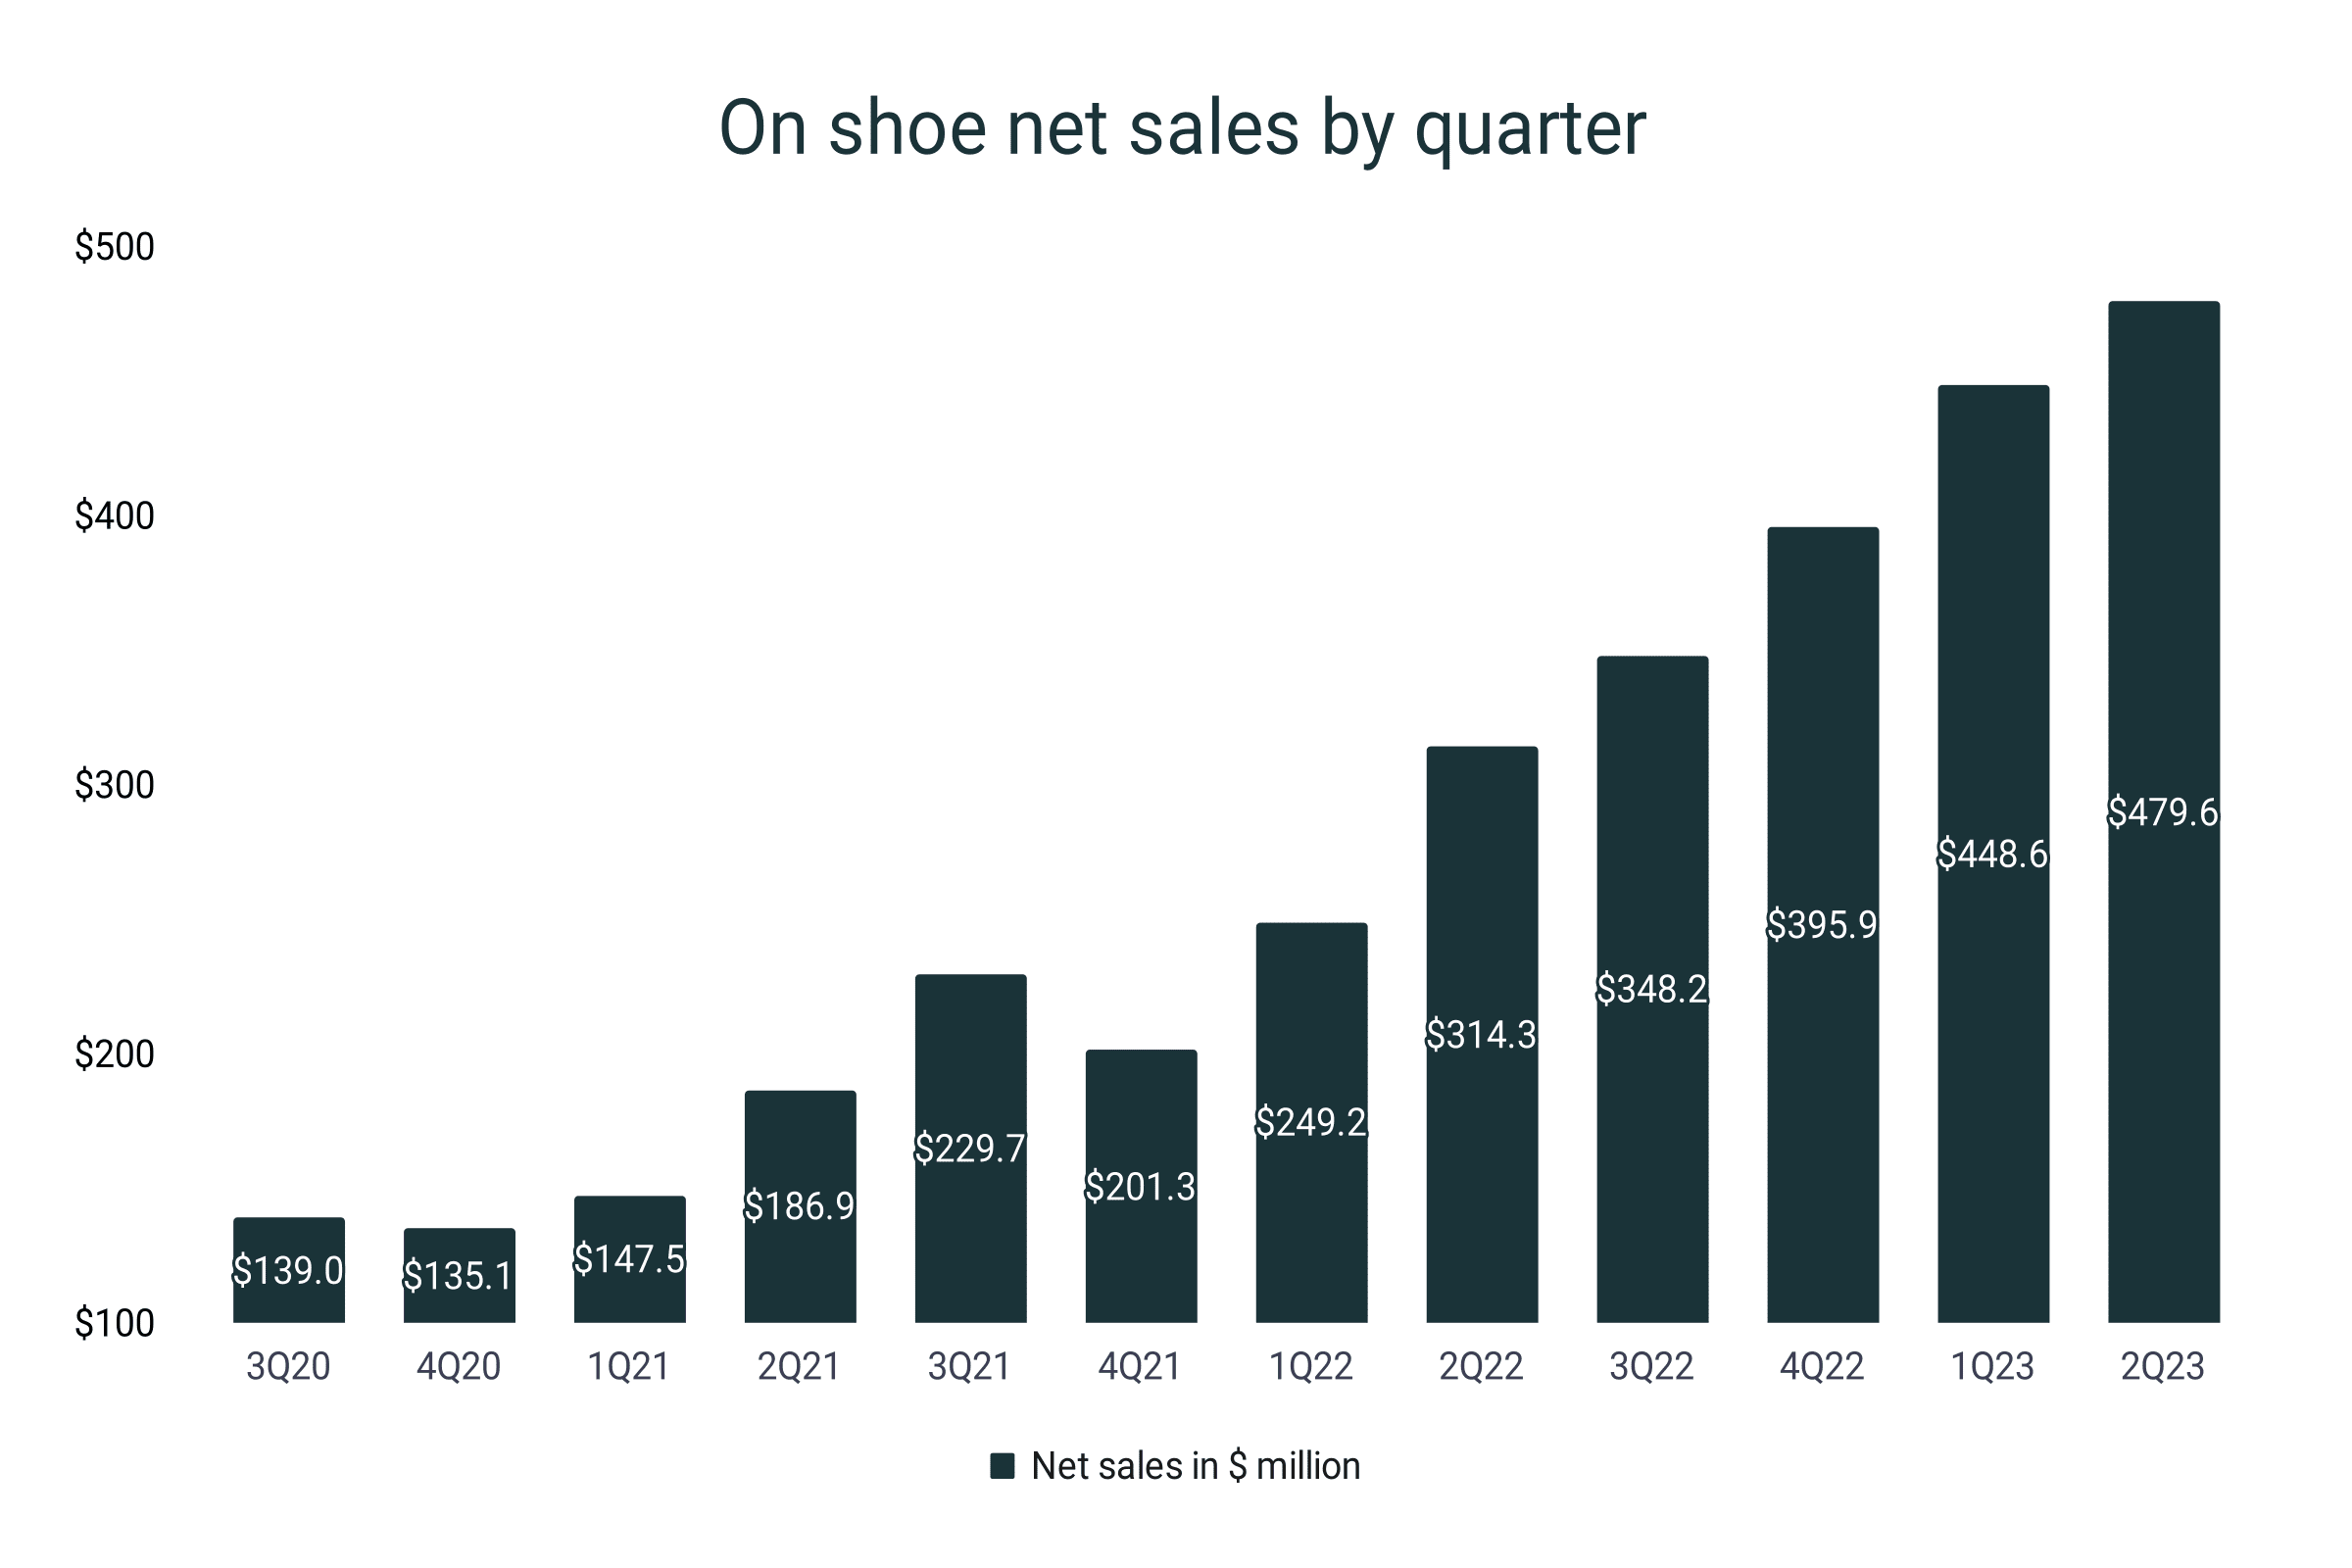
- Looking at the quarterly reports, as of the second quarter of 2023, On accumulated $479.6 million in sales.
- The shoe company started strong with $448.6 million in total sales during the first quarter of the same year.
- Meanwhile in 2022, On’s quarterly shoe sales experienced an upward trend. The company garnered $249.2, $314.3, $348.2, and $395.9 million, for the first to fourth quarters, respectively.
- In 2021, the footwear sales of On peaked at $229.7 million during the third quarter.
- It started with $147.5 million in sales in the first quarter and closed with $201.3 million by the end of 2021.
- Additionally, during the latter part of 2020, On showed signs of slowing down. From $139 million in sales in Q3 of the2020, it settled for $135.1 million before the fiscal year ended.
On shoe net sales by quarter
|
Quarter |
Net sales in $ million |
|
3Q20 |
$139.0 |
|
4Q20 |
$135.1 |
|
1Q21 |
$147.5 |
|
2Q21 |
$186.9 |
|
3Q21 |
$229.7 |
|
4Q21 |
$201.3 |
|
1Q22 |
$249.2 |
|
2Q22 |
$314.3 |
|
3Q22 |
$348.2 |
|
4Q22 |
$395.9 |
|
1Q23 |
$448.6 |
|
2Q23 |
$479.6 |
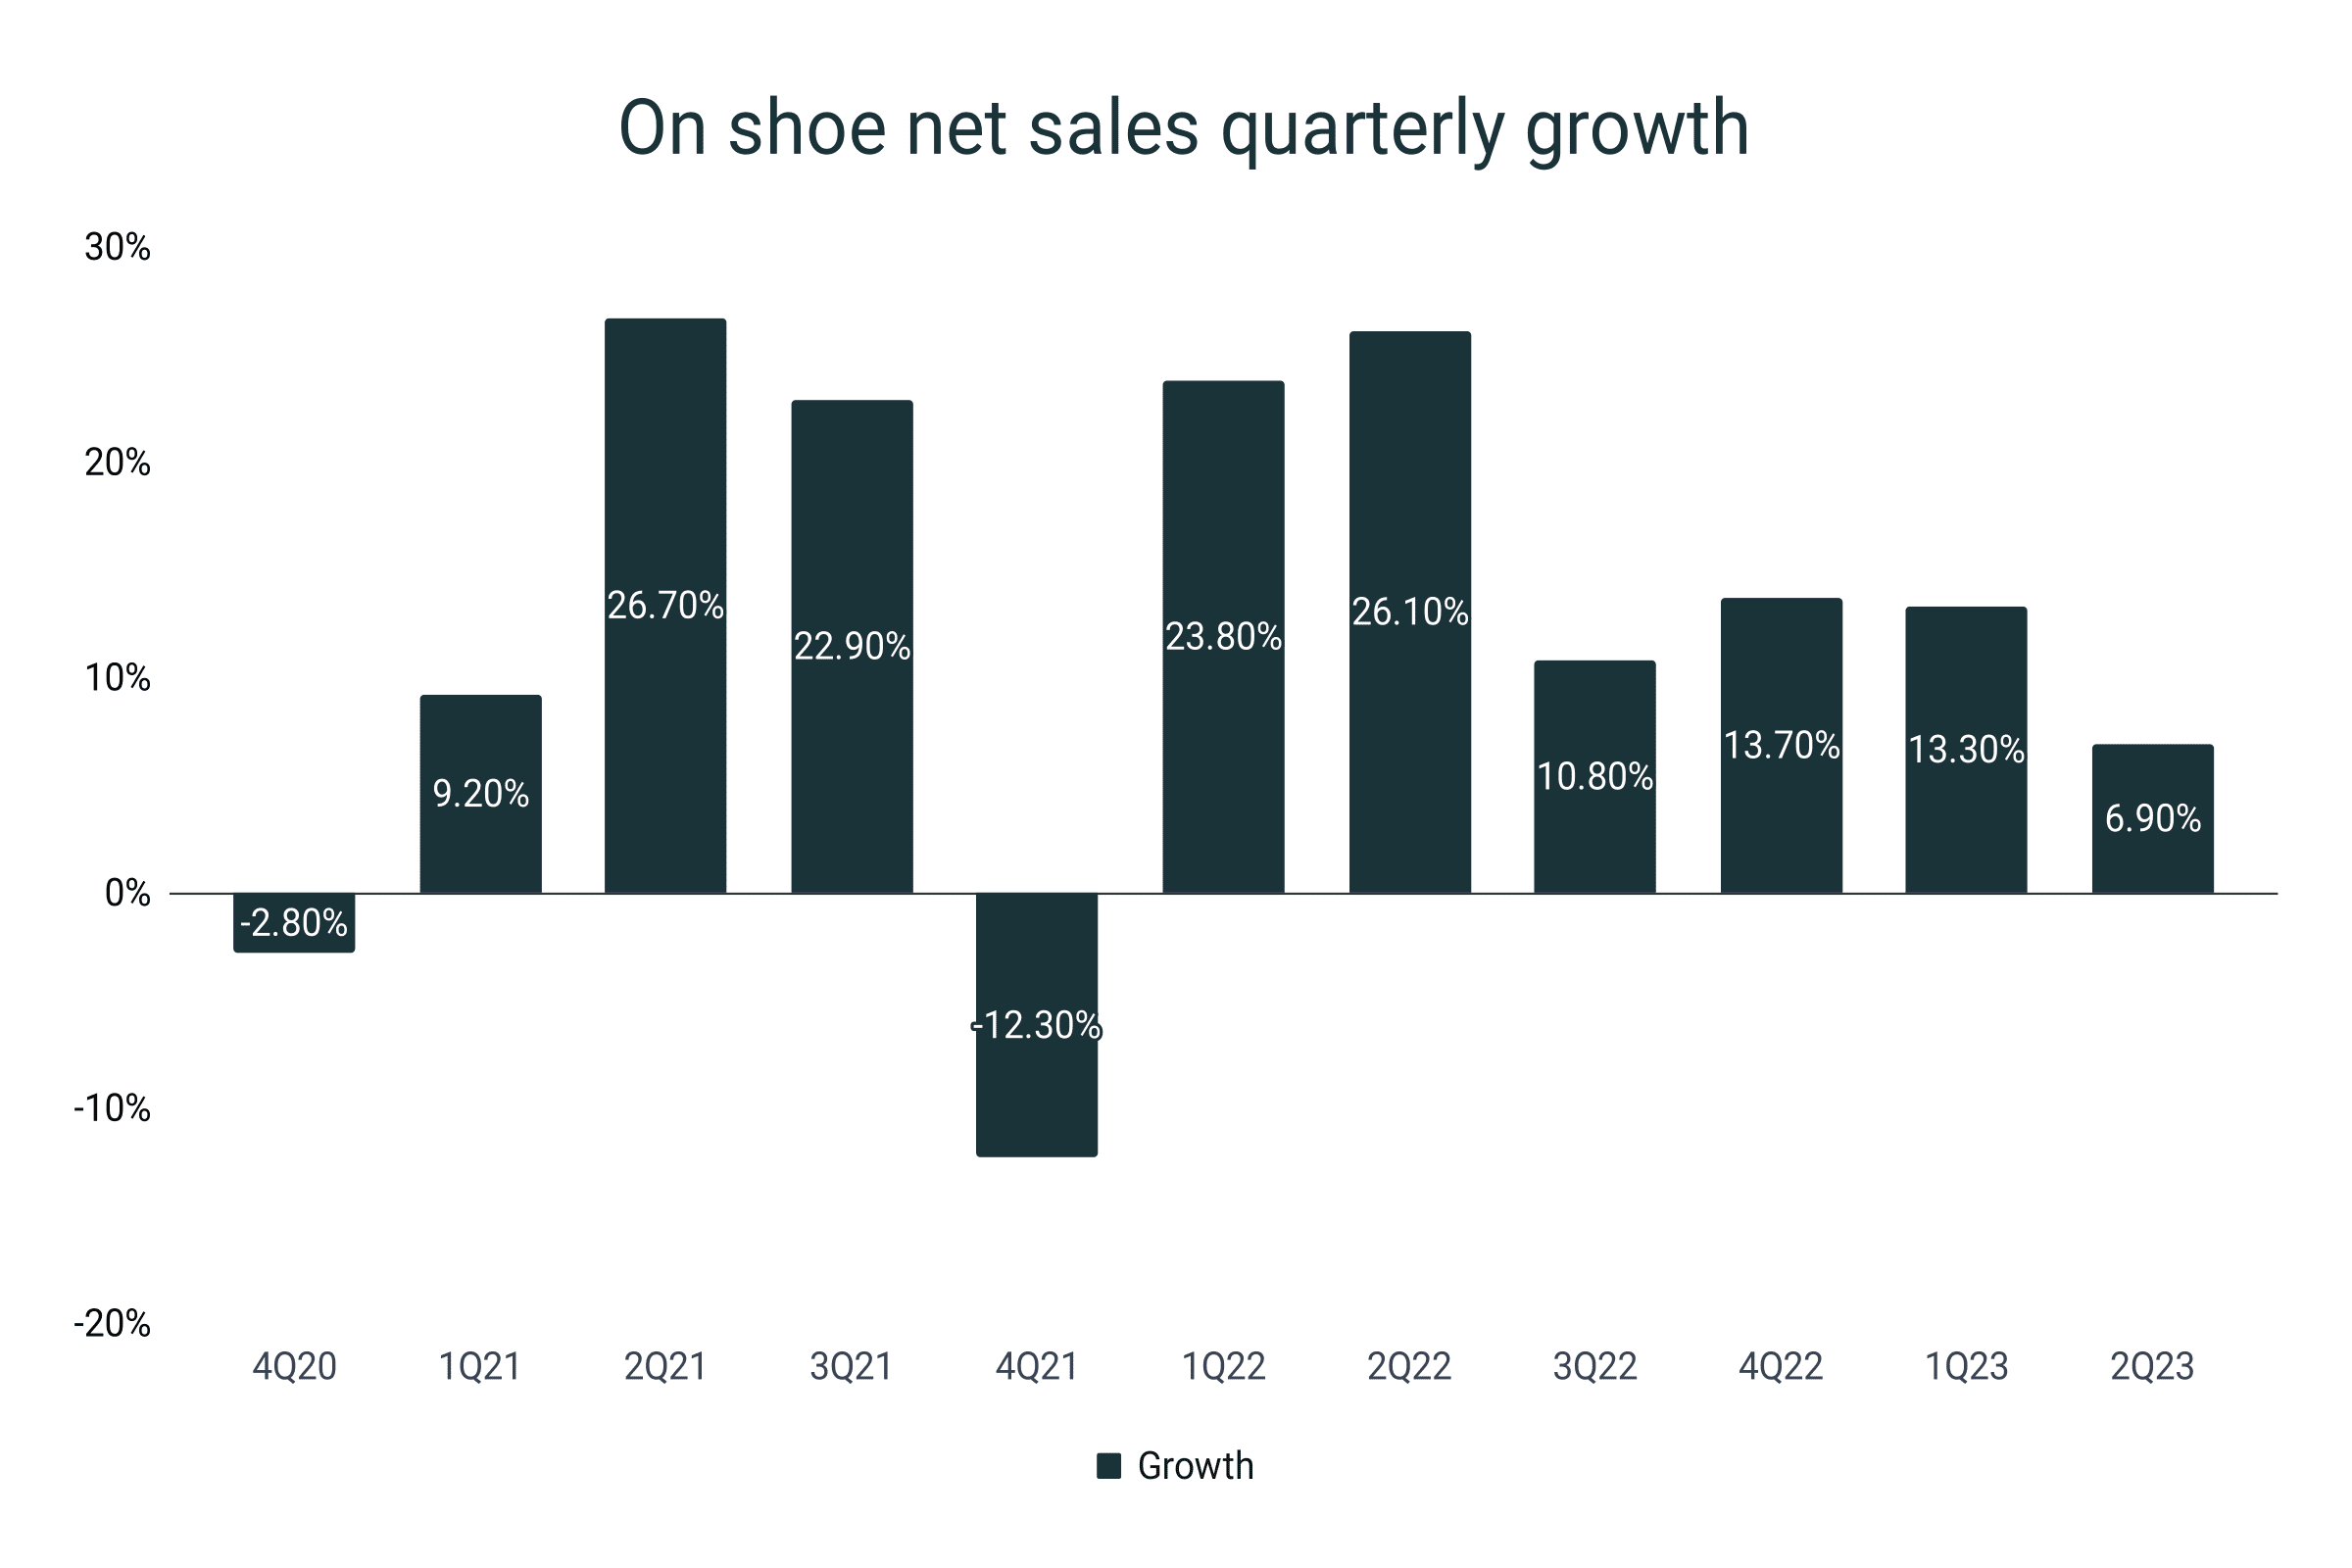
- In terms of quarterly growths, On shoe sales felt a 6.9% increase between the first and second quarter of 2023.
- During 2022, On shoes’ quarterly growth exhibited a 23.8% and 26.1% incline during the first half of the year.
- This is a significant improvement compared to the 12.3% dip in the Q4 of 2021.
- The highest quarter-to-quarter growth of the shoe sales of the company happened between the 1st and 2nd quarters of 2021. From a 9.2% in Q1, On managed to pump a 26.7% growth by the end of the second quarter.
- In the fourth quarter of 2020, On actually suffered a 2.8% decline in net sales.
On shoe net sales quarterly growth
|
Quarter |
Growth |
|
4Q20 |
-2.8% |
|
1Q21 |
9.2% |
|
2Q21 |
26.7% |
|
3Q21 |
22.9% |
|
4Q21 |
-12.3% |
|
1Q22 |
23.8% |
|
2Q22 |
26.1% |
|
3Q22 |
10.8% |
|
4Q22 |
13.7% |
|
1Q23 |
13.3% |
|
2Q23 |
6.9% |
On shoe market share
- Globally, On settled for a 0.34% footwear market share by the end of 2022.
- This is significantly higher than its 0.22% market portion in 20221.
- During the pandemic, On improved its footing gaining momentum from 0.07% to 0.13% from 2019 to 2020, respectively.
On shoe global market share
|
Year |
Percent share |
|
2019 |
0.07% |
|
2020 |
0.13% |
|
2021 |
0.22% |
|
2022 |
0.34% |
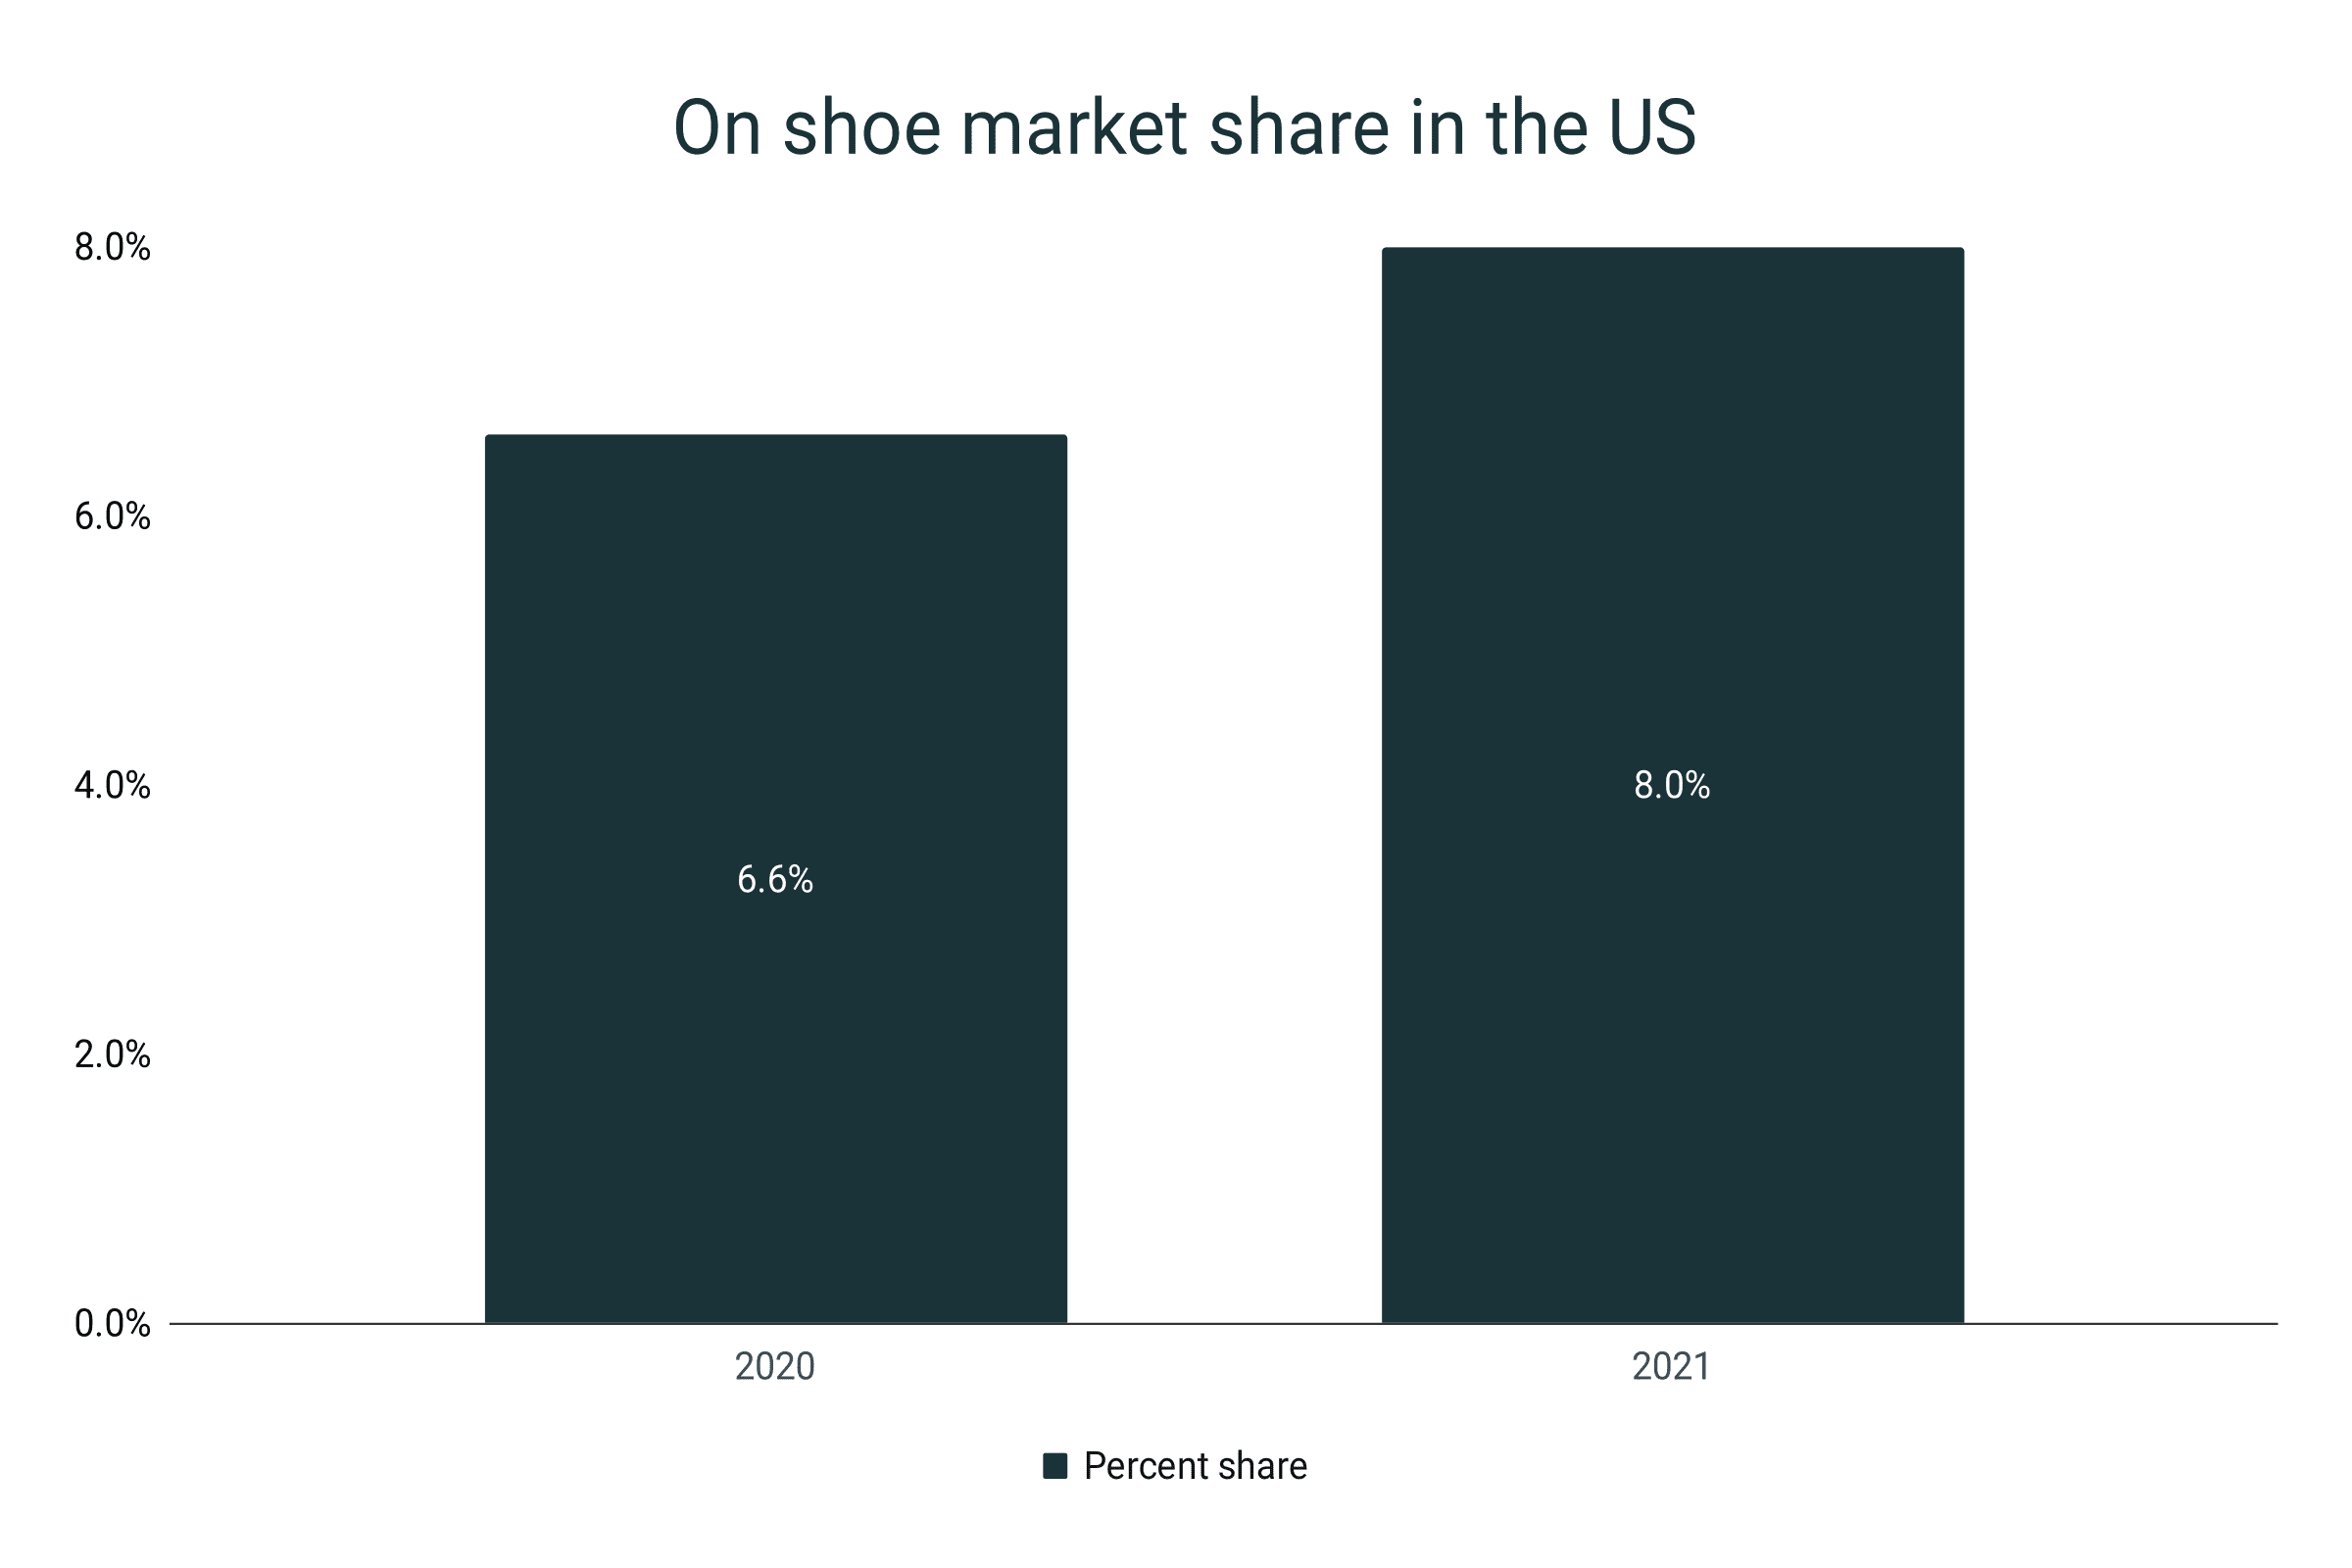
- In 2021, On shoes established an 8% stronghold on the American footwear market.
- Meaning, the company added 1.4% to its market share compared to the 6.6% performance in 2020.
- Meanwhile in its home country, On shoes occupied 40% of the running shoe market in 2019.
- In Germany, the shoe company snagged a 10% cut during the same year.
On shoe market share in the US
|
Year |
Percent share |
|
2020 |
6.6% |
|
2021 |
8% |
Average On shoe prices in 2023
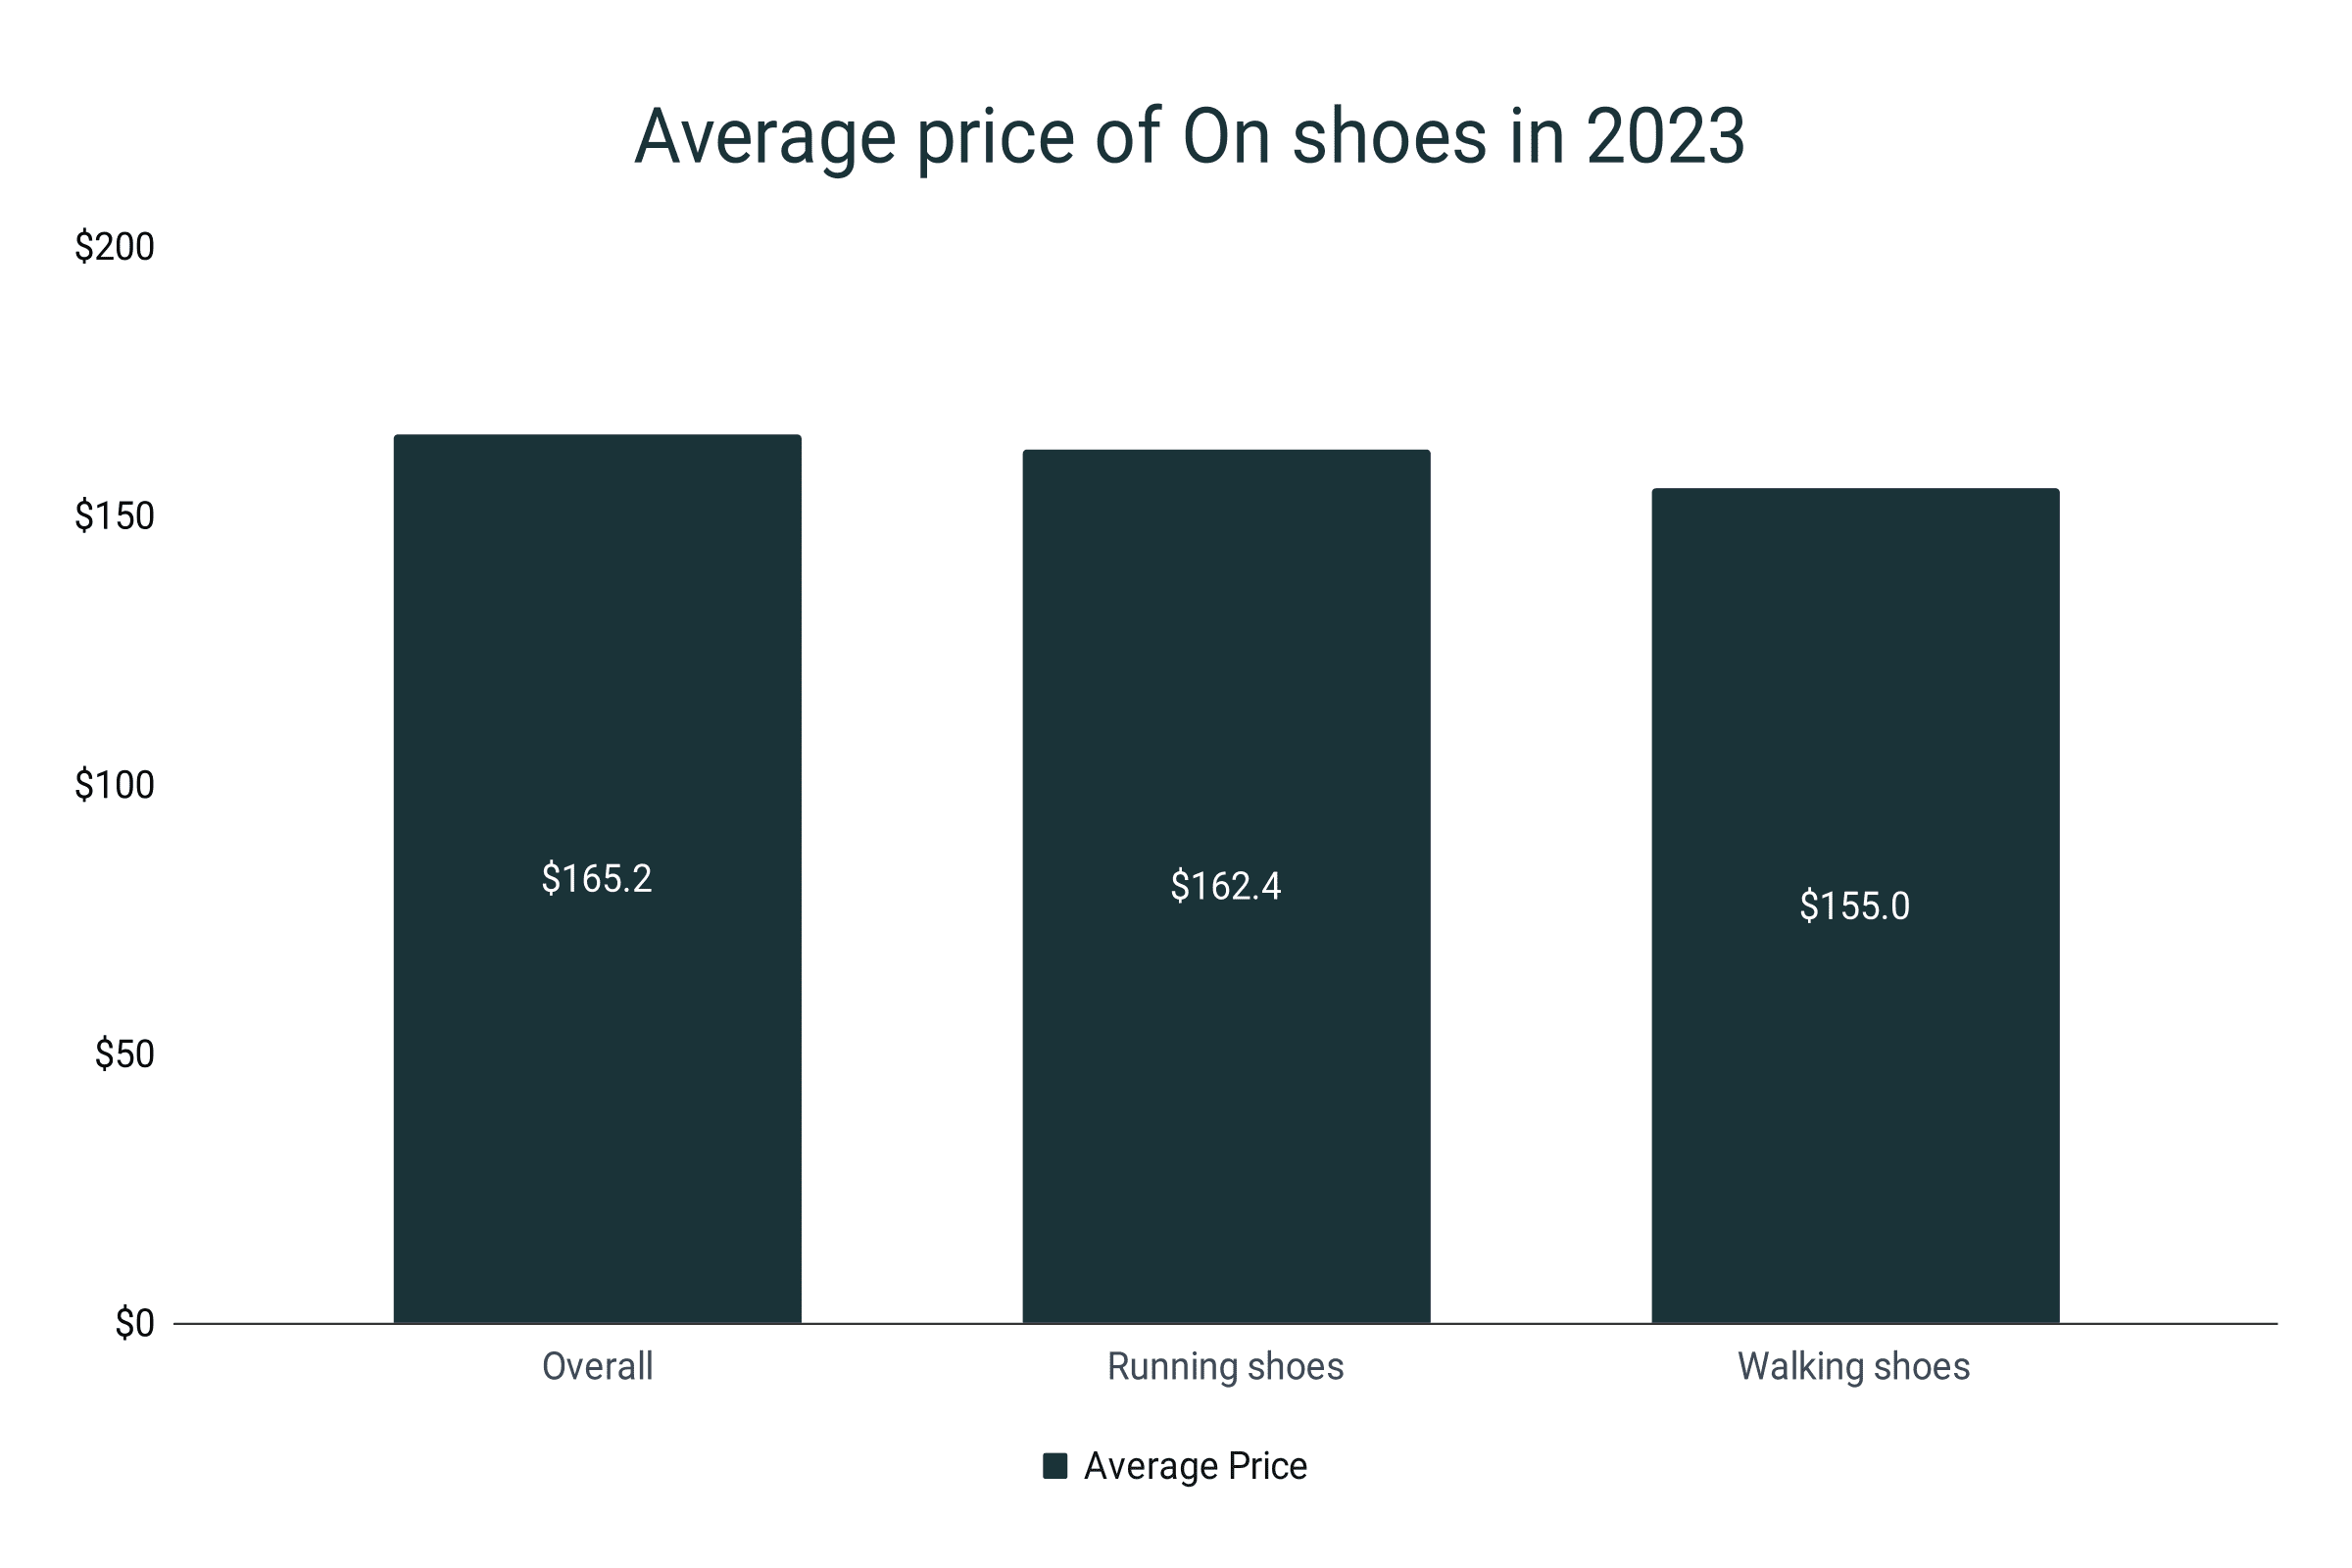
- The average price of a pair of On shoes is $165.2.
- Compared to an average pair of shoes which costs $124, On shoes are 33.2% more expensive.
- A pair of On running shoes retails for $162.4 on average.
- On the other hand, an average running shoe has a price tag of $124 only. This makes On running shoes 31% pricier.
- For walking shoes, On is 78.2% more costly. On walking shoes cost $155 while the average walking shoe price is only $87.
- In general, On shoes cost more than $100. By far, the prices of their footwear products range from $130 to $270.
Average price of On shoes
|
Type |
Average Price |
|
Overall |
$165.2 |
|
Running shoes |
$162.4 |
|
Walking shoes |
$155.0 |
Average weight of On shoes
- The mean weight of a for-men On shoe is 10.1 oz or 287.6g.
- For women, the average pair weighs 8.5 oz (240.6g).
- In terms of running shoes, men’s On shoes weigh 9.5 oz (268.2g). The average is 7.9 oz (224.6g) for women’s running shoes.
- Men’s walking shoes from On have an average weight of 9.4 oz (266.5g).
- On the other hand, On’s for-her walking shoes weigh 7.3 oz or 208 grammes on average.
Average weight of On shoes in oz
|
Type |
Men |
Women |
|
Overall |
10.1 |
8.5 |
|
Running |
9.5 |
7.9 |
|
Walking |
9.4 |
7.3 |
Popularity of On shoes in the United States
- In the United States, On is gaining traction. As of 2022, about 35% of the American consumer population is familiar with the brand. That is roughly 1 out of every 3 people.
- The shoe company also scored 27% in terms of popularity among the US populace.
- But in terms of usage, only about 9% have owned and used On shoes.
- Additionally, 69% of owners of On shoes are concerned about climate change.
- The presence of On shoes in SSense and Nordstrom has grown by 600% and 400% in 2020, respectively.
- 38% of buyers of On shoes have known the brand through social media.
- 79% of On shoe users run/jog weekly.
- Furthermore, about 13% jog and/or run monthly. While 8% of On buyers rarely or never run.
On shoe brand awareness, popularity, and usage in the US
|
Parameter |
Percent score |
|
Awareness |
35% |
|
Popularity |
27% |
|
Usage |
9% |
Sustainability
- The shoe company targets to use 100% recycled polyester and polyamide by the end of 2024.
- In 2022, 85% of shoes and apparel by On used recycled polyester.
- In 2021, the portion was only 53%.
- The company was able to increase its usage of recycled polyamide in its manufacturing from 63% in 2021 to 85% in 2022.
- Since 2021, On shoes and apparel combined utilise 95% recycled cotton.
- With the same performance of 95% in 2022, On aims to achieve 100% dependence on recycled cotton by 2024.
Percentage of recycled materials of On shoes
|
Year |
Recycled polyester |
Recycled polyamide |
Recycled cotton |
|
2021 |
53% |
63% |
95% |
|
2022 |
85% |
85% |
95% |
|
2024* |
100% |
100% |
100% |
*Target
Sources
https://s28.q4cdn.com/811960755/files/doc_financials/2022/q4/2022-Annual-Report.pdf
https://s28.q4cdn.com/811960755/files/doc_financials/2021/q4/On-Annual-Report_2021_vF.pdf
https://s28.q4cdn.com/811960755/files/doc_financials/2021/q3/Q3-21-Results-Business-Update.pdf
https://investors.on-running.com/financials-and-filings/default.aspx
https://blog.finishline.com/the-history-of-on-running/
https://blog.finishline.com/the-history-of-on-running/
https://civicscience.com/brand-to-watch-on-on-cloud-making-big-strides-in-running-shoe-market/
https://investors.on-running.com/search-results/?SearchTerm=sustainability
