Hiking in the US has Never Been More Popular [Study]
We’ve partnered with AllTrails, the largest hiking and trail-specific navigation app, to explore what effect COVID-19 has had on hiking since the pandemic started. To do this we’ve analysed 7,927,354 activities logged on AllTrails since January 1st, 2016.
Key Findings
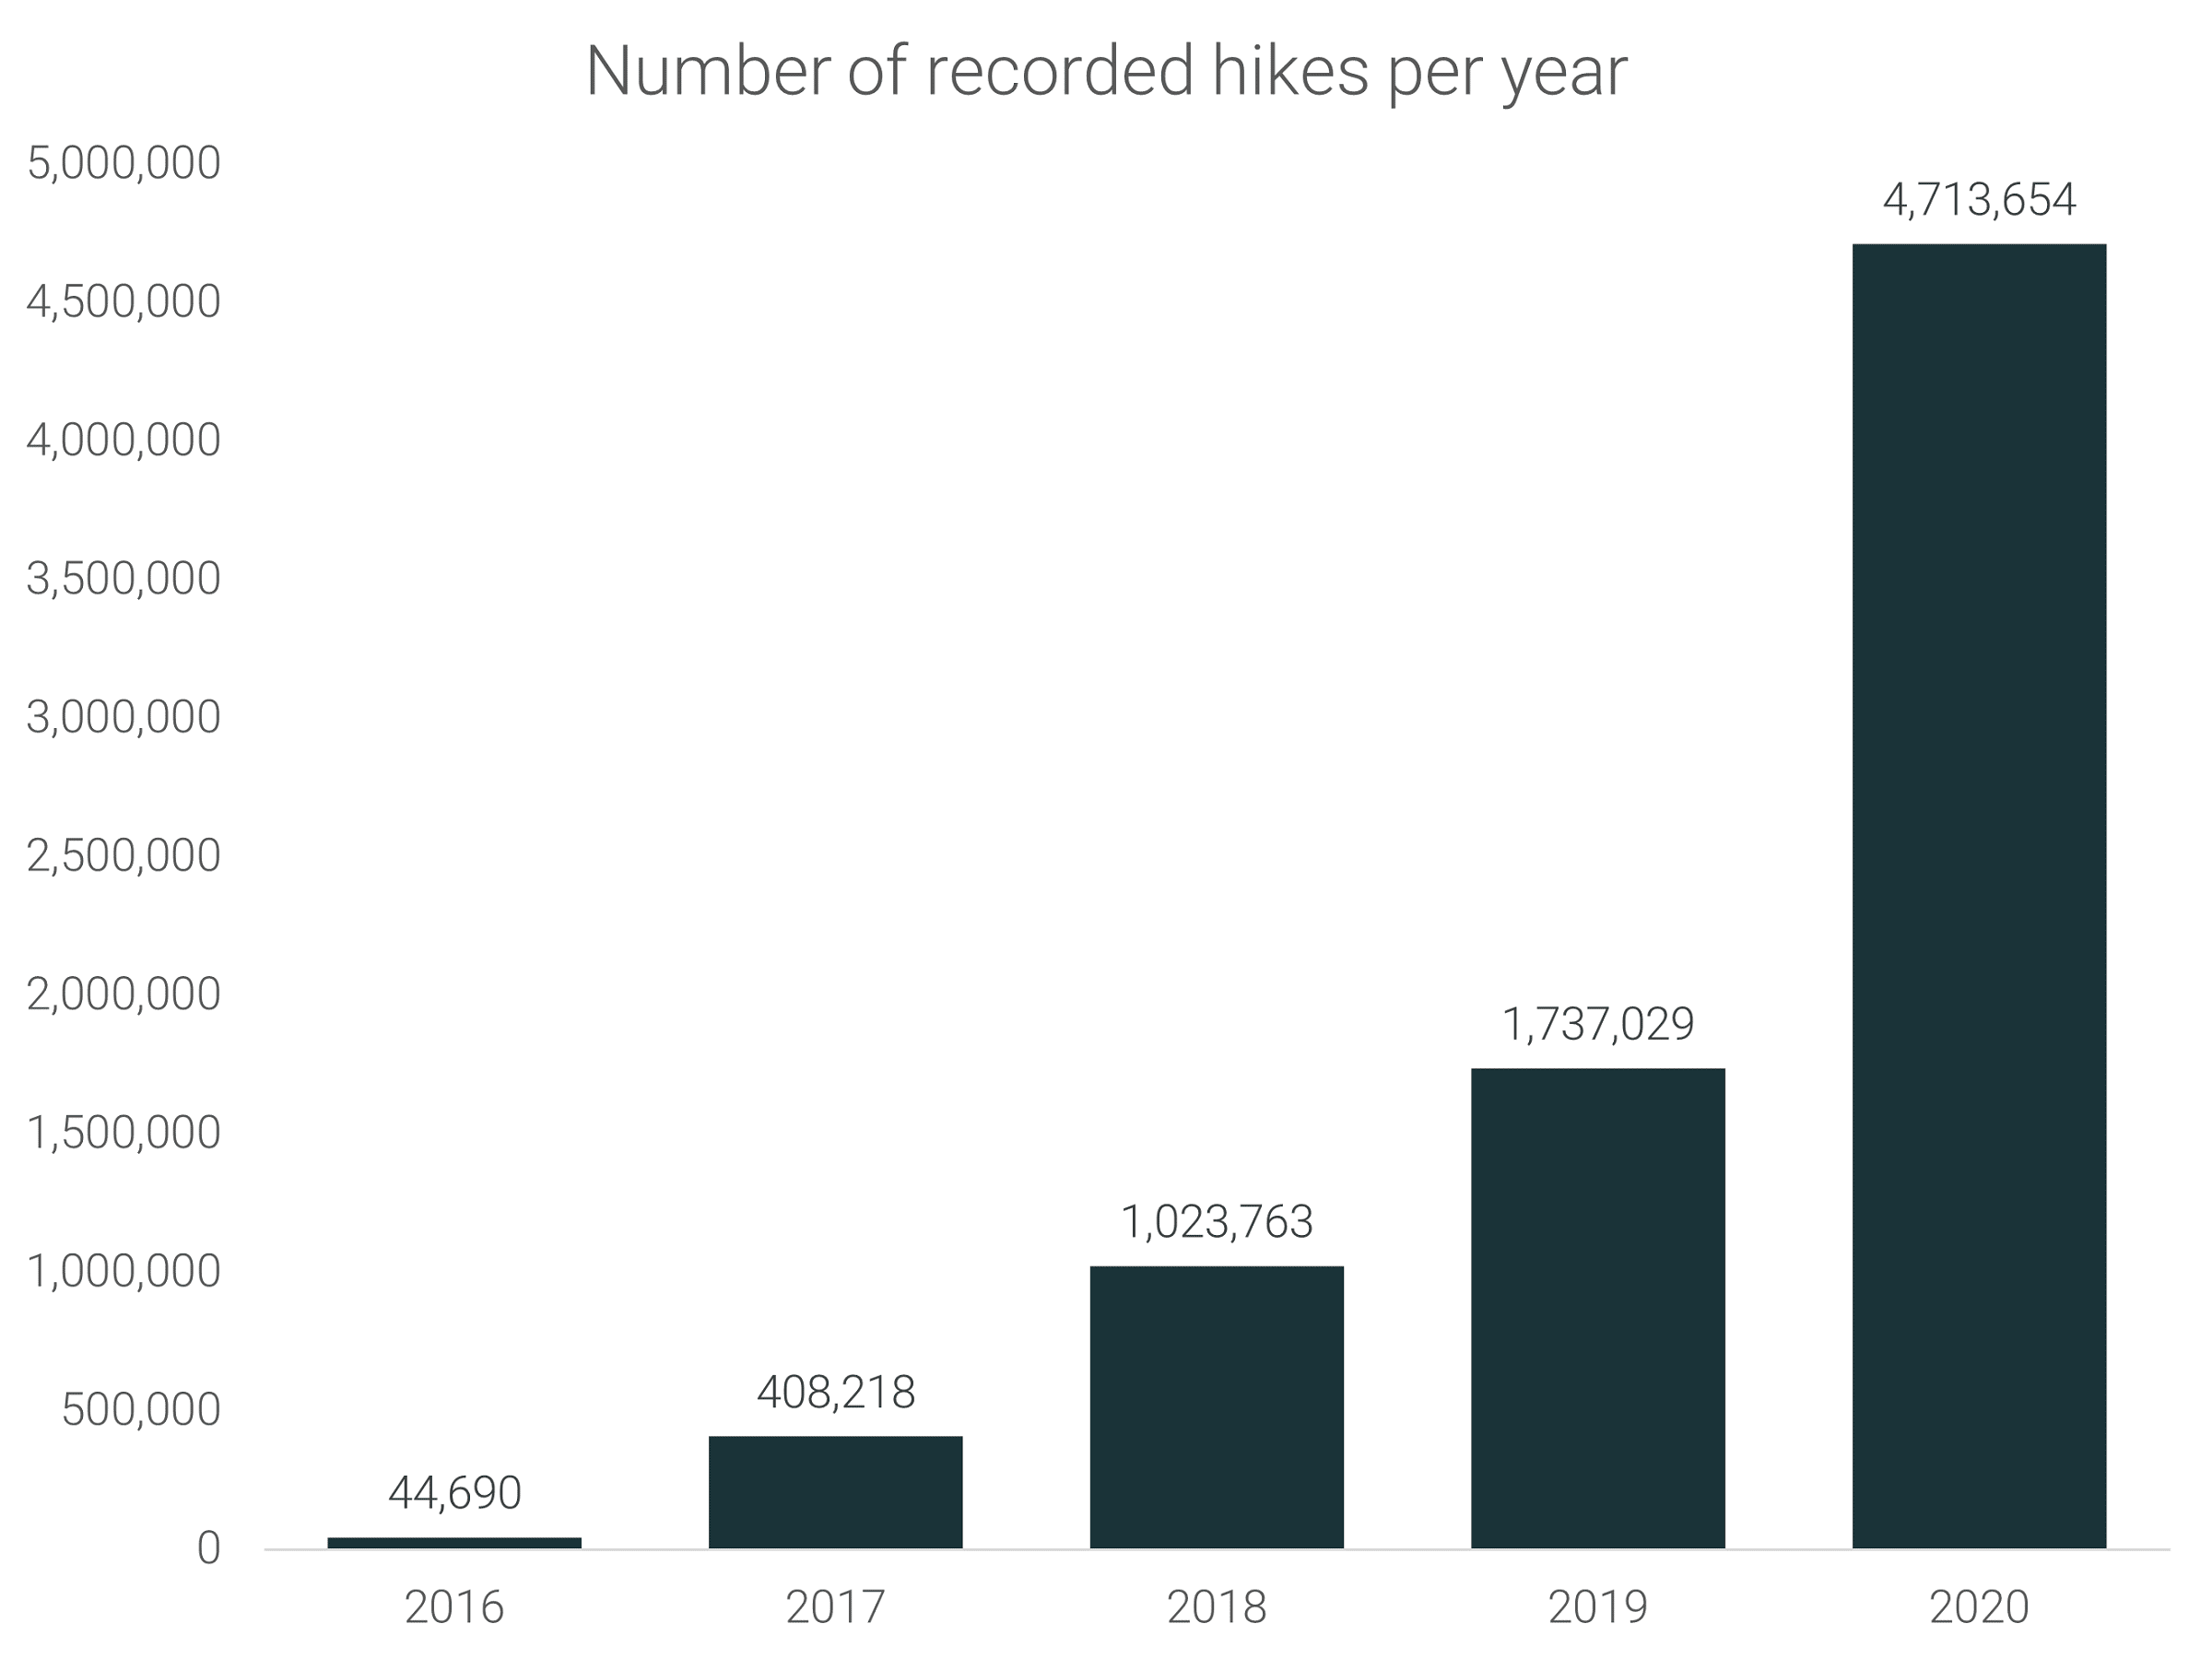
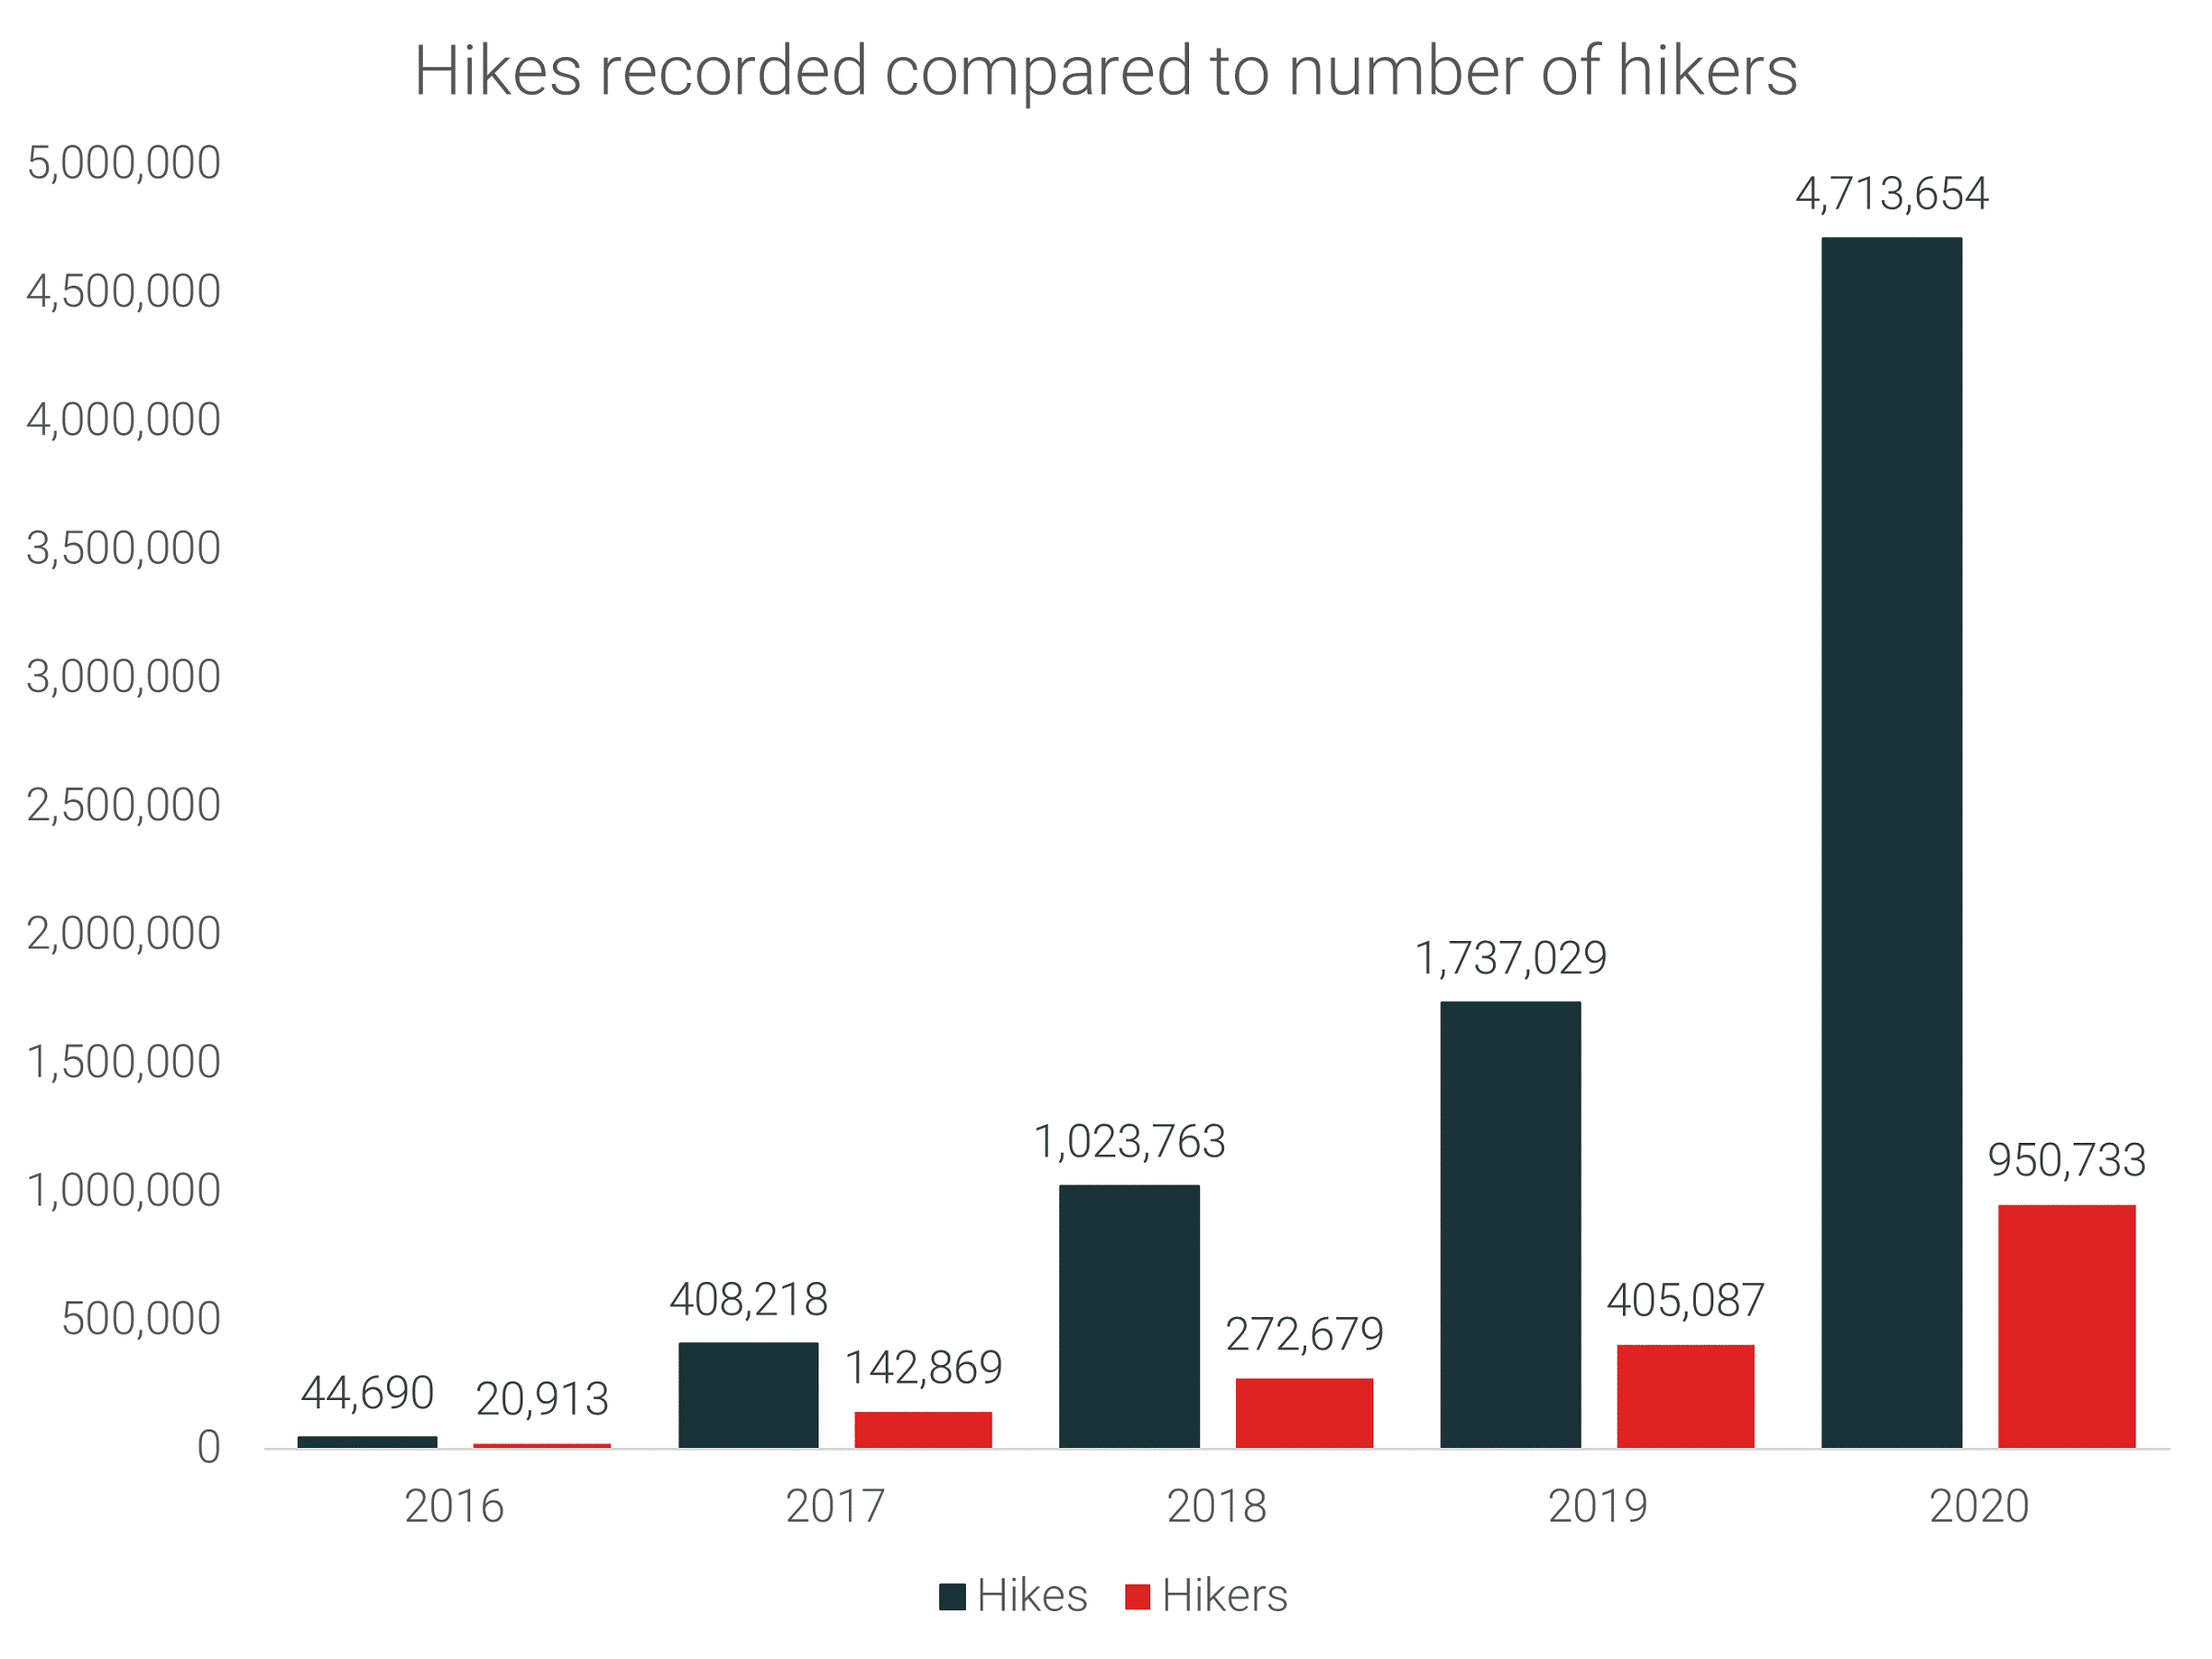
- The number of hikes logged in 2020 was up 171.36% compared to 2019
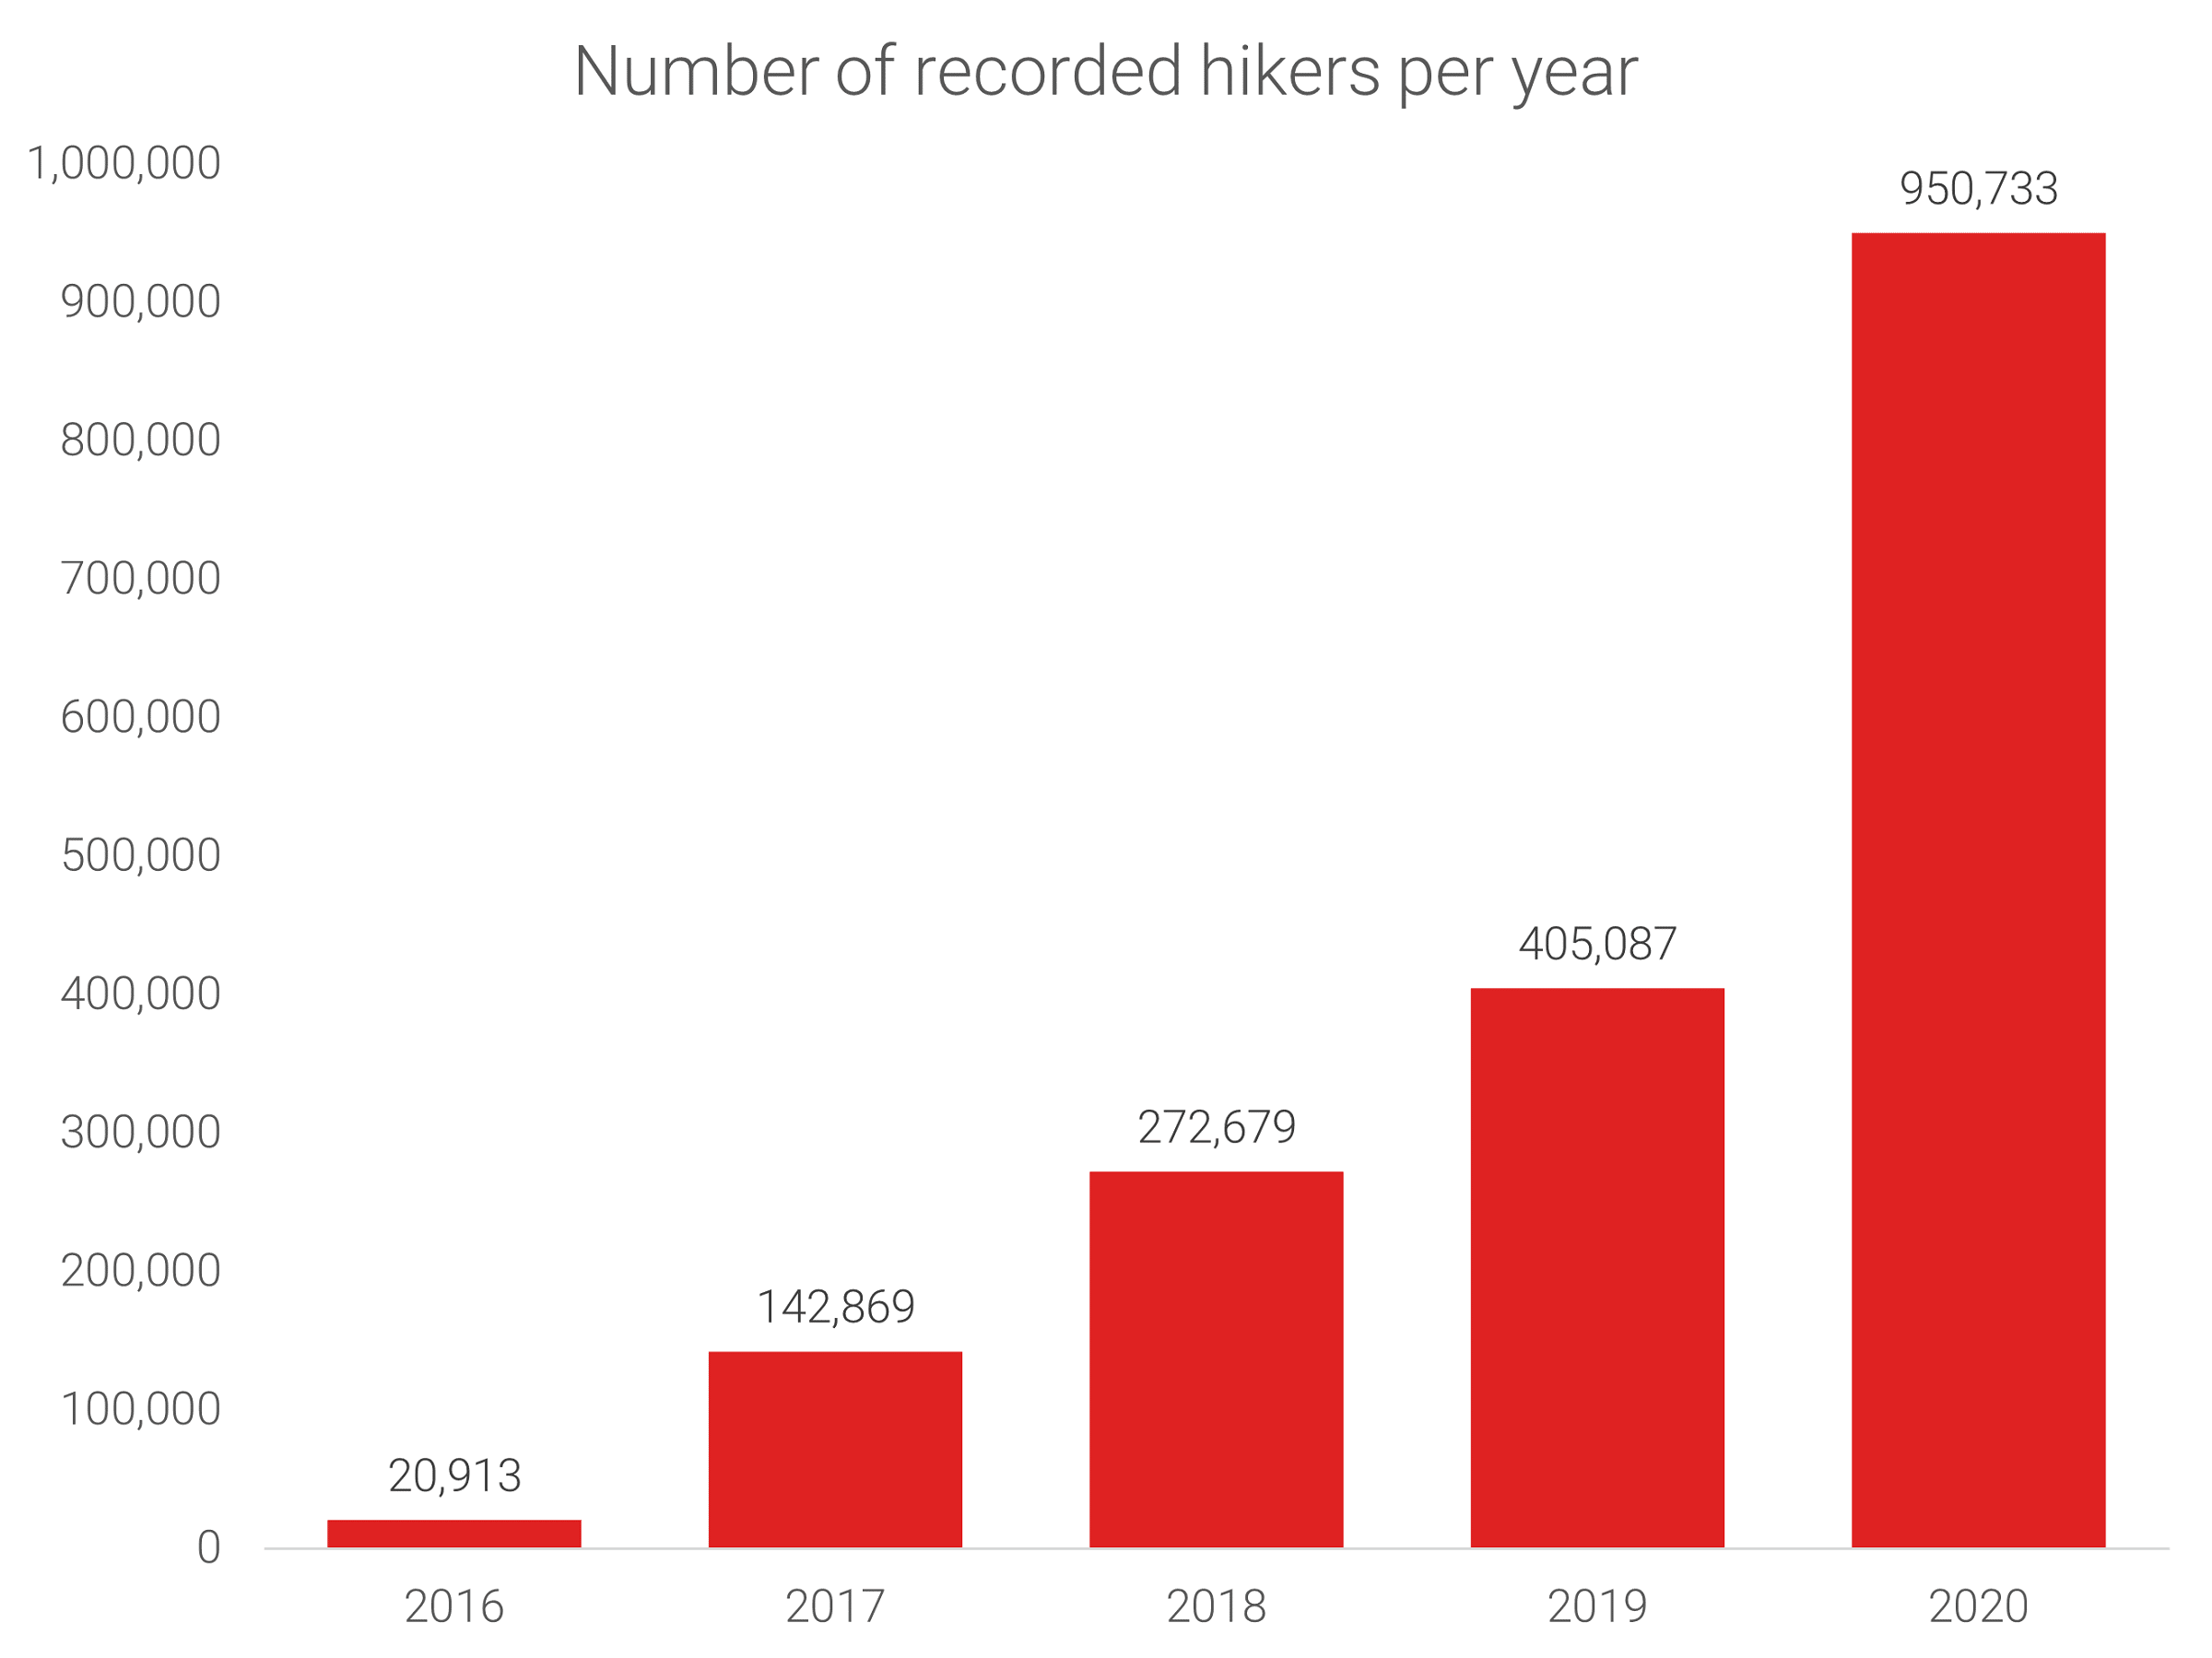
- The number of individual hikers in 2020 increased 134.7% compared to 2019
- The number of hikes logged per user (HPU) has increased by 52.12% in 2020 compared to the total for 2016-2019
Data and methodology
- Number of unique users: 1,363,204
- Number of hikes: 7,927,354
- Data was collected from 01/01/2016 through 12/15/2020.
- Removed values above 3 standard deviations away from the mean
- Considered only hikes that lasted at least 10 mins
- Removed activity if the moving average speed was above 8 km/h
General participation trends
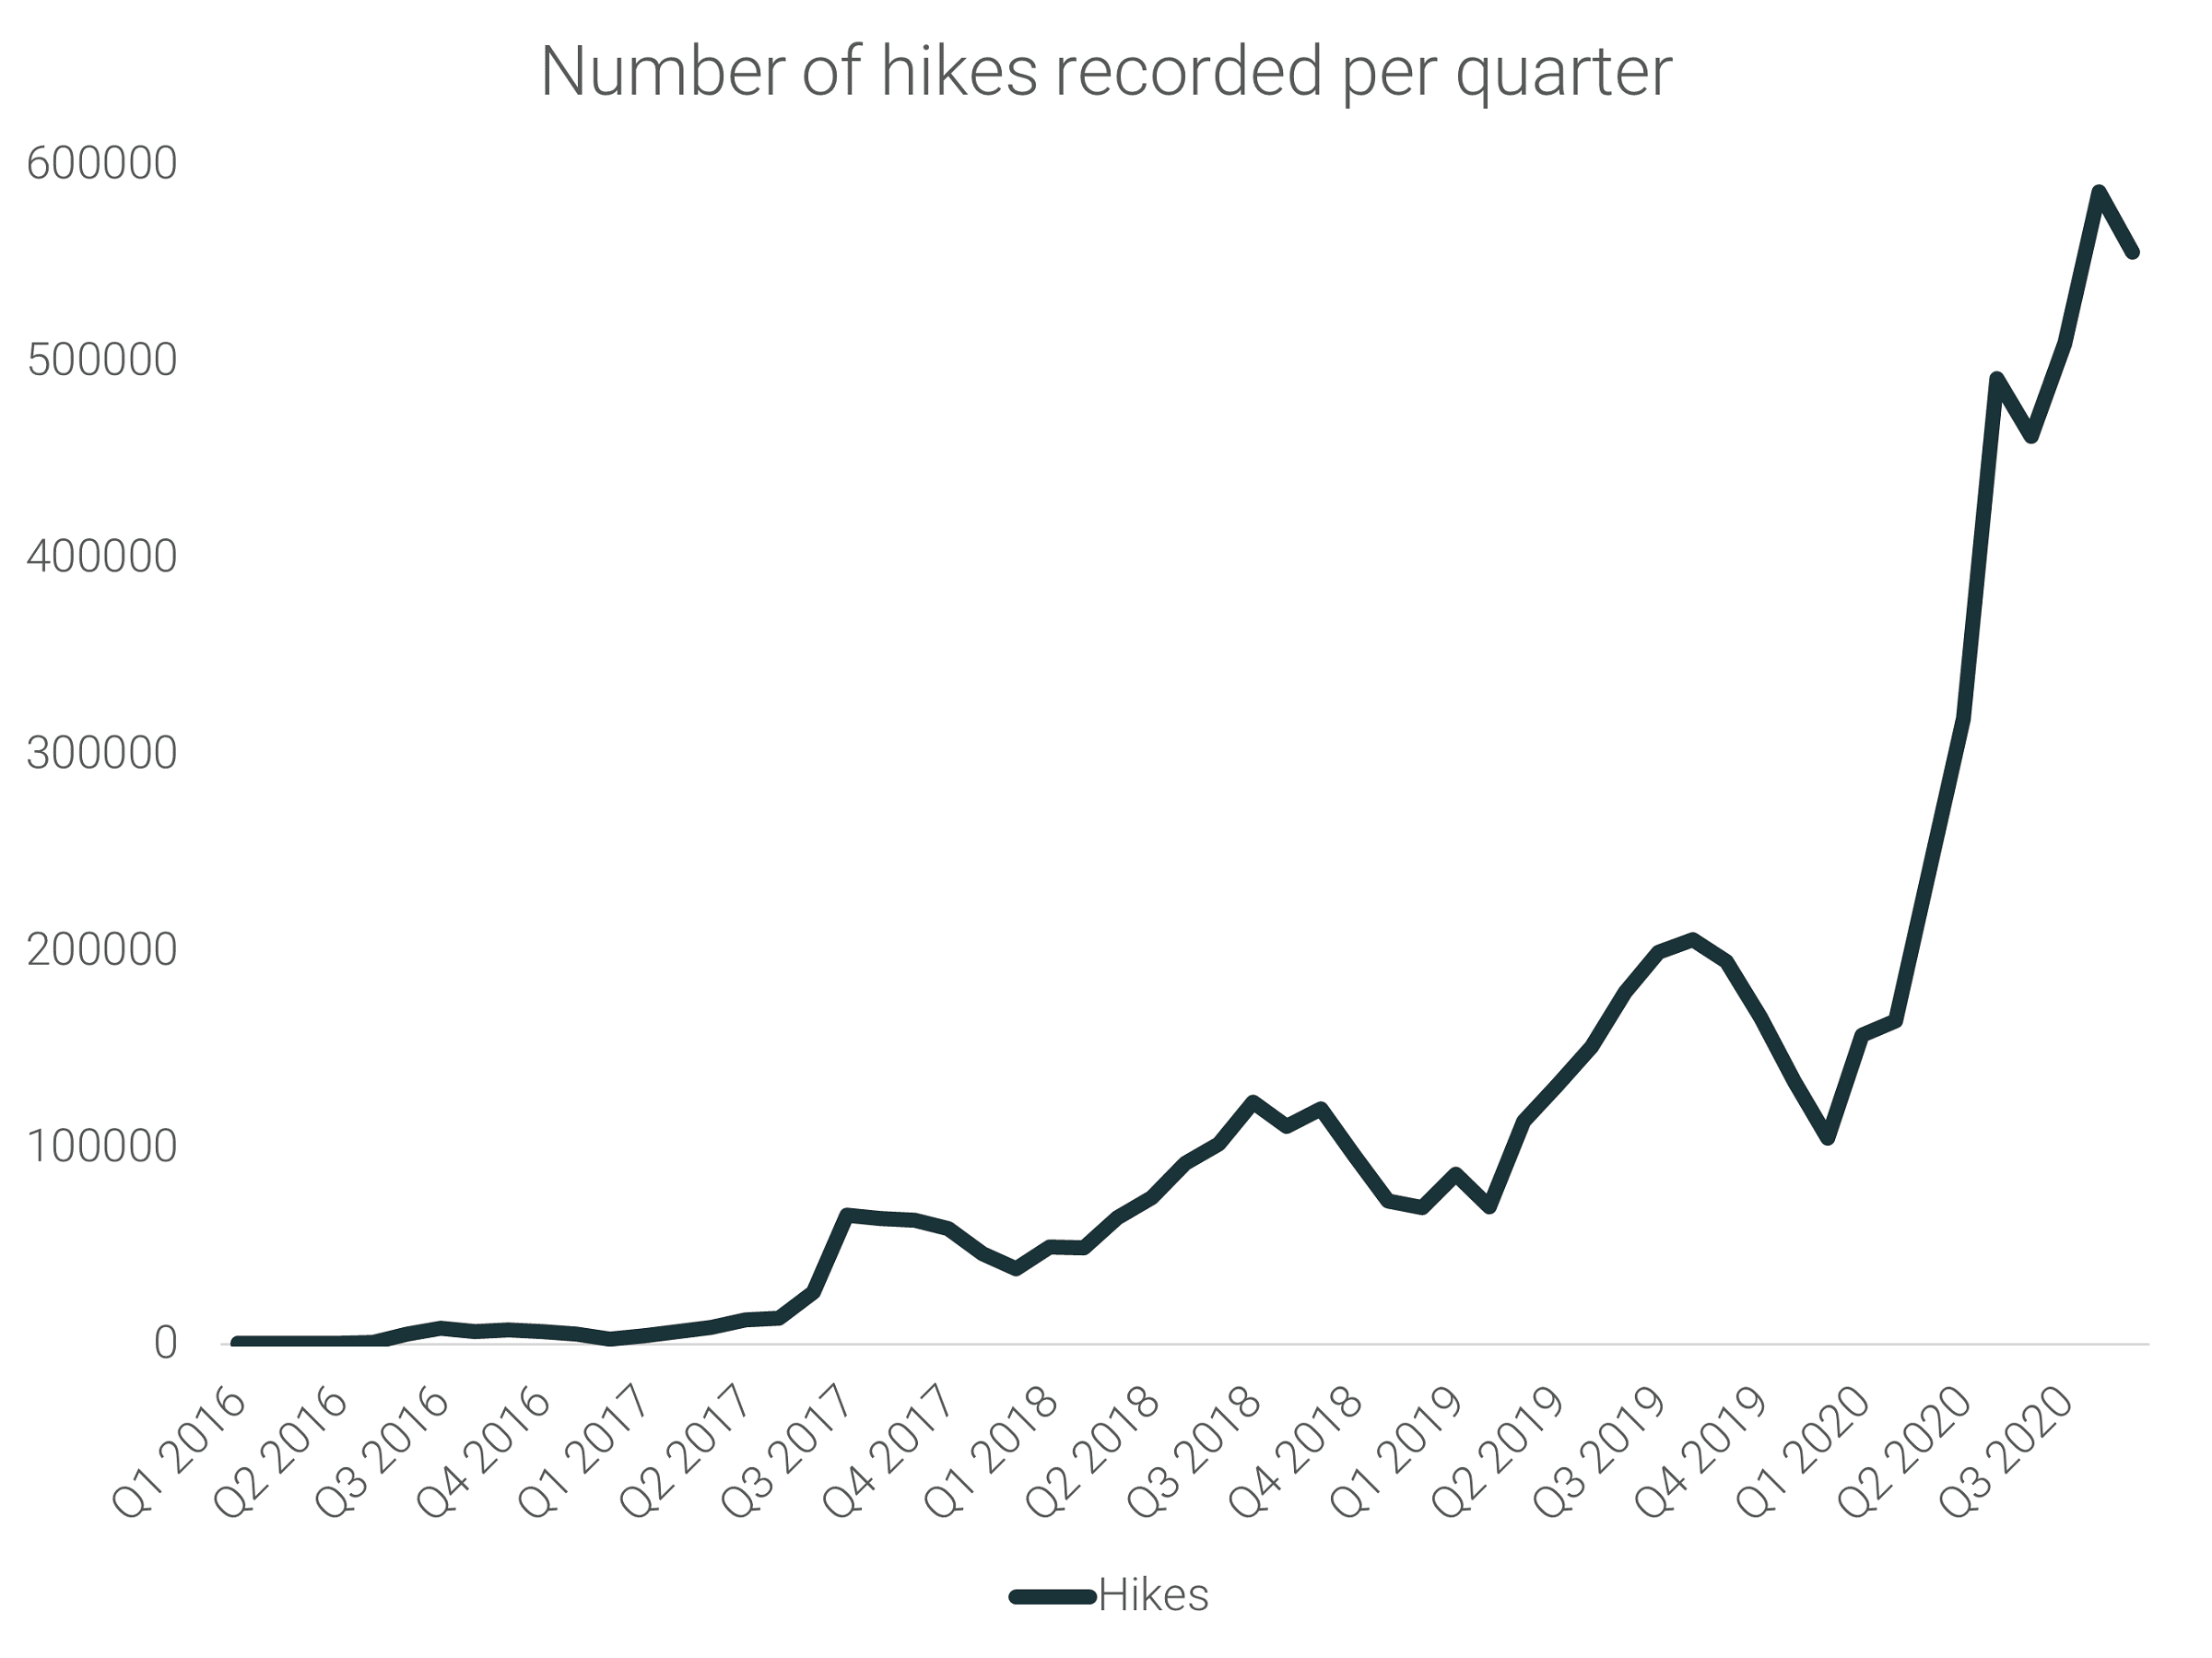
2020 saw big changes in the hiking world. With gyms closed early on in the pandemic, and social distancing in order around the globe, hiking saw bumps in the number of hikes, the number of users recording hikes, and hikes per user.
The biggest change in 2020, was the sheer volume of people hitting the trails. The number of logged hikes was up 171.36% compared to 2019 (4,713,654 vs 1,737,029).
When we compare 2020 to the previous 4 years combined (2016-2019), 2020 was still up 46.67% (4,713,654 vs 3,213,700).
The number of individual hikers also skyrocketed. In 2020, 134.7% more hikers hit the trails in 2020 vs 2019 (950,733 vs 405,087). That’s a 12.97% increase from the combined total of 2016-2019 (950,733 vs 841,548).
Not only were more people hiking in 2020, but the pandemic-stricken year also saw an increase in hikes per user (HPU), with hikers logging 52.12% more hikes in 2020 (4.96) than between 2016-2019 (3.26) combined.
HPU was up 15.62% in 2020 compared to 2019 (4.96 vs 4.28) , and up 32.05% compared to 2018 (4.96 vs 3.75).
COVID’s effects
Although there were more hikes logged and more hikers logging activity in 2020 than ever before, early on in the lockdown (April 2020) saw a lot of drastic changes in hiking behaviour.
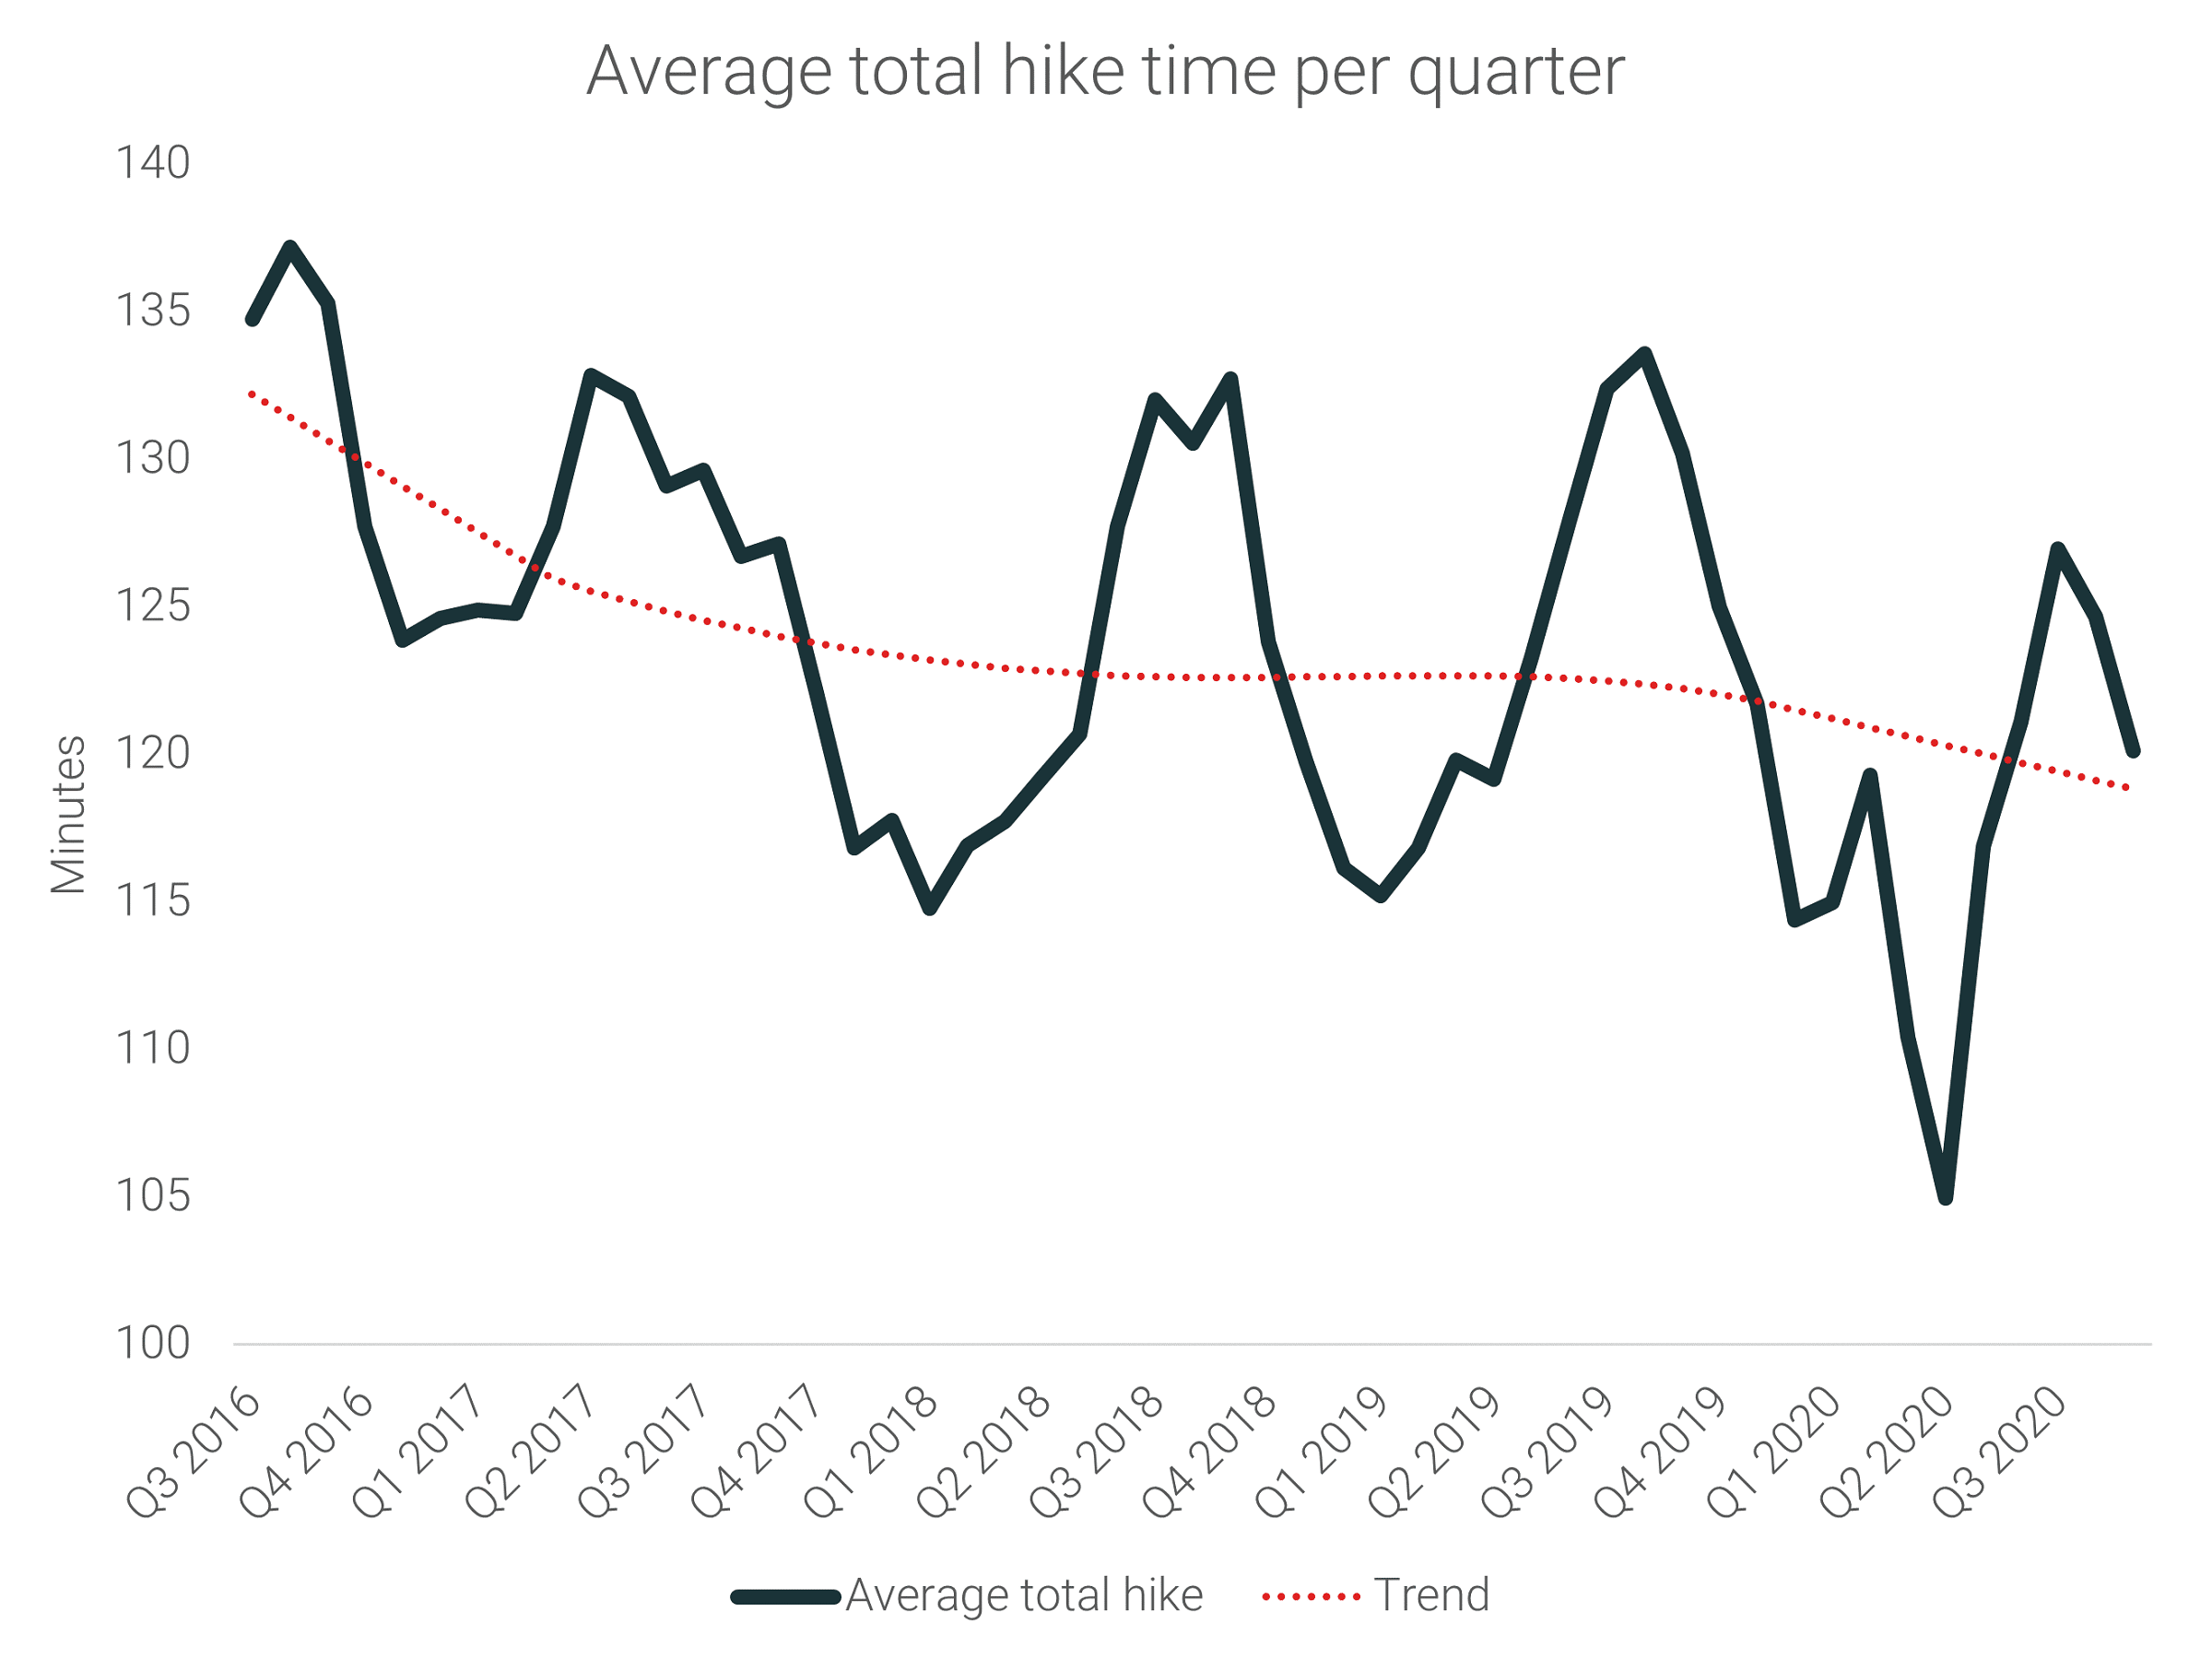
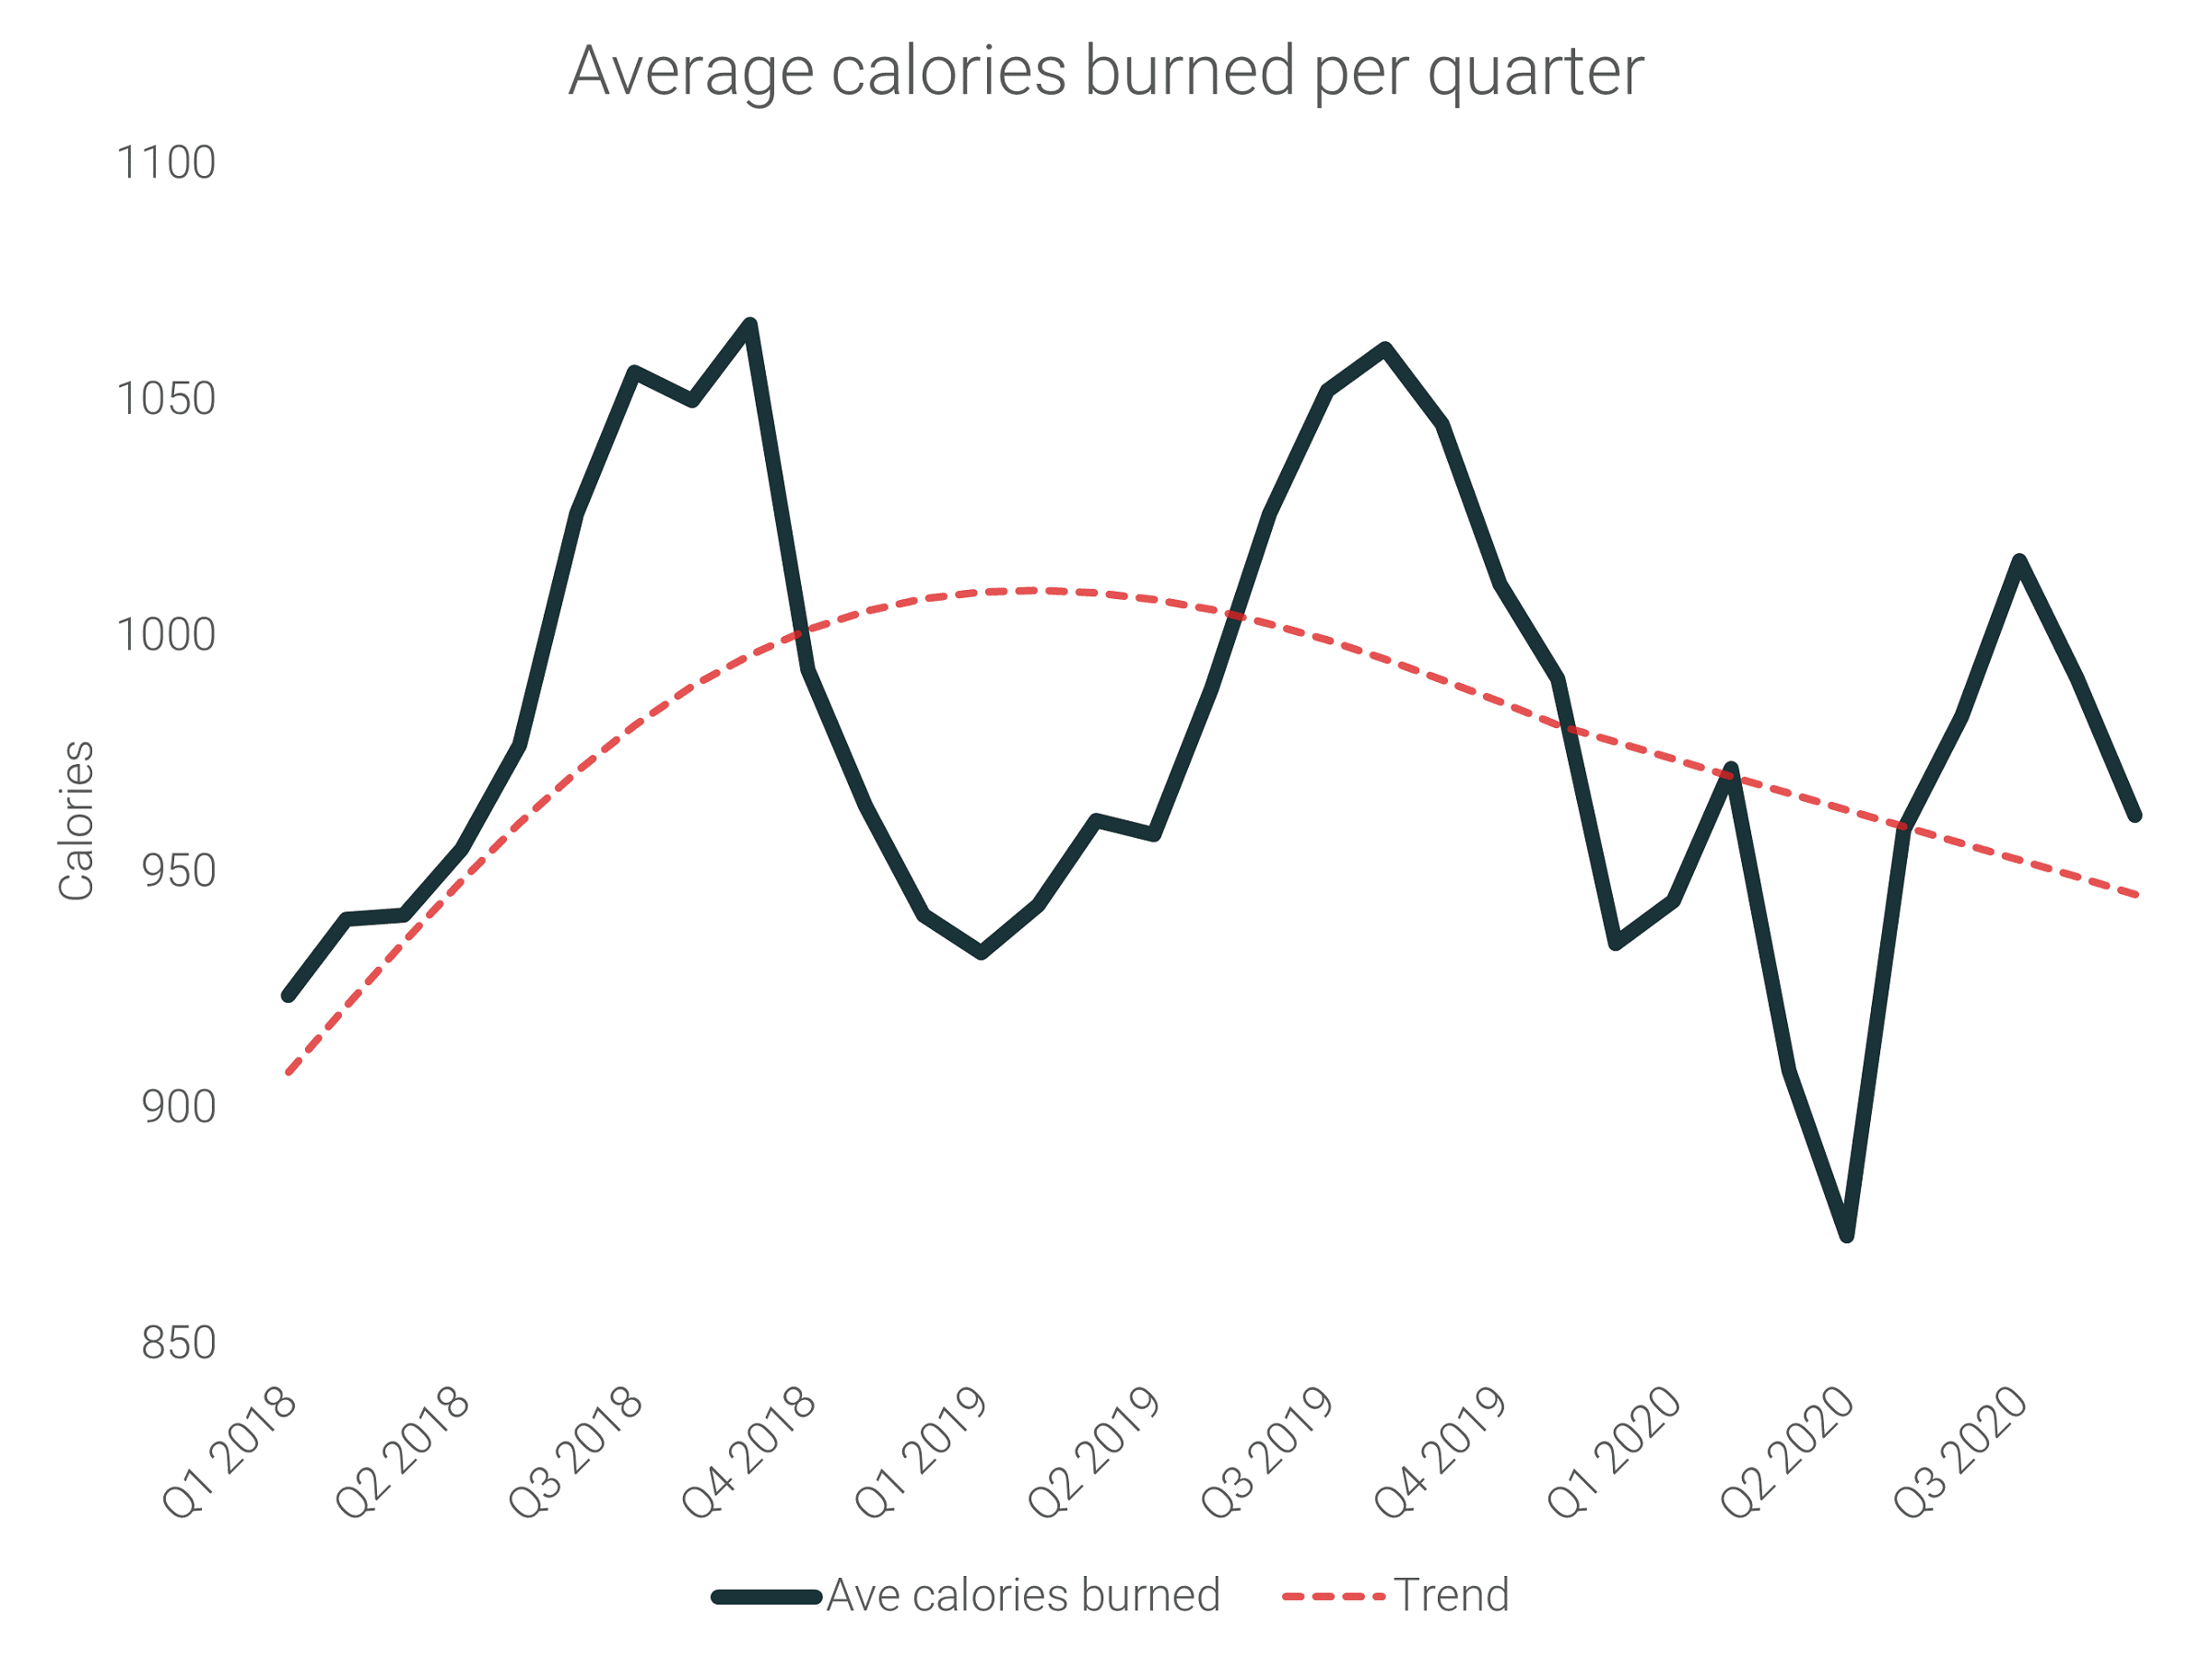
When we compare April 2020 to April 2018 and 2019, hiking took a hit. The average monthly hike time was down by 11.92%, and calories burned per month were down 8.73%.
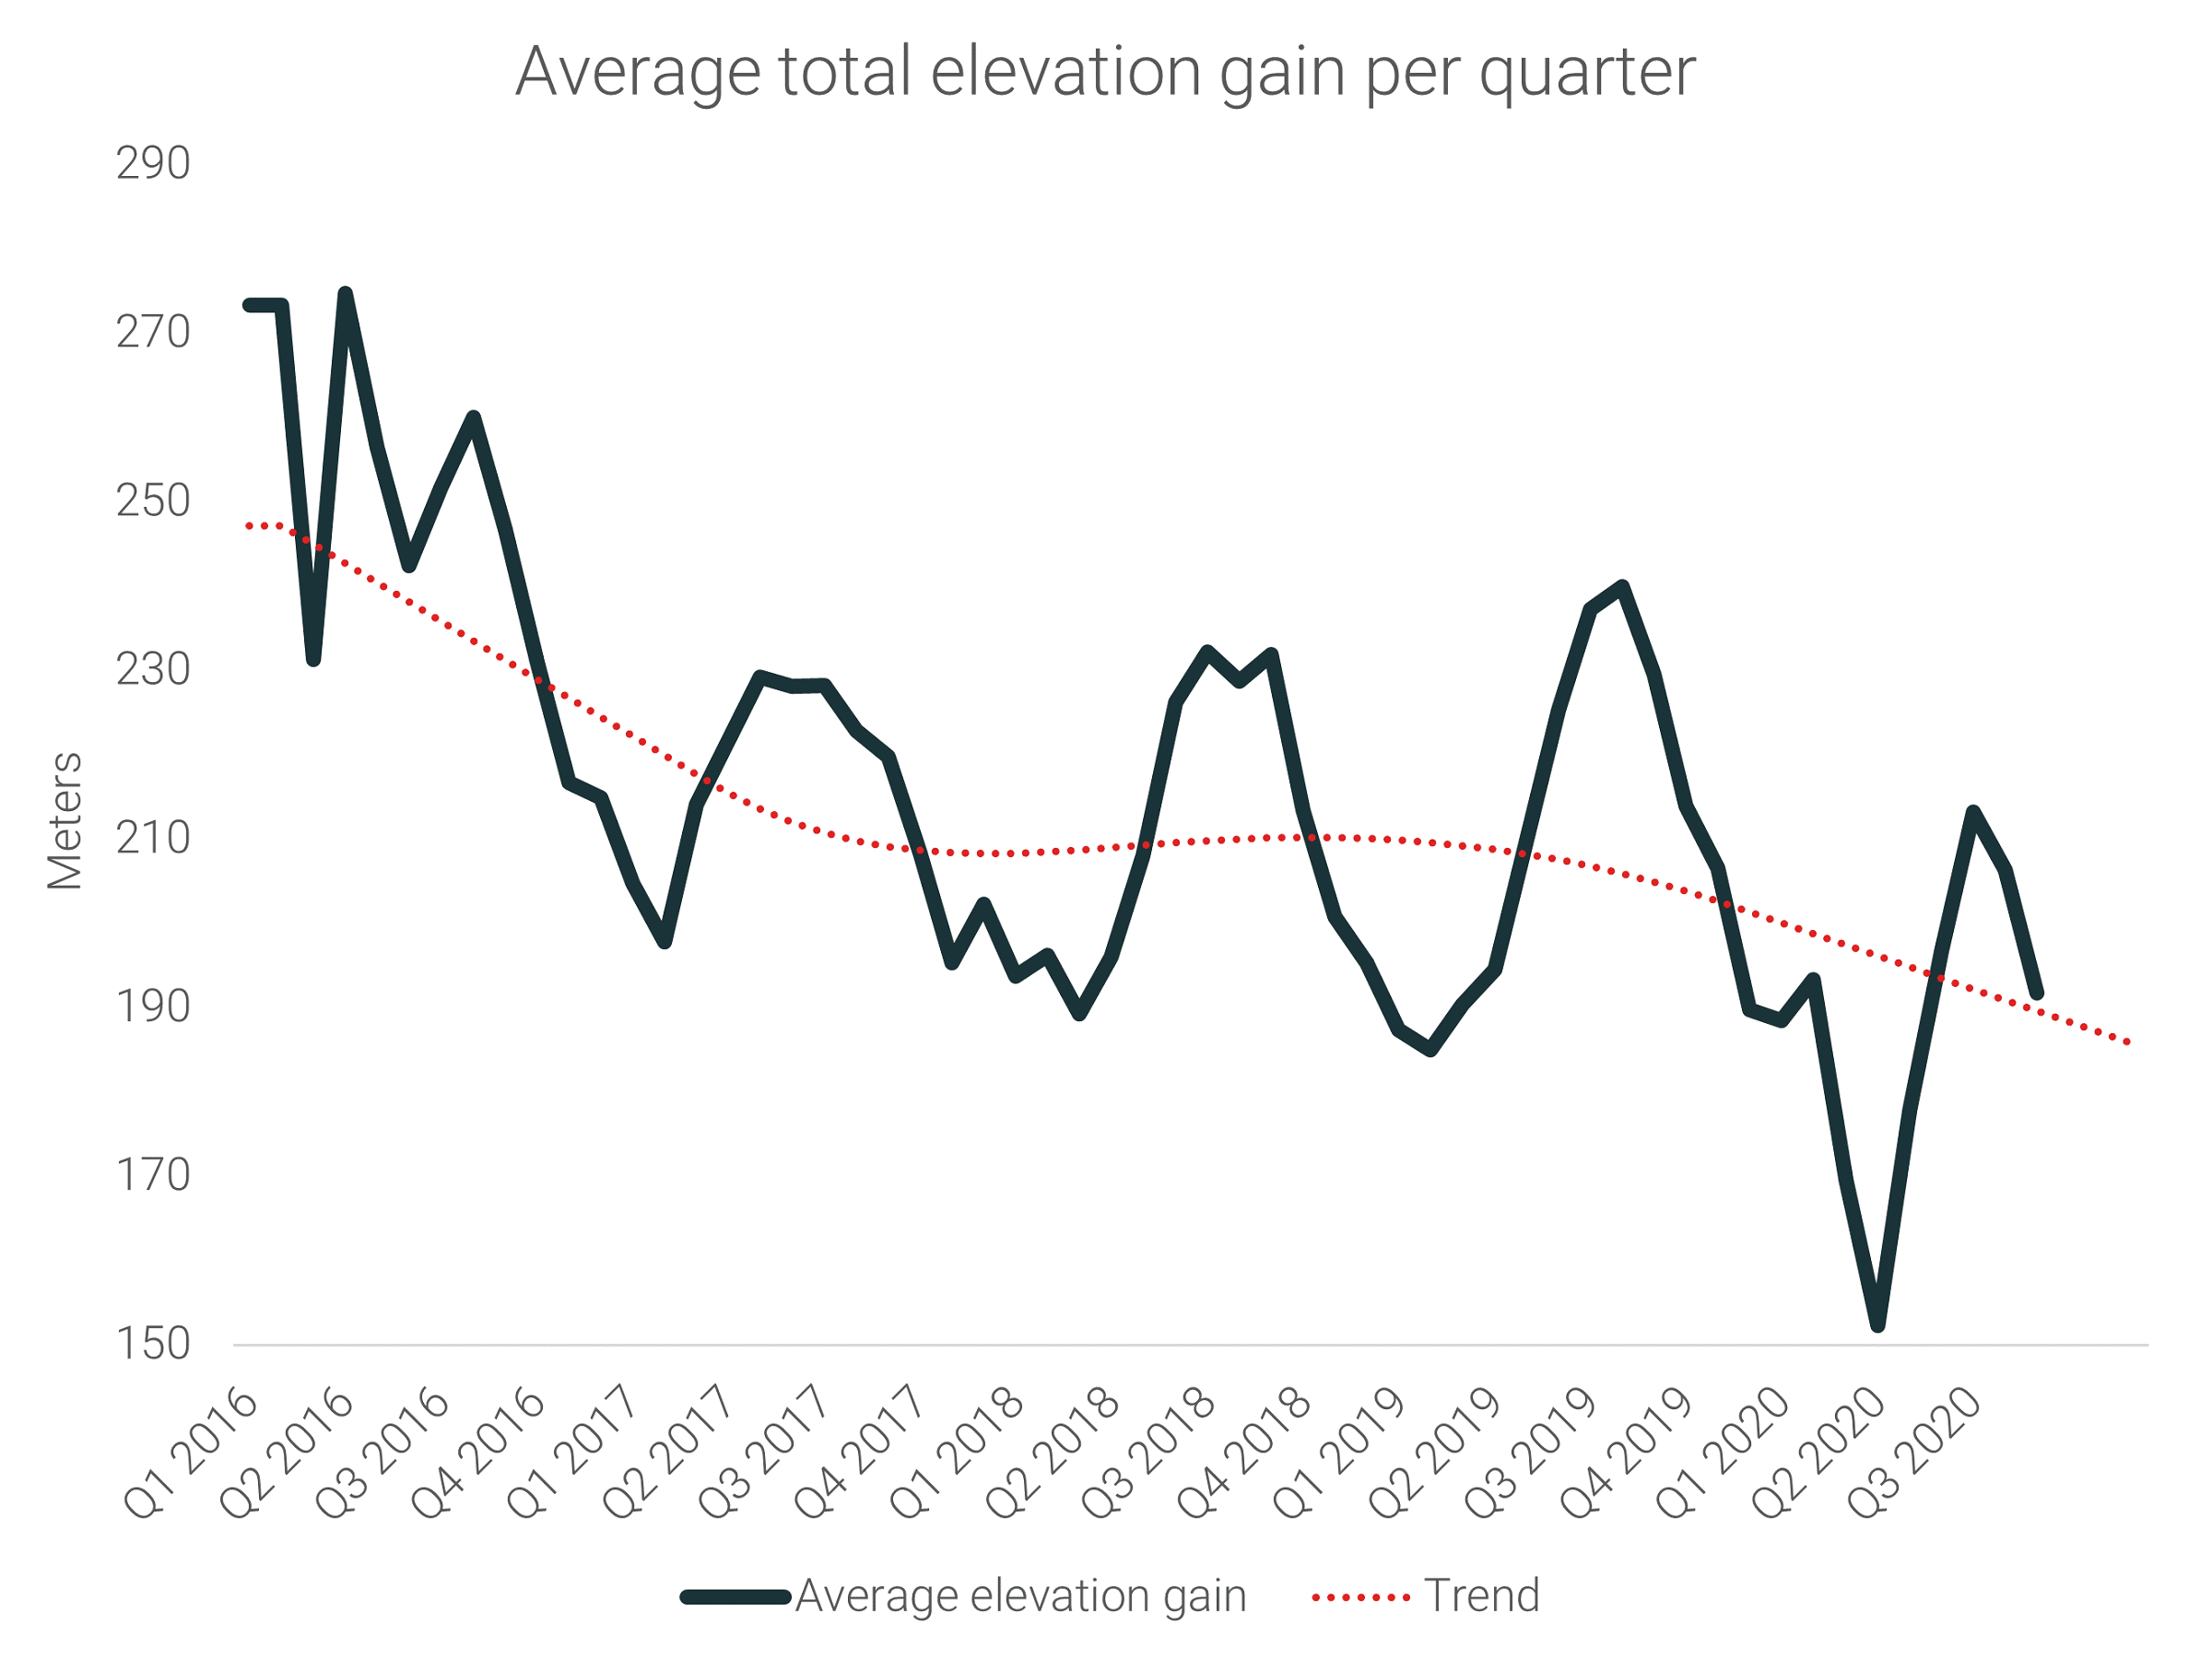
Hikes were getting easier too, average elevation gain per month decreased by 22.4%.
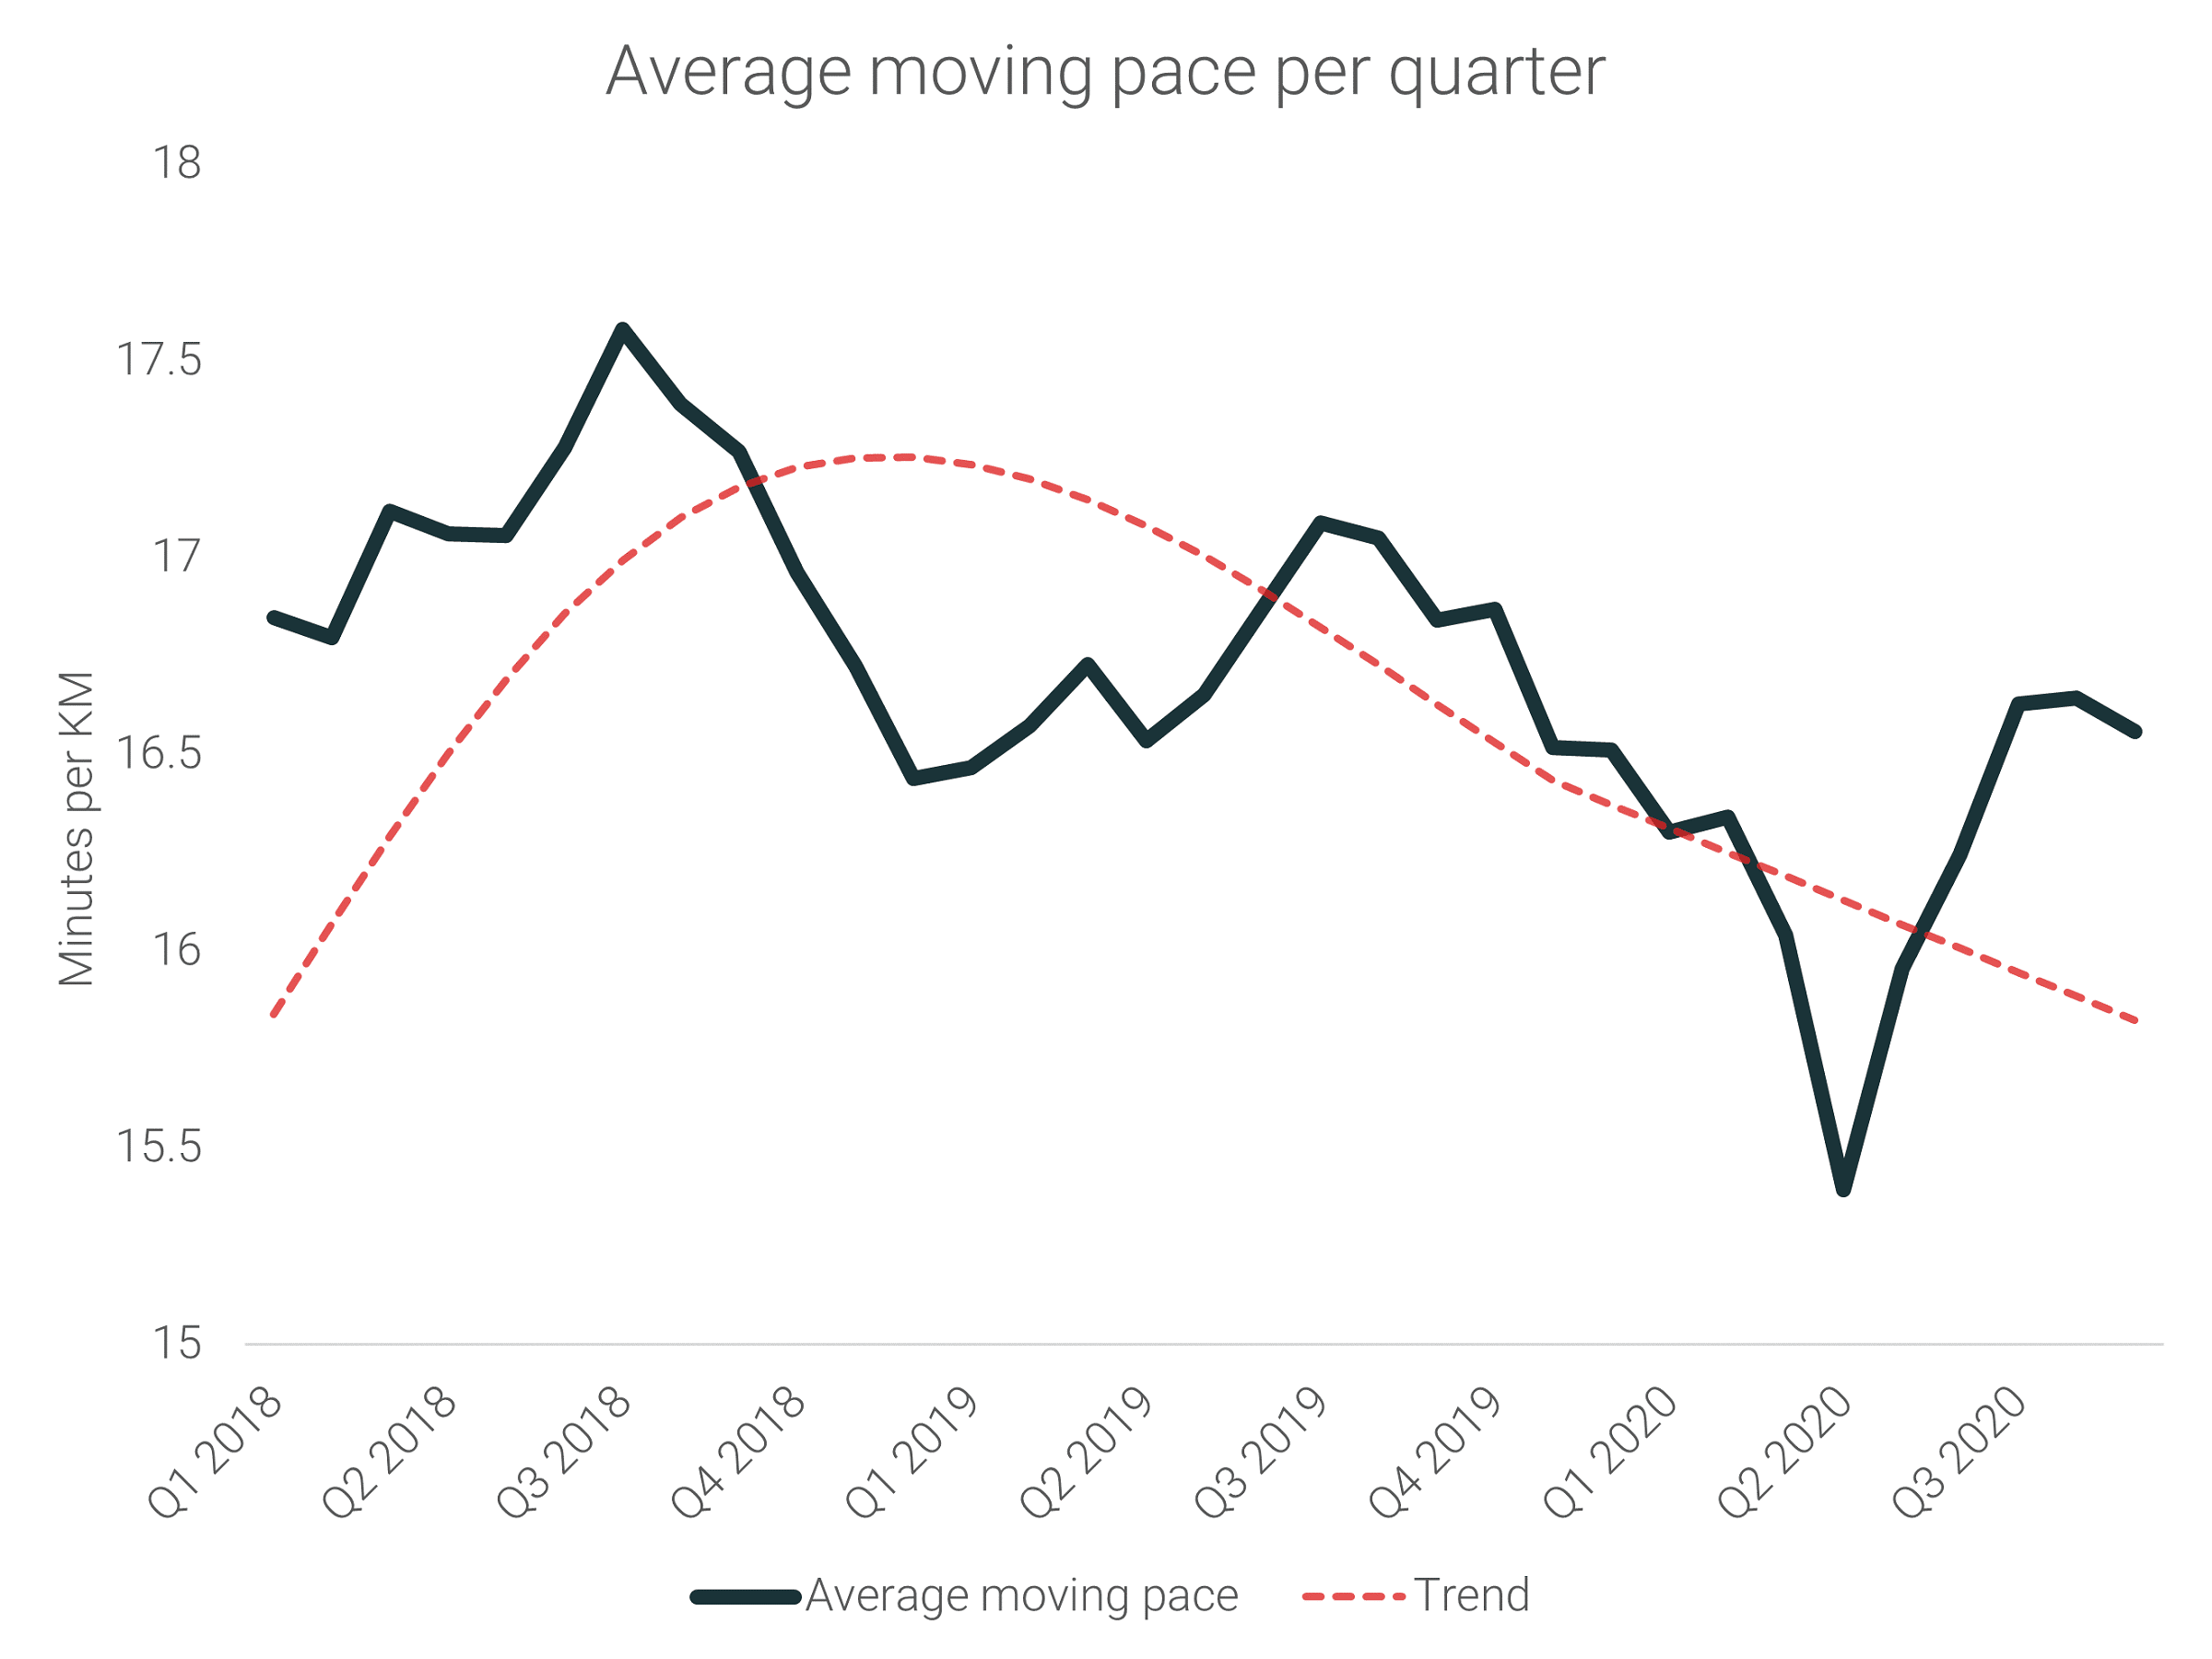
Oddly though, people seemed to be moving quicker in April 2020, whether to save time or for other motivations, the average moving pace was actually 8.4% faster in April 2020 than 2019.
Conclusion
Since April we’ve seen a rebound in hike time, calories burned, and elevation gain with thousands of participants recording more hikes than ever before, however, hikers are still logging less total time, burning fewer calories, and climbing less elevation than pre-pandemic.
More hikers are logging more hikes than ever though, presuming new hikers started, and continue, to hit the trails throughout this pandemic, and these new hikers are moving faster than we’ve seen over the past few years.
Hiking and the COVID-19 pandemic
As the number of hikers has exploded in 2020, RunRepeat is here to help you find the right hiking boots, hiking shoes, trail running shoes, hiking sandals, and everything in between to ensure that this continued crisis doesn’t keep you from hitting the trails.
Stay active and stay healthy as 2021 kicks off. If you need running shoes, training shoes, crossfit shoes, or even just a cool pair of trainers RunRepeat has all the info you’ll need to find the right kicks. We make sure that all the data we showcase is unbiased. We make this happen by testing the shoes on our own, dissecting them in our in-house lab, and buying them on our own.
Be sure to check out our in-depth studies on the sports we love and learn more about RunRepeat today.
Use of content
- We are happy to give interviews on the topic at any time. For this purpose or for print-use questions please reach out to Paul Ronto at paul@runrepeat.com.
- Feel free to use material from this page in any web coverage of the topic, we just ask that you refer, and link, back to this original source.
- Thanks again to AllTrails for partnering with us to create this piece. Find your next favourite trail by joining the AllTrails network of over 200K trails and 25 million explorers.
