Footwear Production Statistics
In 2021, 22.2 billion pairs of shoes were manufactured worldwide. That is equivalent to 704 shoes every second! Learn more interesting facts and figures about footwear production— the ins and outs, the then and now, and what lies ahead.
Top footwear production statistics
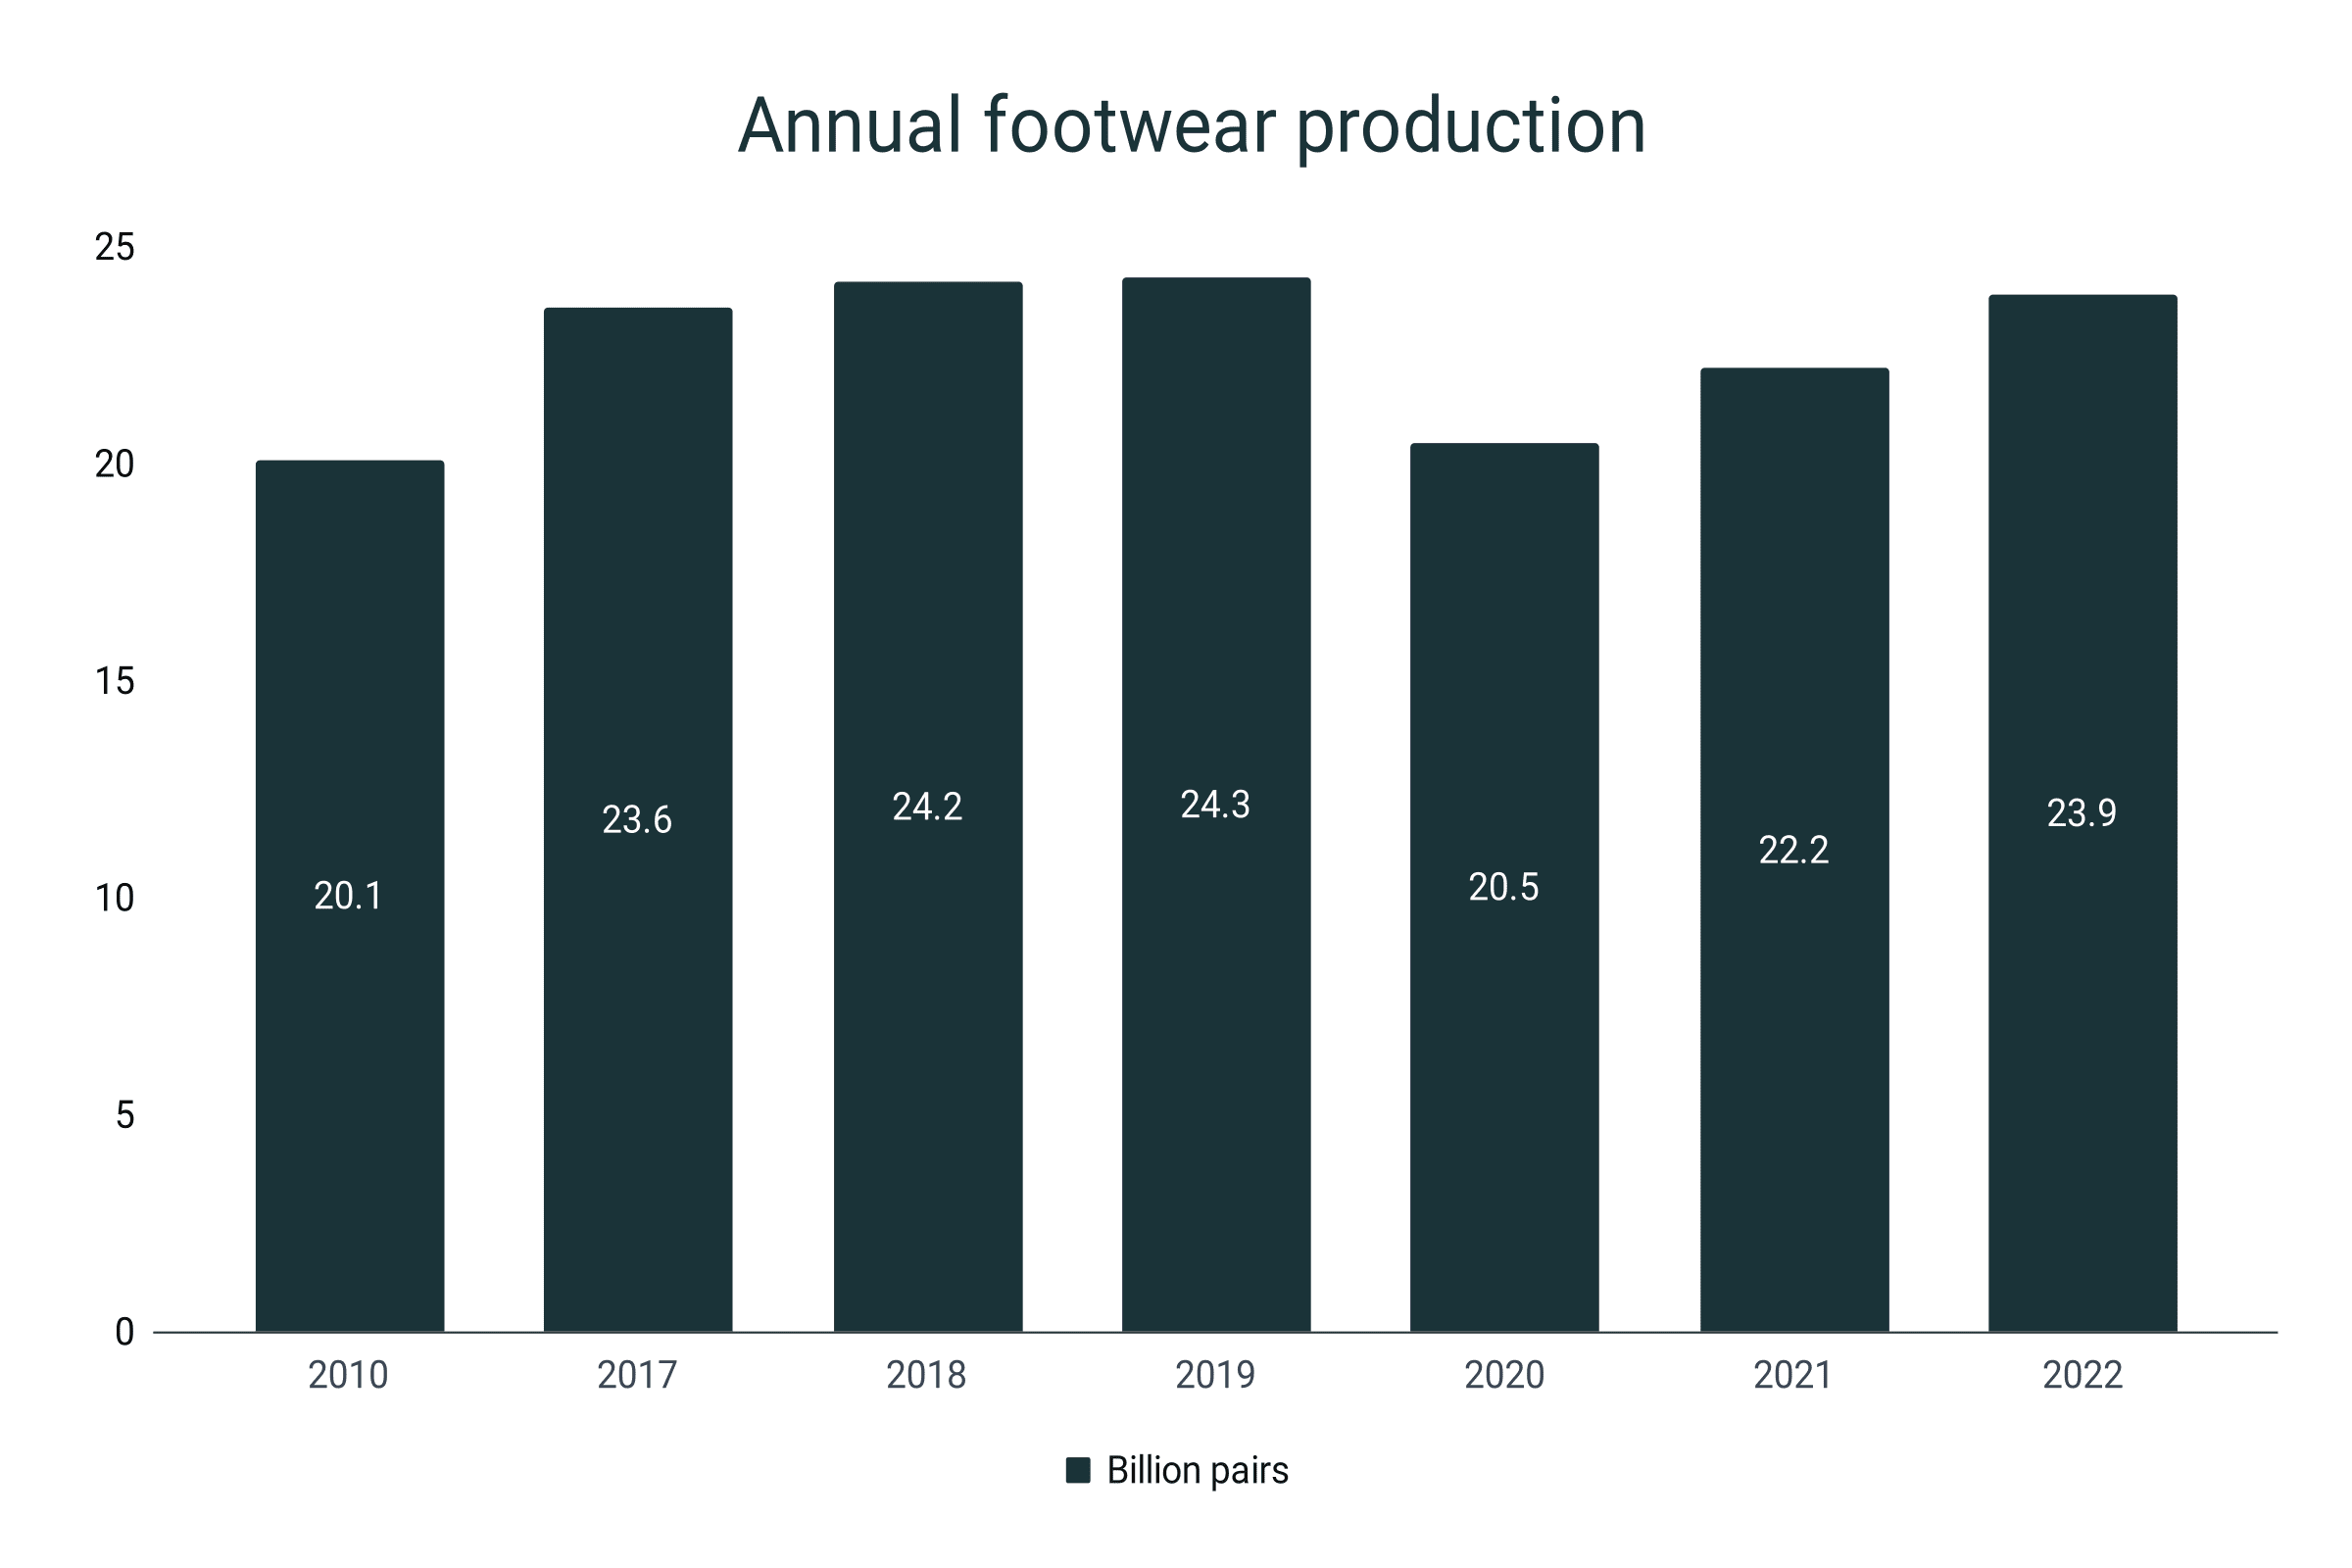
- The total number of shoe pairs produced in 2022 reached 23.9 billion.
- Post-pandemic, footwear production recovered by 8.3%, from a 20.5 billion output in 2020 to a 22.2 billion total in 2021.
- However, it was still below the record-high 24.3 billion pairs of shoes manufactured in 2019, right before the pandemic.
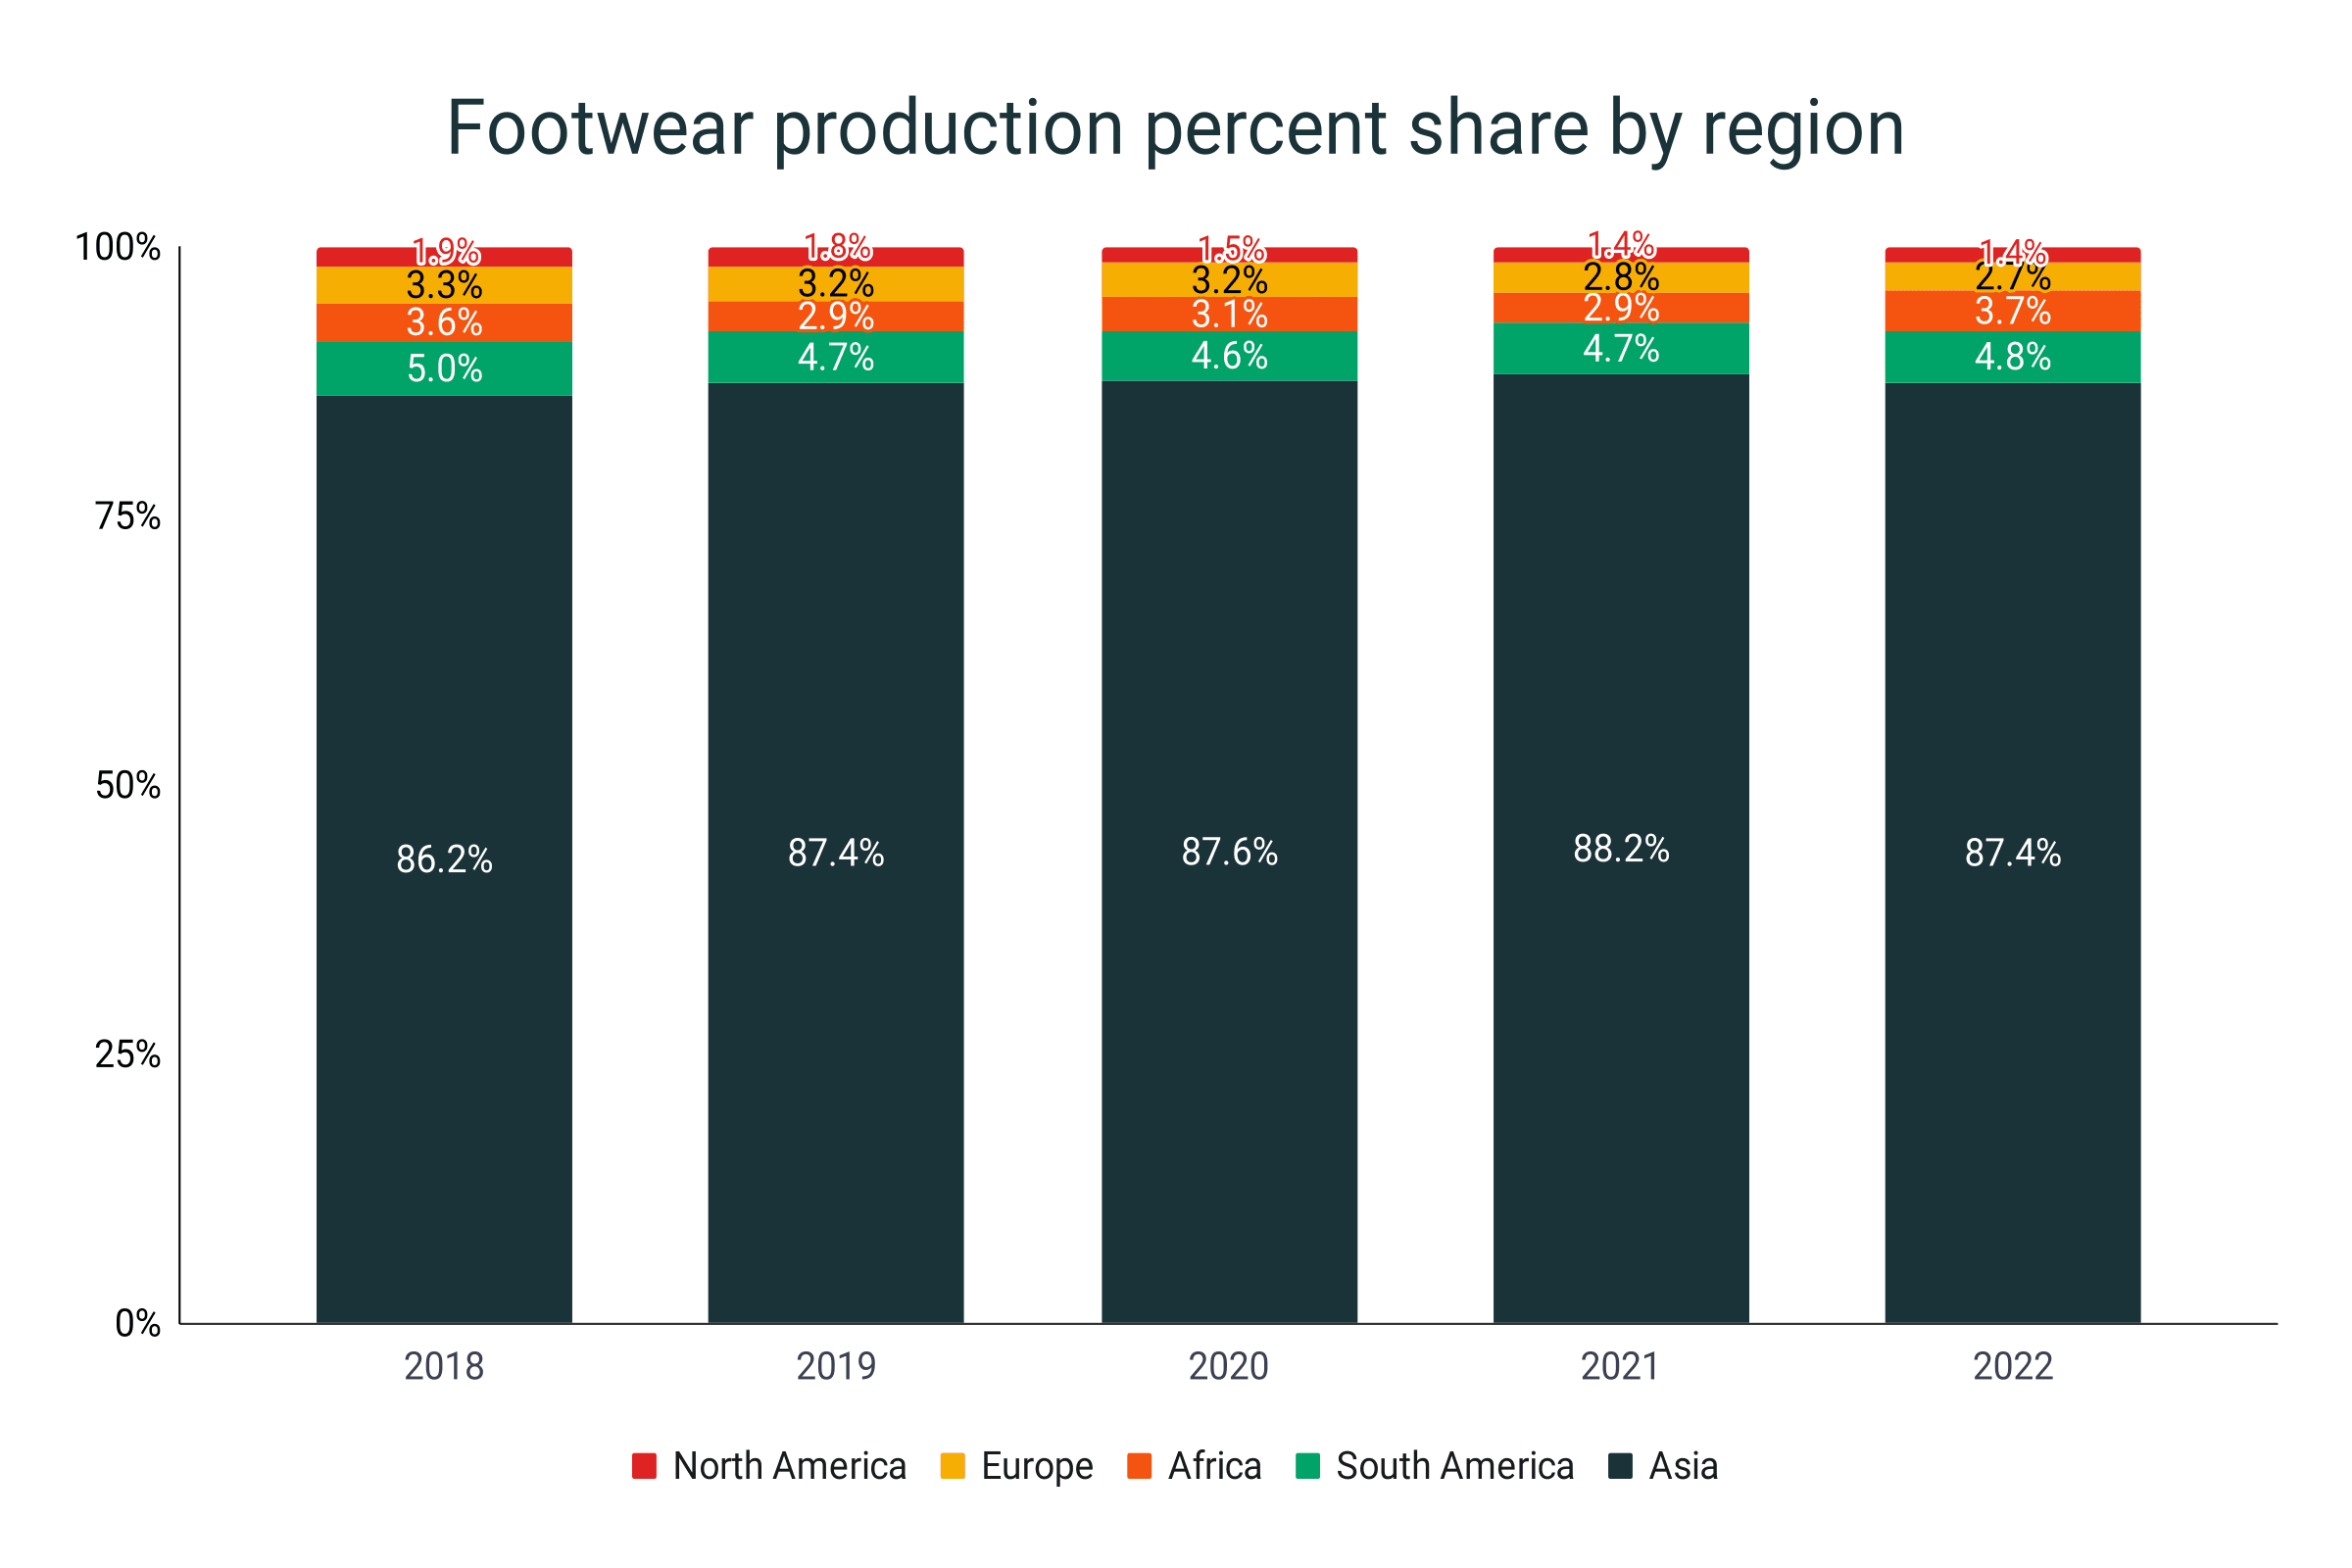
- Asia produced 87.4% of all shoes in 2022. Coincidentally, the average percent share of Asia in total footwear production from 2018-2022 was also 87.4%.
- In 2022, South America was the source of 4.8% of all shoes produced. Africa took the 3rd spot with a 3.7% portion.
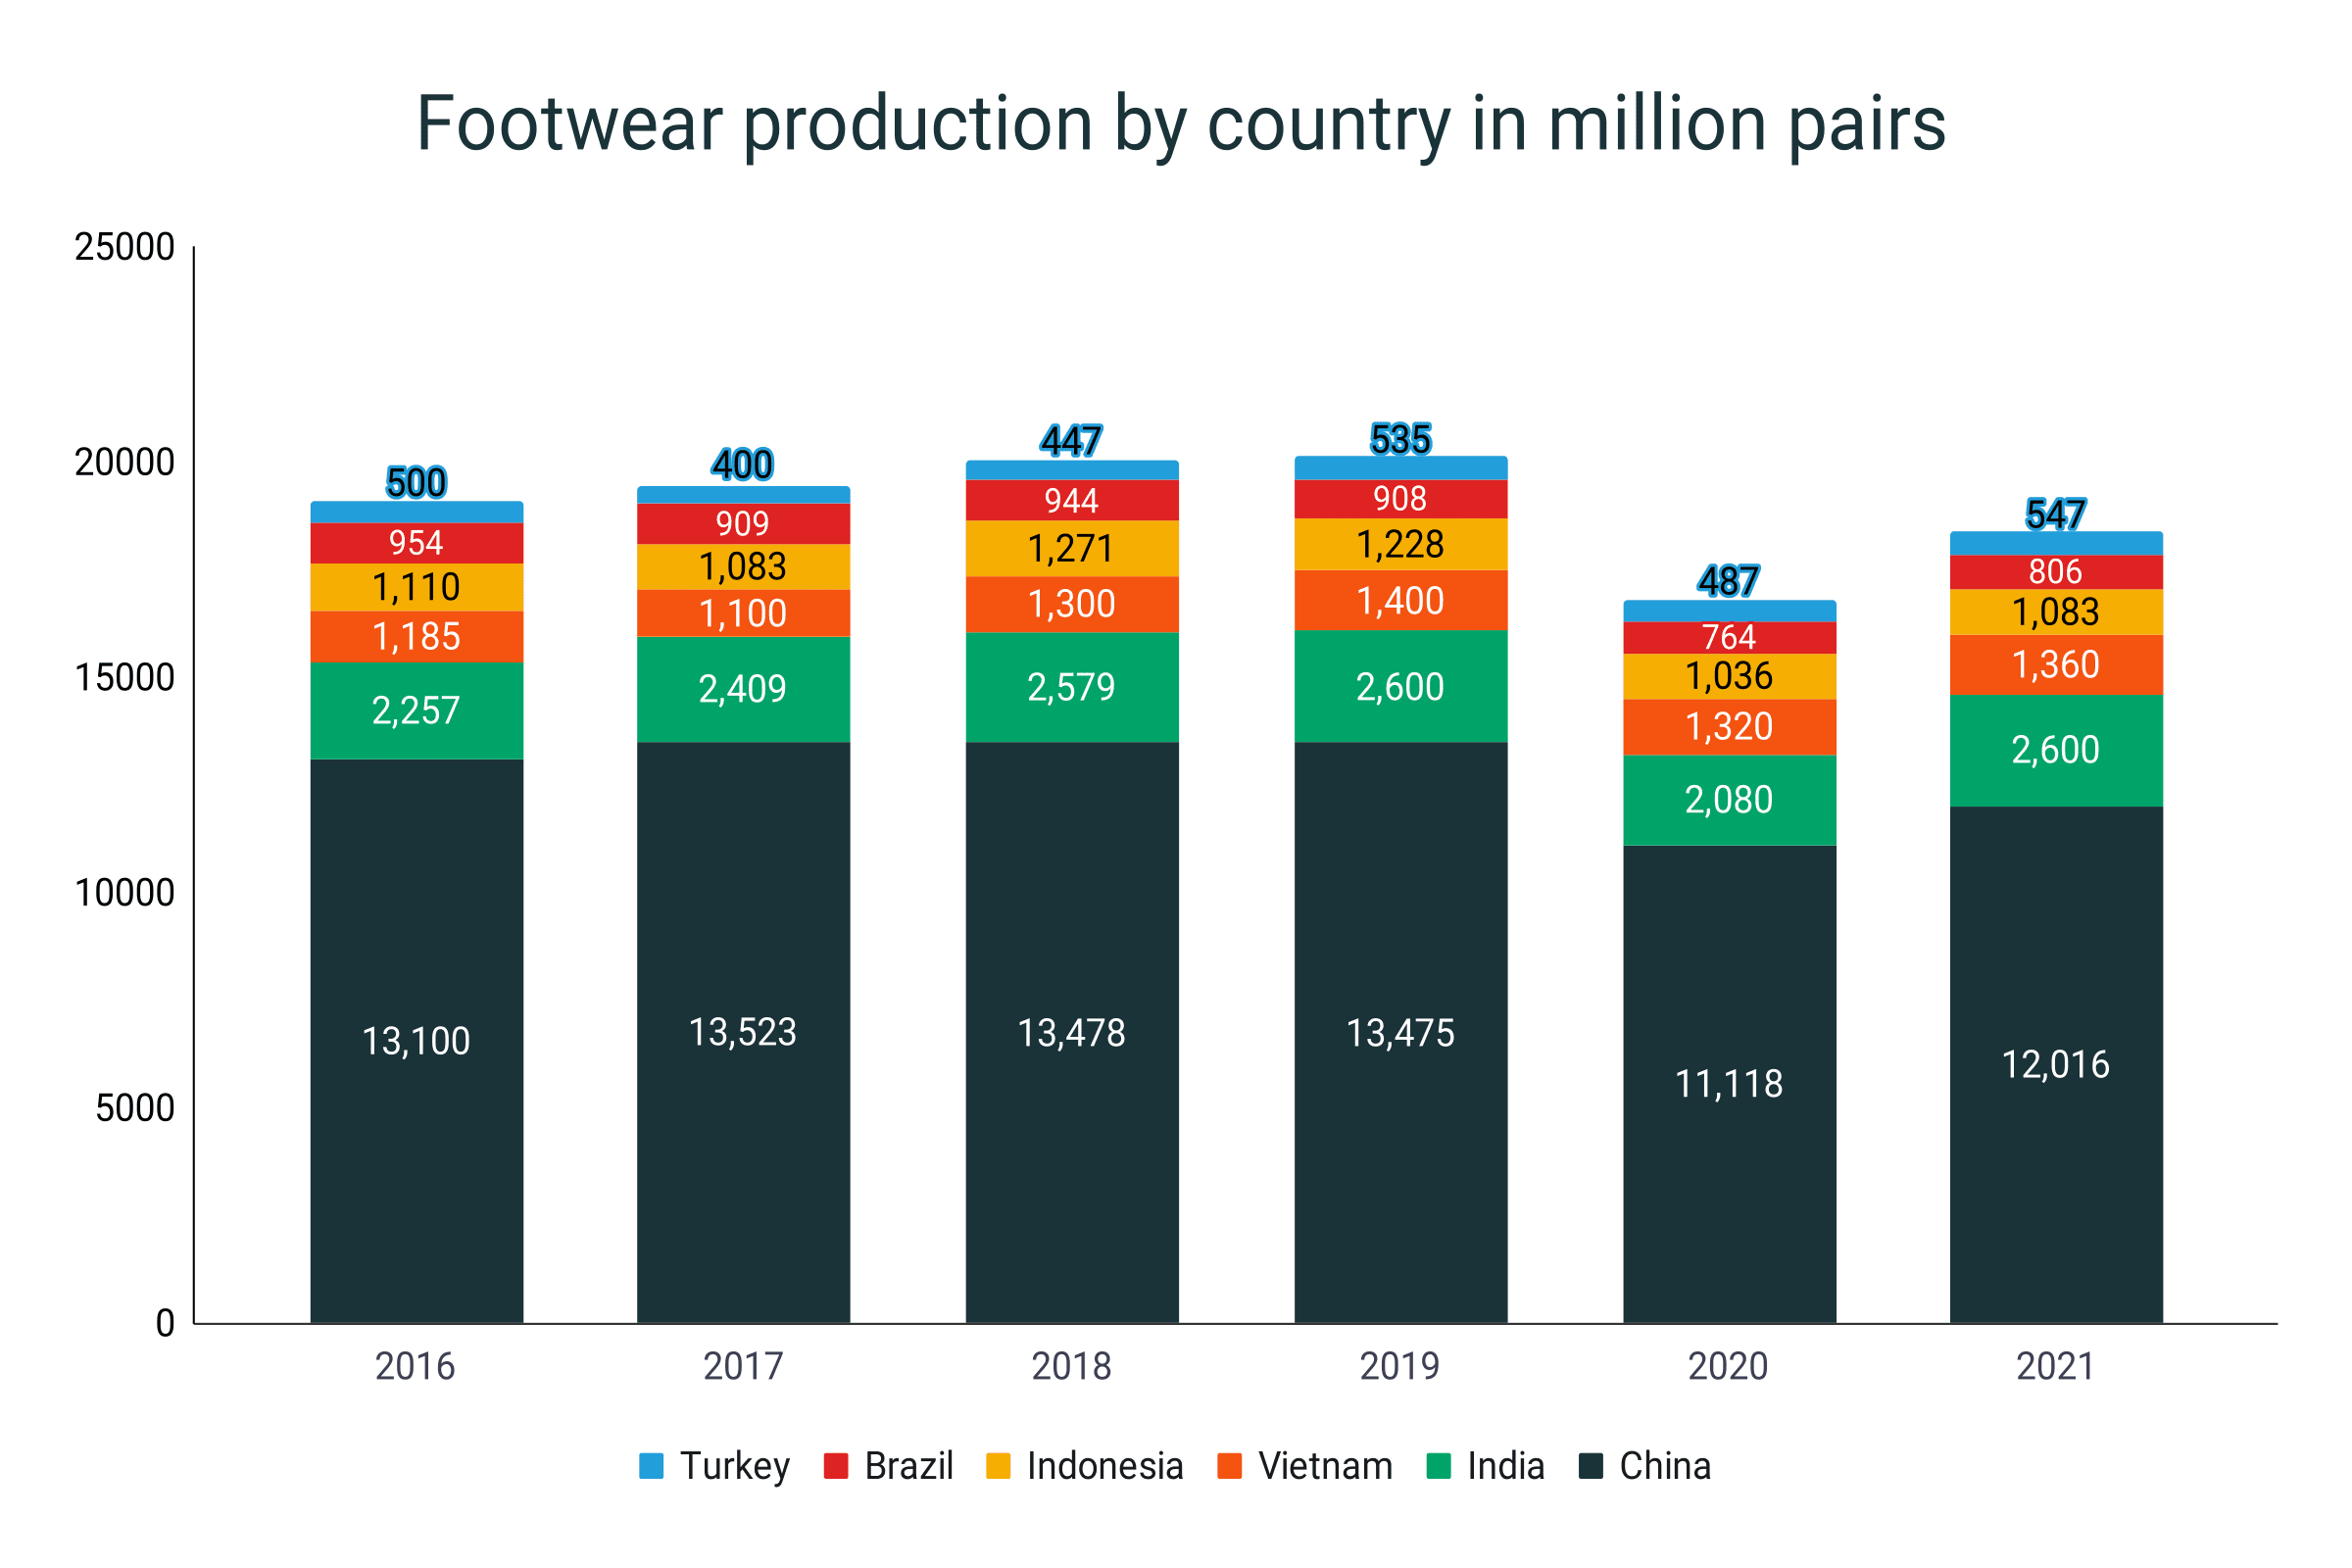
- China was still the biggest shoe-manufacturing country in 2021, with 12,016 million pairs of shoes produced.
- India and Vietnam trailed in second and third with 2,600 million and 1,360 million pairs, respectively.
- In terms of export China was also the biggest shareholder with 61.3% in 2021.
- Vietnam is the second biggest exporter of footwear products with a 9.9% share. Indonesia scored a 3.5% share, enough to put it in the third spot.
Footwear production by year
- A total of 22.2 billion pairs of shoes were produced in 2021.
- If distributed evenly, each person on the planet would have received about 3 pairs of shoes.
- The footwear production increased by 8.3% from 2020 to 2021.
- In 2020, global shoe production plummeted by 15.6%. About 20.5 billion pairs were manufactured during this year.
- Back in 2019, a record-high of 24.3 billion pairs of shoes were produced globally.
- 20.1 billion pairs of shoes were manufactured in 2010.
- This means that from 2010 to 2021, global footwear manufacturing grew by 10.4%.
- Compared to the 23.6 billion figure of 2017, over the five-year period, the number of shoes manufactured around the world increased by 1.3%.
Annual footwear production
|
Year |
Billion pairs |
YoY Growth |
|
2010 |
20.1 |
|
|
2017 |
23.6 |
17.4% |
|
2018 |
24.2 |
2.5% |
|
2019 |
24.3 |
0.4% |
|
2020 |
20.5 |
-15.6% |
|
2021 |
22.2 |
8.3% |
|
2022 |
23.9 |
7.7% |
Footwear production by region
- Asia was the source of 87.4% of all the shoes distributed in the world in 2022.
- The year prior, in 2021, the Asian region occupied 88.2% of the global footwear manufacturing.
- From 2018 to 2022, the average percent share of Asia in shoe production was 87.4%.
- South America was far in second place with a 4.8% global footwear manufacturing share as of 2022.
- It was also higher compared to the 4.6% and 4.7% portions in 2020 and 2021, respectively.
- However, back in 2018, South America was the origin of 5% of all the shoes manufactured around the globe.
- Africa was home to about 3.7% of all shoes manufactured in 2022. This was the highest showing of the region since 2018.
- For the past five years, an average of 3.2% of all shoes produced worldwide came from Africa.
- Europe settled for a fourth-place finish with a 2.7% share of the 2022 global footwear production. This was the worst percentage share of the continent from 2018-2022.
- Back in 2018, Europe held a 3.3% portion of all the shoes manufactured.
- Meanwhile, North America clinched a 1.4% share in 2021 and 2022.
- Back in 2018, North America accounted for 1.9% of all the footwear produced.
- For the 2018-2022 period, North America averaged a 1.6% share.
- On the other hand, 0% of shoes were manufactured in Oceania from 2018-2022.
Footwear production percent share by region
|
Year |
Asia |
South America |
Africa |
Europe |
North America |
|
2018 |
86.2% |
5.0% |
3.6% |
3.3% |
1.9% |
|
2019 |
87.4% |
4.7% |
2.9% |
3.2% |
1.8% |
|
2020 |
87.6% |
4.6% |
3.1% |
3.2% |
1.5% |
|
2021 |
88.2% |
4.7% |
2.9% |
2.8% |
1.4% |
|
2022 |
87.4% |
4.8% |
3.7% |
2.7% |
1.4% |
|
Average (2018-22) |
87.4% |
4.8% |
3.2% |
3.0% |
1.6% |
Footwear production by country
- China dominated the shoe production with a 12,016 million output in 2021.
- During the pandemic, the footwear production in China dropped to 11,118 million pairs in 2021.
- In 2017, China was the source of over 13,523 million pairs of shoes. This was the country’s highest output since 2016.
- From 2016-2021, China manufactures an average of 12,785 million pairs of shoes.
- India nabbed the second spot in 2021, producing about 2,600 million pairs of shoes. This matches the country’s 2019 record.
- Over the past six years, India has produced an average of 2,421 million pairs of shoes annually.
- Vietnam trails behind India with 1,360 million pairs of shoes produced in 2021.
- Back in 2019, Vietnam peaked with a 1,400 million output.
- Indonesia maintained its fourth spot as the top shoe-producing country in the world in 2021. The country produced 1,083 million pairs of shoes during this time.
- Brazil recovered from its 764 million output in 2020, tallying over 806 million pairs of shoes produced in 2021.
- However, the figure was still far from the 954 million record back in 2016.
- In sixth place was Turkey with 547 million pairs of shoes manufactured in 2021. This was the best output of the country since 2016.
- Meanwhile, in the United States, an average of 25 million pairs of shoes are manufactured every year.
Footwear production by country in million pairs
|
Year |
China |
India |
Vietnam |
Indonesia |
Brazil |
Turkey |
Overall |
|
2016 |
13,100 |
2,257 |
1,185 |
1,110 |
954 |
500 |
|
|
2017 |
13,523 |
2,409 |
1,100 |
1,083 |
909 |
400 |
|
|
2018 |
13,478 |
2,579 |
1,300 |
1,271 |
944 |
447 |
|
|
2019 |
13,475 |
2,600 |
1,400 |
1,228 |
908 |
535 |
|
|
2020 |
11,118 |
2,080 |
1,320 |
1,036 |
764 |
487 |
|
|
2021 |
12,016 |
2,600 |
1,360 |
1,083 |
806 |
547 |
|
|
Average (2016-21) |
12,785 |
2,421 |
1,278 |
1,135 |
881 |
486 |
Footwear exports by country
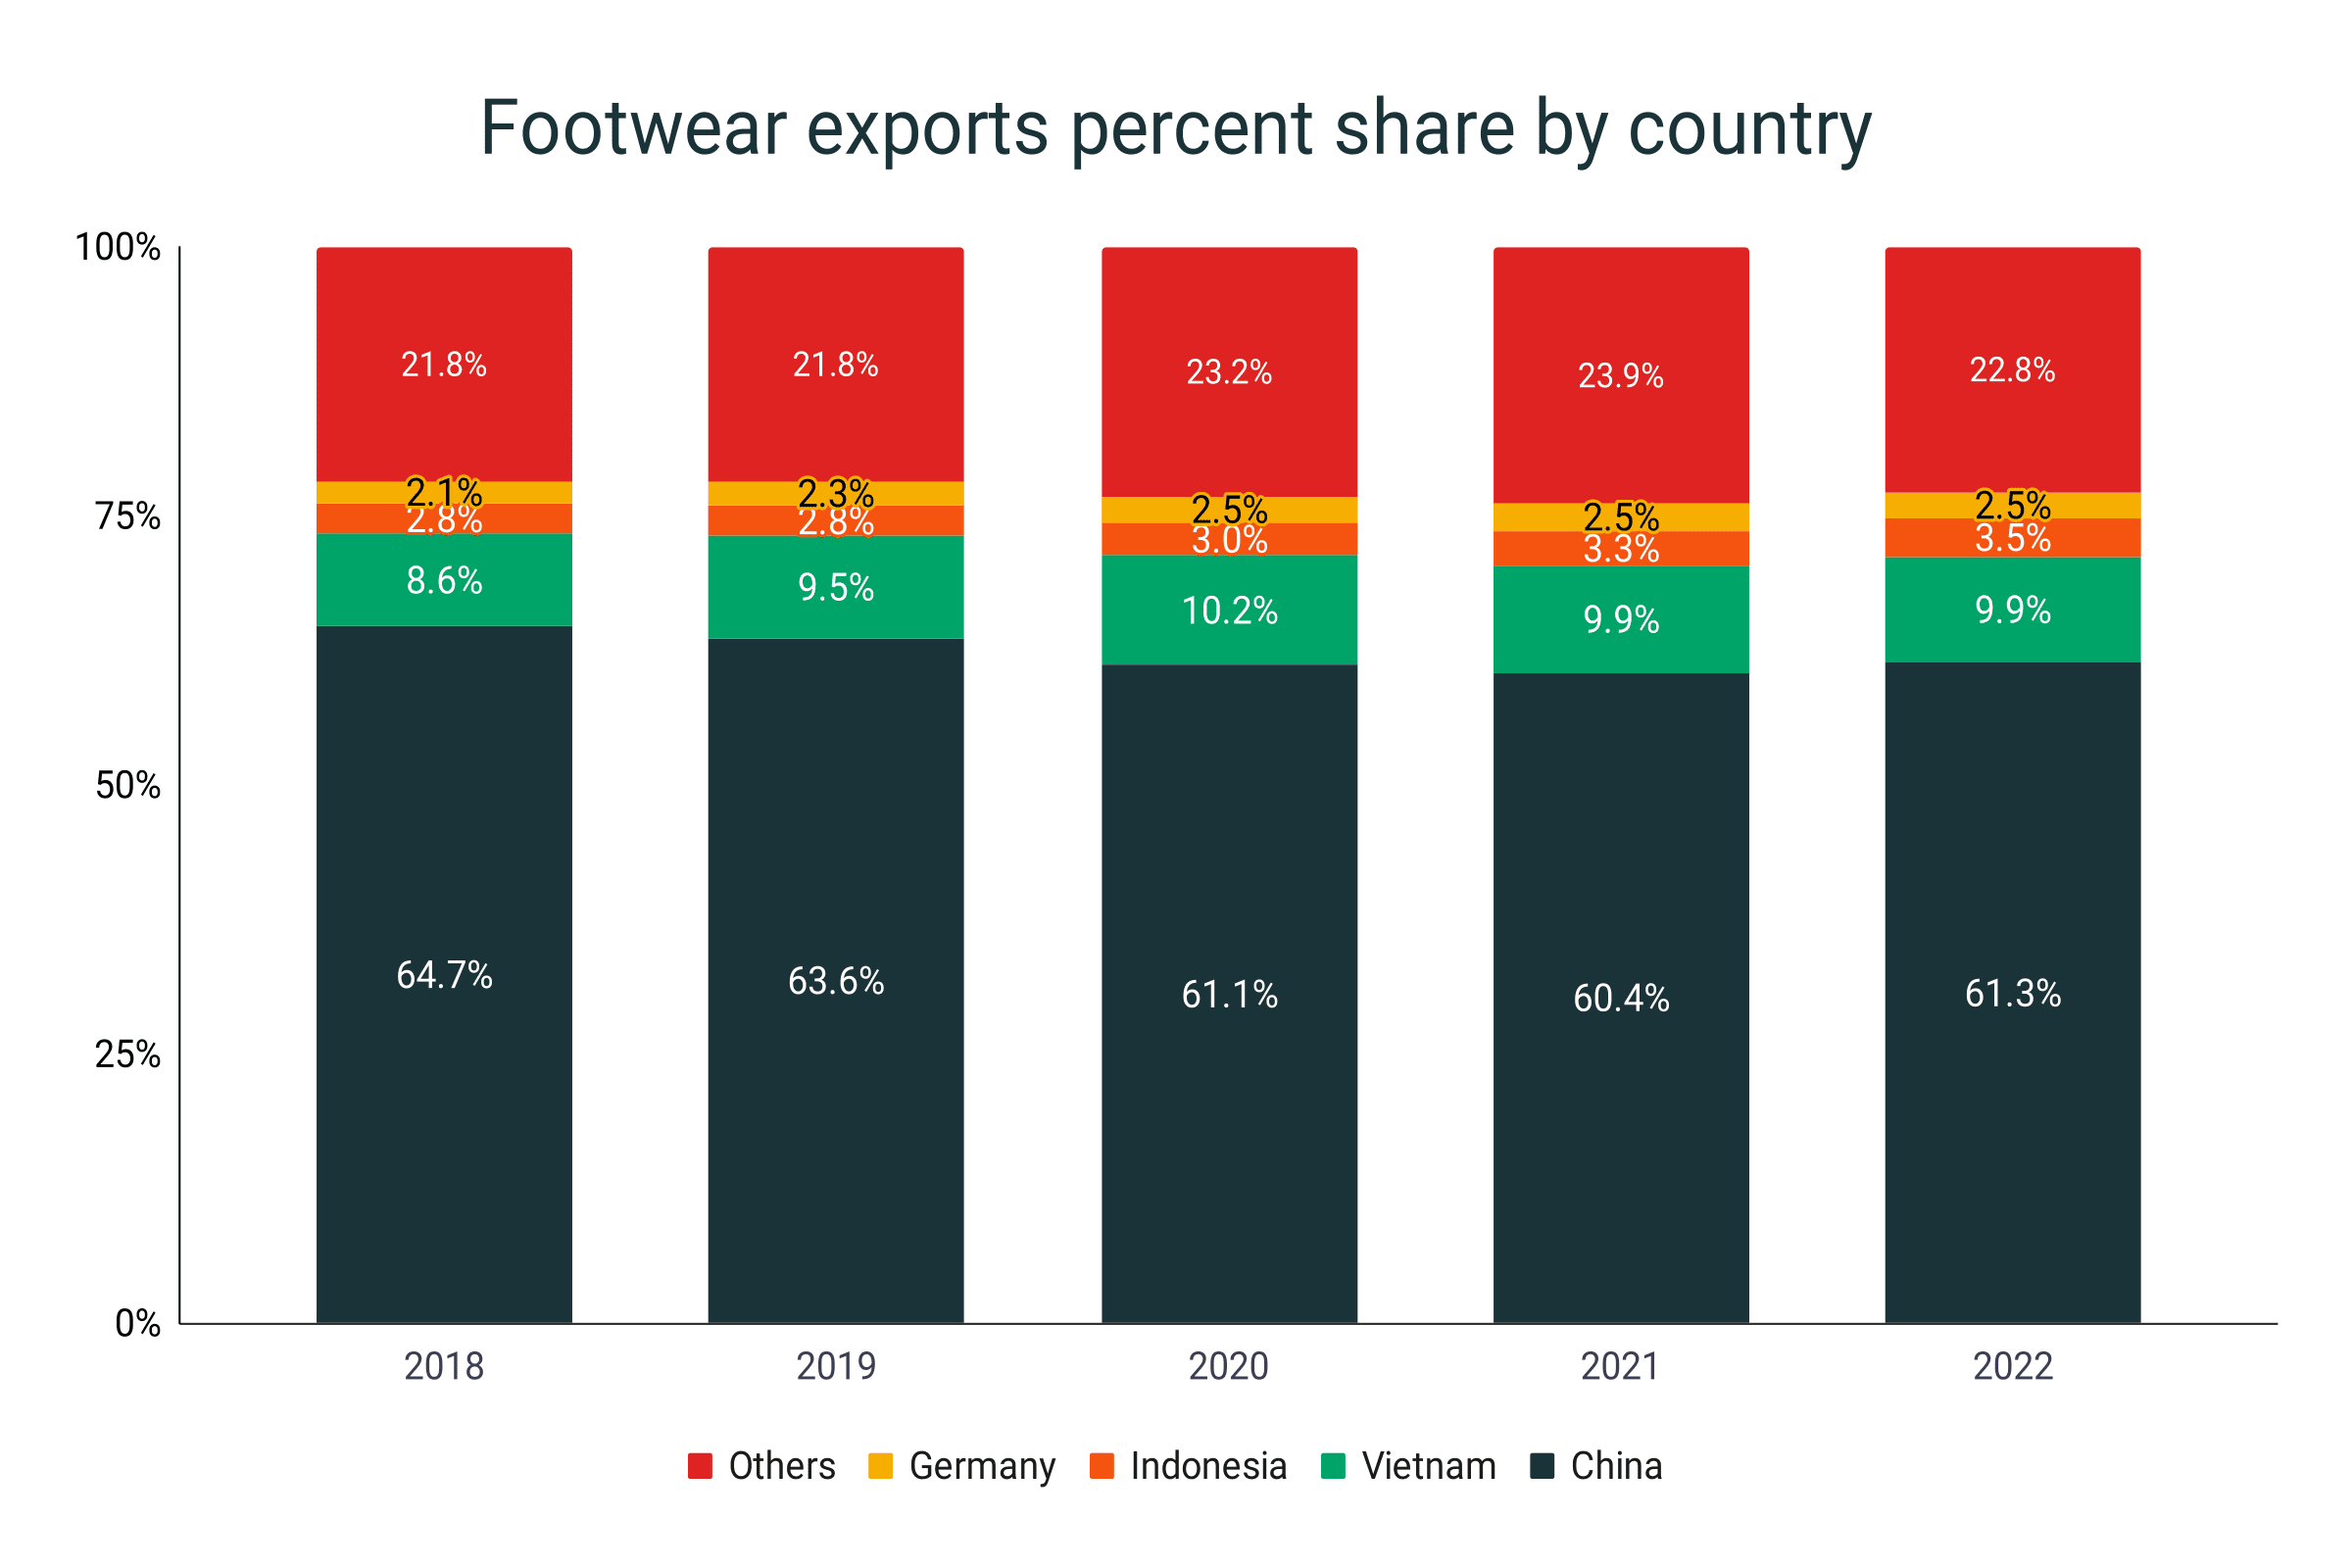
- In terms of exports, China still led the pack, occupying about 61.3% of all footwear exports in 2022.
- This was 0.9% higher than the 60.4% performance back in 2021.
- But back in 2018, China held 64.7% of all shoe exports worldwide. This was the highest percentage share of the country over the last 5 years.
- Vietnam has been the second top shoe exporter since 2018. For the five-year period, the country averaged 9.6% of the total footwear exports.
- In 2020, Vietnam reached its highest percent share being the source of 10.2% of all exported shoes worldwide.
- Indonesia trailed with a 3.5% and a 3.3% footwear export share in 2022 and 2021, respectively.
- Germany snatched the fourth spot as the biggest shoe exporter in the world in 2022. It managed to occupy 2.5% of all shoe exports during that year.
- In 2018, Belgium was the fifth biggest shoe exporter with a 1.9% share.
- India replaced Belgium in 2019 as the fifth biggest exporter of footwear. India also garnered a 1.9% export share.
- Starting in 2020, Turkey joined the top five footwear exporters with a 2.3% share.
- Turkey then nabbed 2.7% and 2.5% shares in 2021 and 2022, respectively, becoming the fourth biggest shoe exporting country.
- Additionally, in 2022, the rest of the world combined contributed 22.8% of all shoe exports.
Footwear exports percent share by country
|
Year |
China |
India |
Vietnam |
Indonesia |
Others |
|
2018 |
64.7% |
8.6% |
2.8% |
2.1% |
21.8% |
|
2019 |
63.6% |
9.5% |
2.8% |
2.3% |
21.8% |
|
2020 |
61.1% |
10.2% |
3.0% |
2.5% |
23.2% |
|
2021 |
60.4% |
9.9% |
3.3% |
2.5% |
23.9% |
|
2022 |
61.3% |
9.9% |
3.5% |
2.5% |
22.8% |
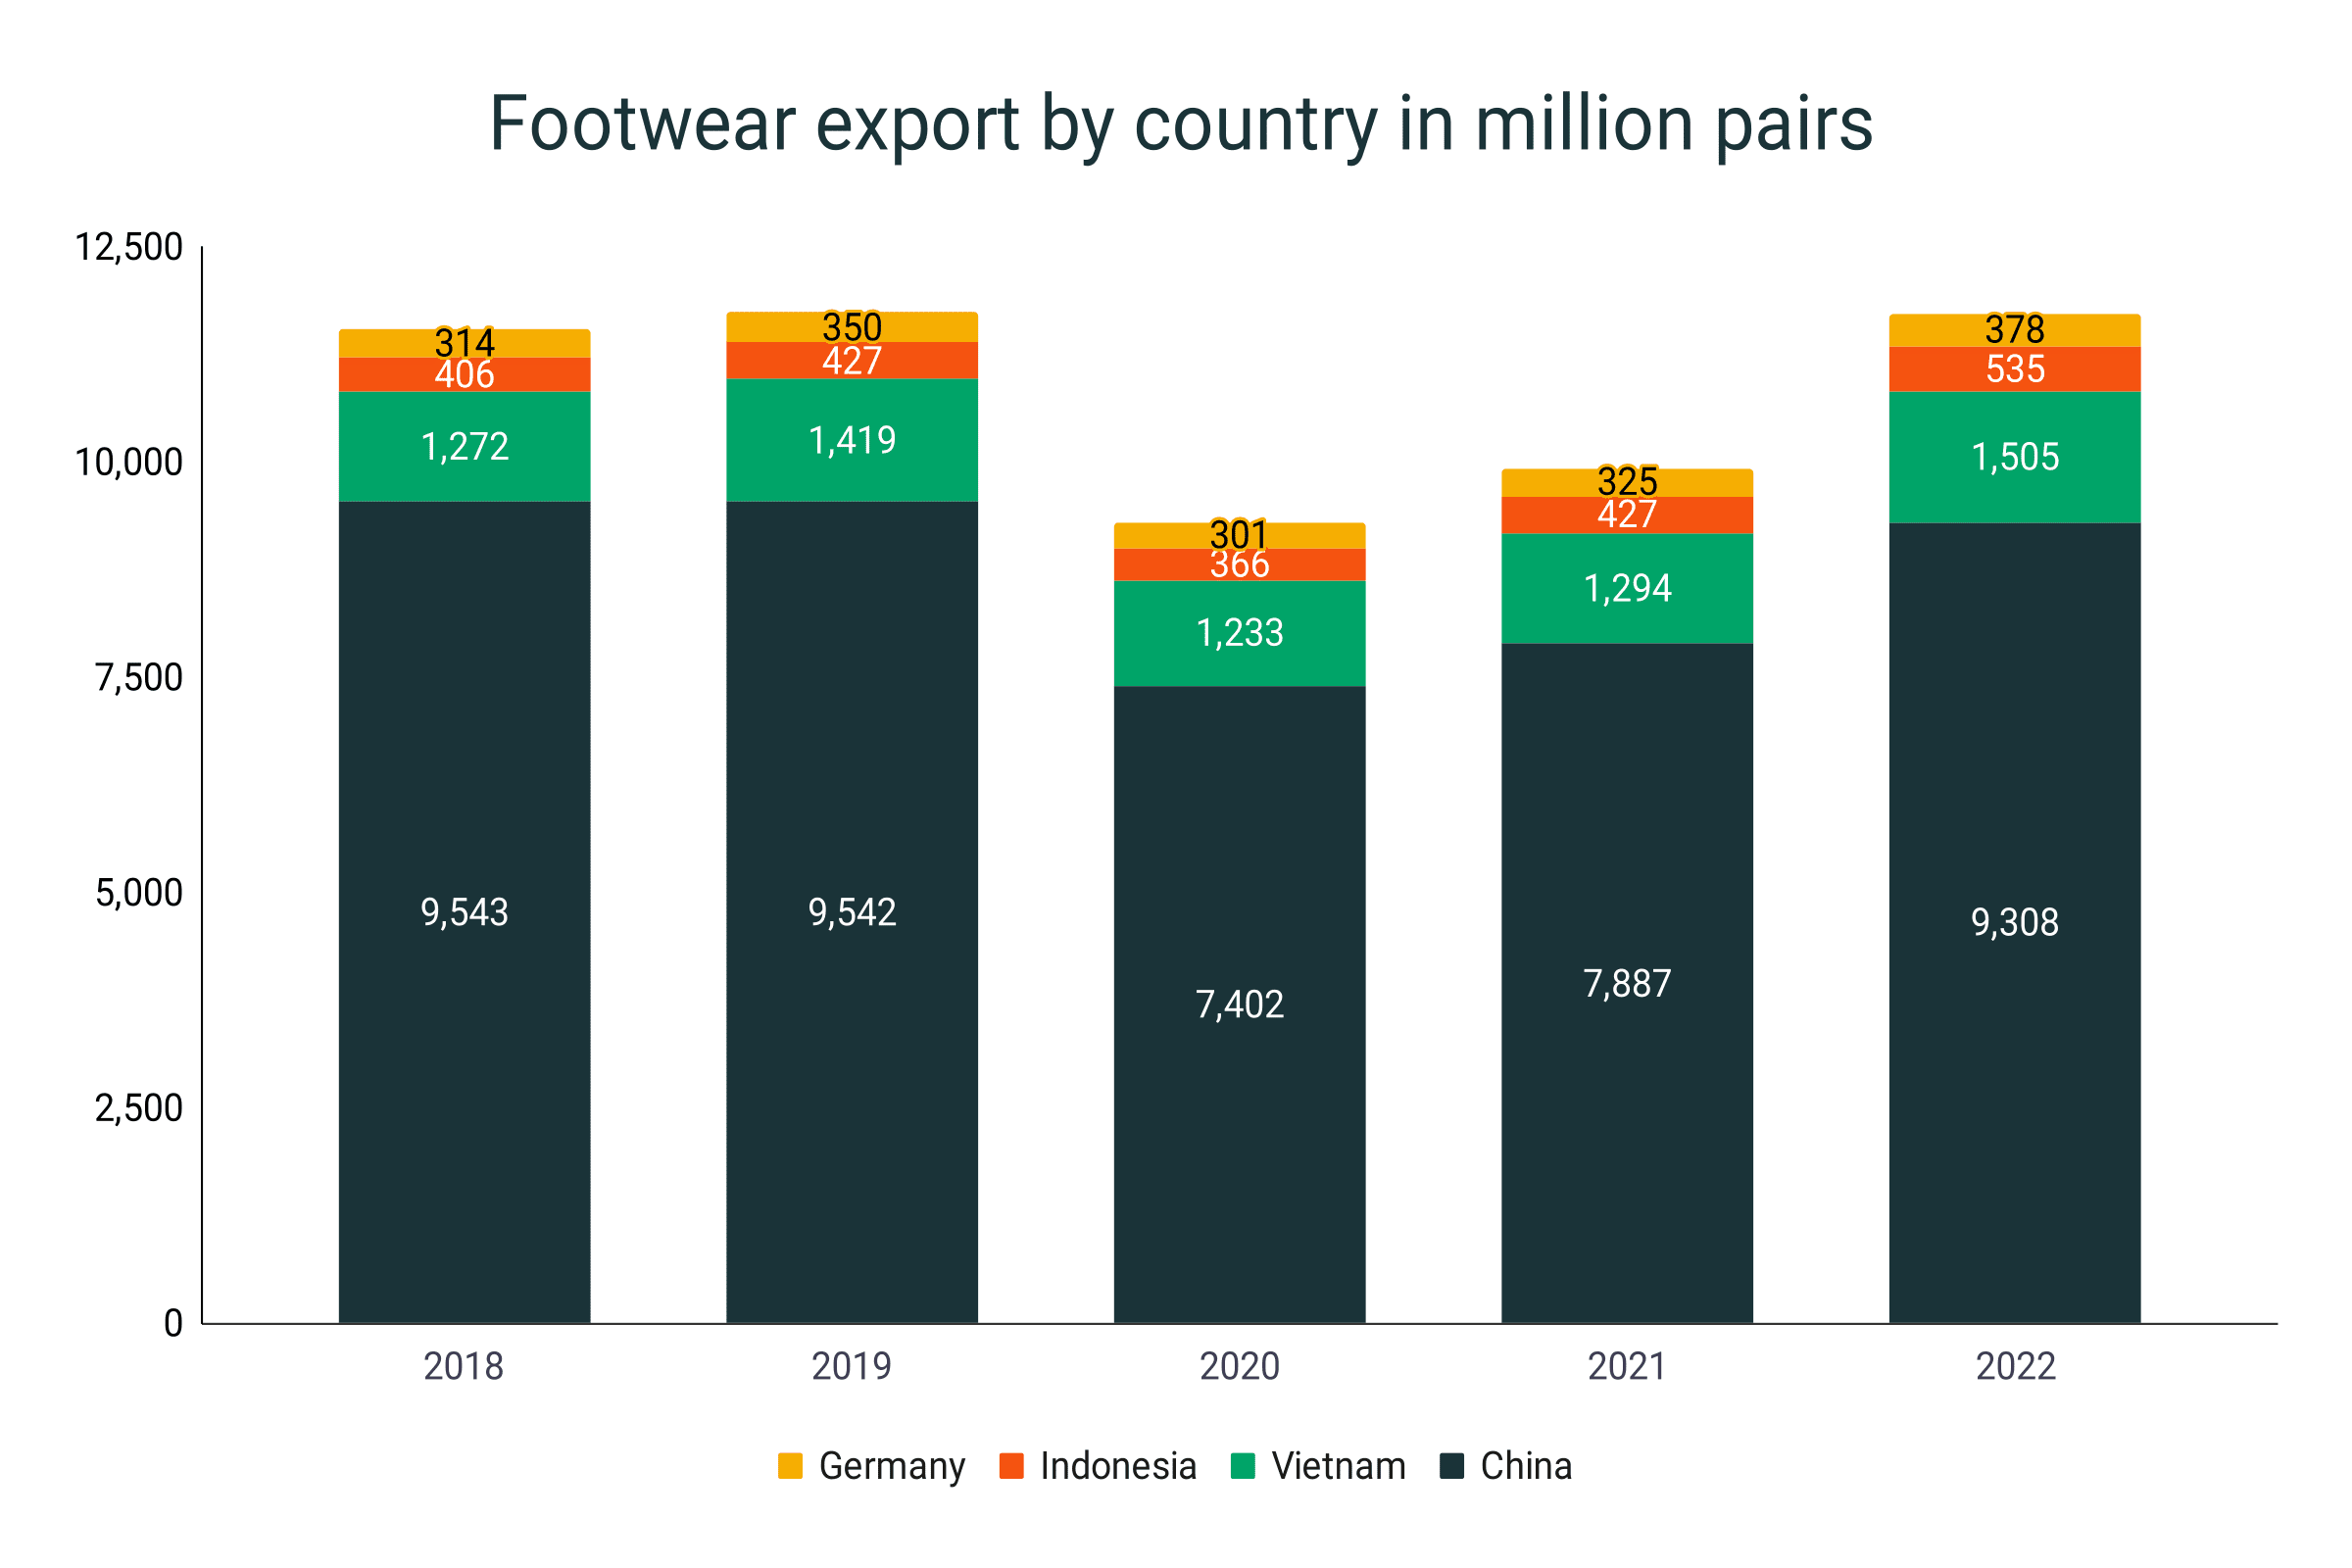
- A total of 9.308 million pairs of shoes were exported from China in 2022.
- In 2021, China exported 7,887 million pairs of shoes.
- But in 2018, China reached its highest output with 9,543 million pairs of shoes for export.
- Meanwhile, Vietnam was the source of 1,505 million pairs of shoes exported in 2022. This is the best showing of the country in the past five years.
- Indonesia, on the other hand, exported a total of 535 million pairs of footwear products in 2022.
- Germany sported 378 million pairs of shoes in 2022, tallying its best output since 2018.
Footwear exports by country in million pairs
|
Country |
China |
Vietnam |
Indonesia |
Germany |
|
2018 |
9,543 |
1,272 |
406 |
314 |
|
2019 |
9,542 |
1,419 |
427 |
350 |
|
2020 |
7,402 |
1,233 |
366 |
301 |
|
2021 |
7,887 |
1,294 |
427 |
325 |
|
2022 |
9,308 |
1,505 |
535 |
378 |
Footwear production by brand in 2022
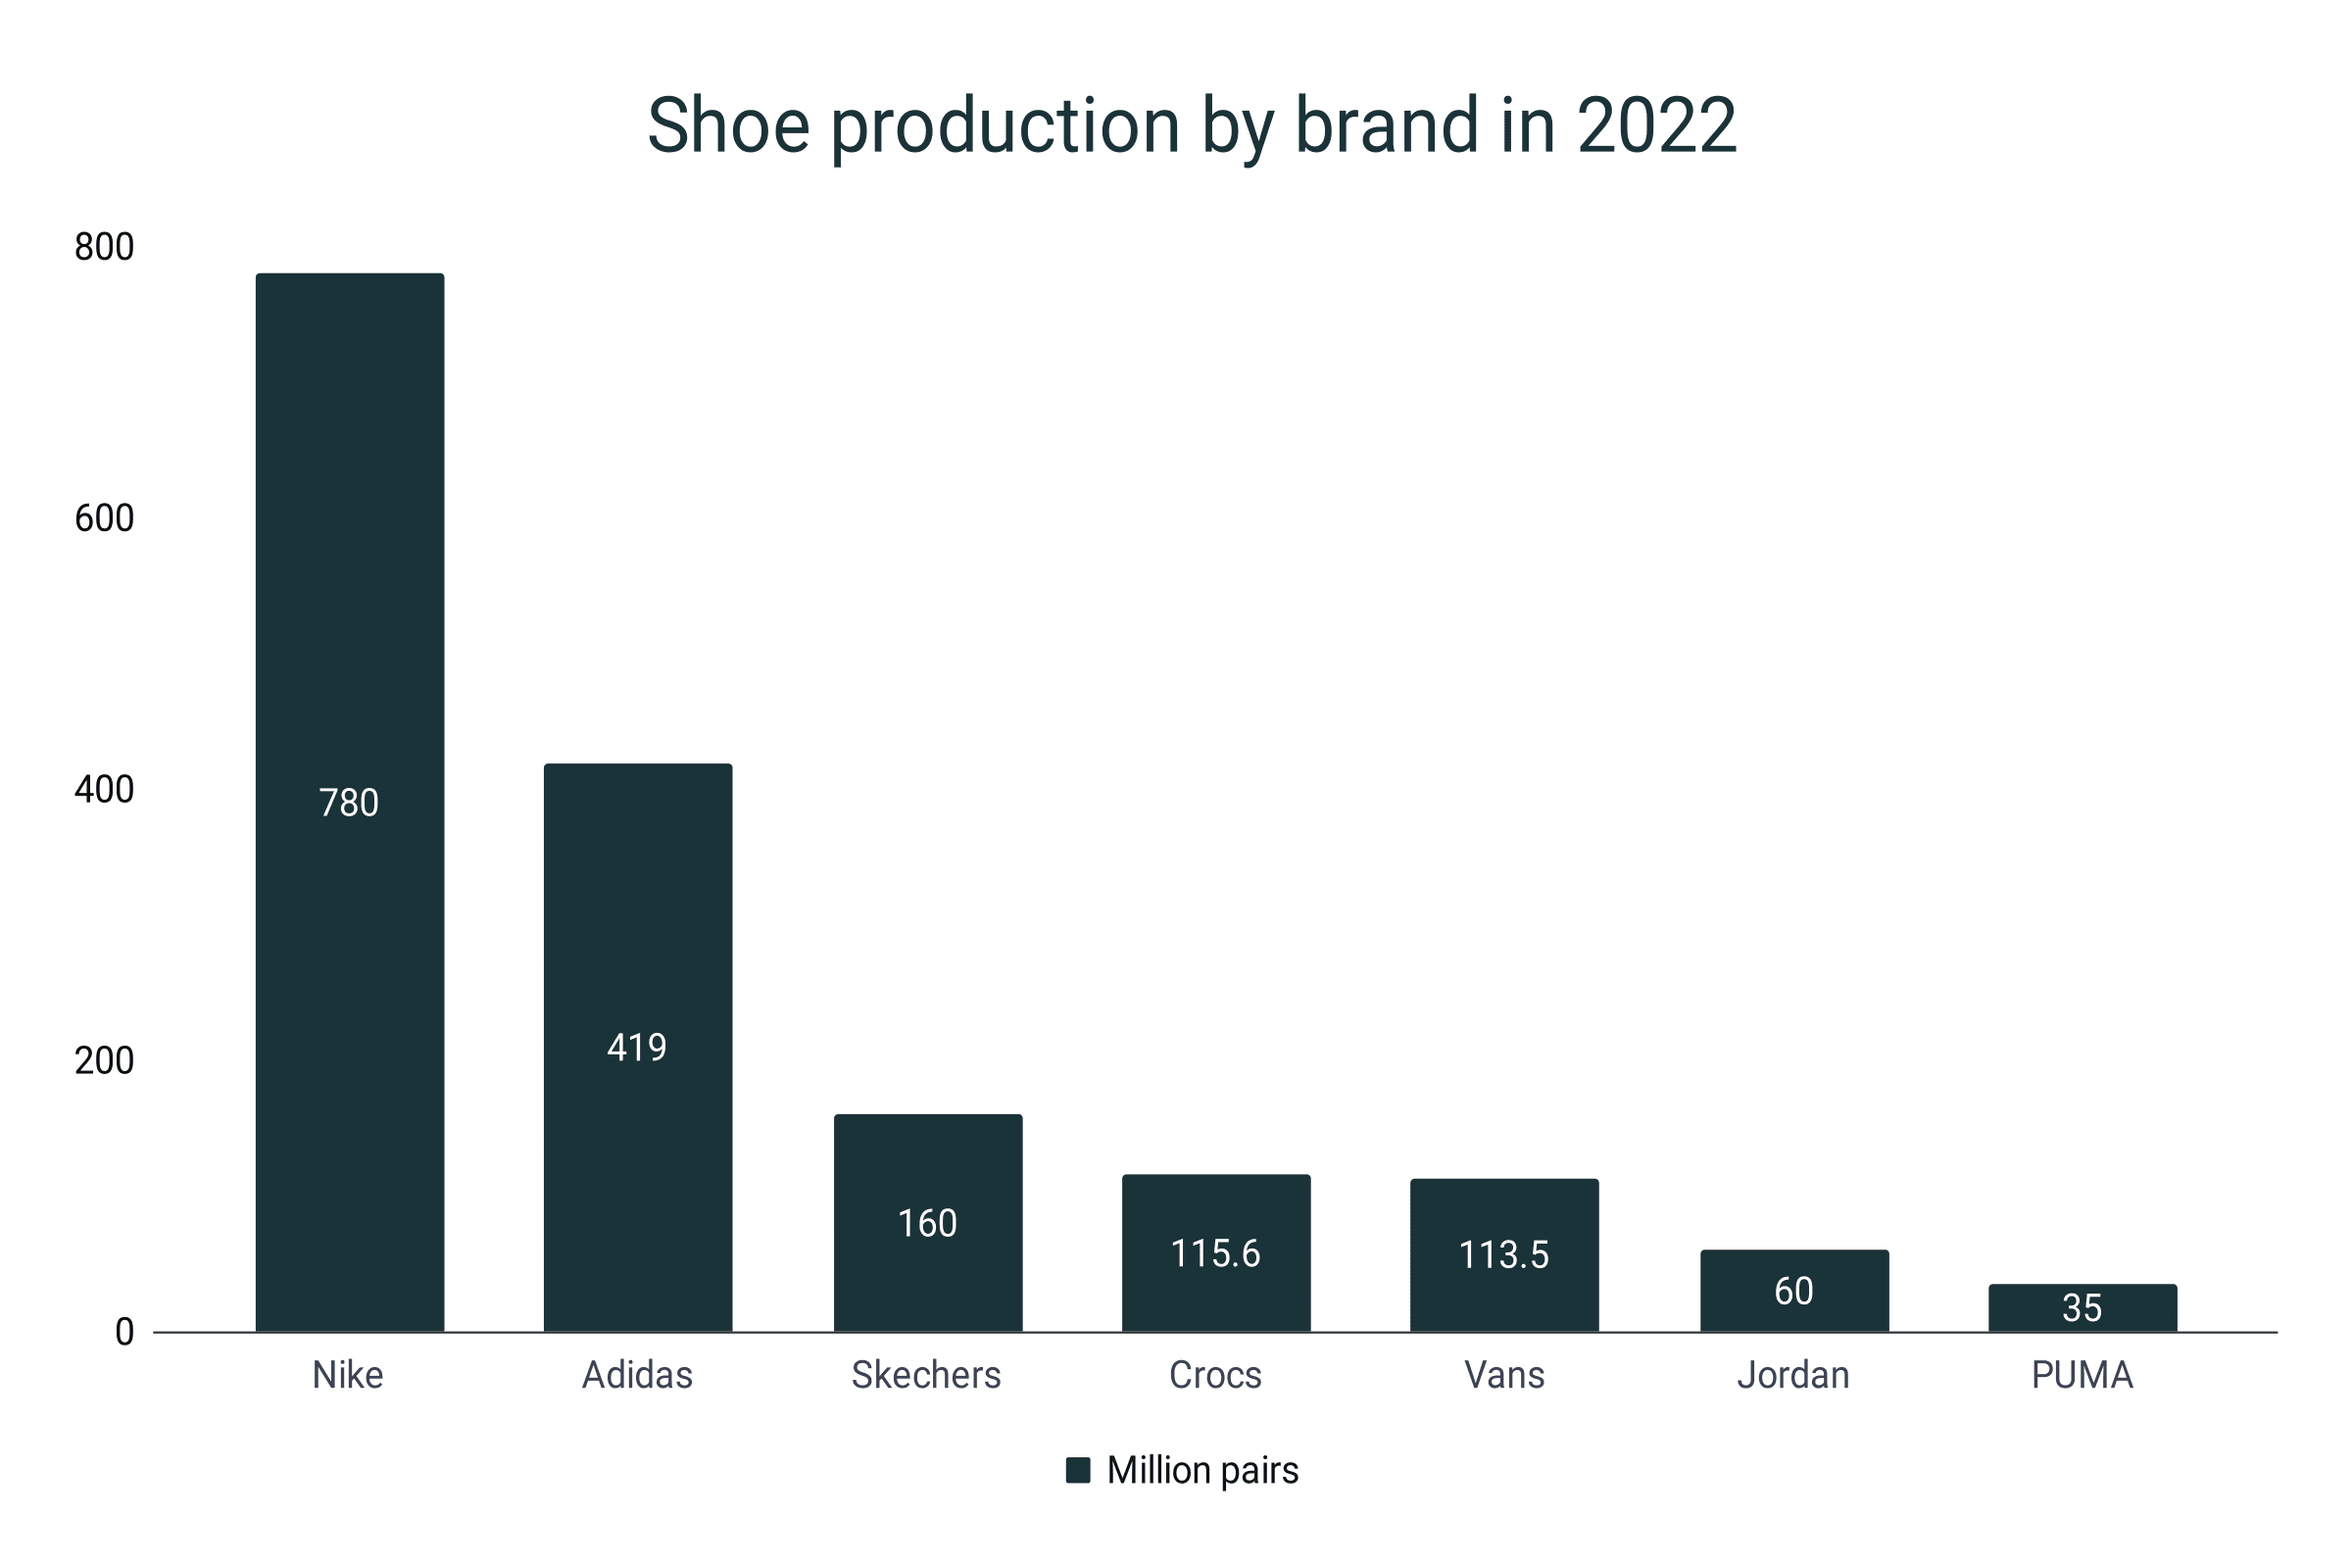
- In 2022, Nike produced 780 million pairs of shoes.
- This was equivalent to 3.26% of all shoes manufactured during the year.
- Adidas came in second with a 1.75% share, producing 419 million pairs of shoes in 2022.
- Meanwhile, Skechers was the third-biggest shoe manufacturer in 2022. The American company registered 160 million pairs of shoes in total.
- Crocs and Vans trailed with a 0.48% and 0.47% share of the global footwear output in 2022, respectively.
- Vans manufactured 113.5 million pairs of shoes while Crocs tallied 115.6 million.
- Jordan snagged a 0.25% share with 60 million pairs of shoes produced in 2022.
- PUMA settled with a 0.15% share, generating 35 million pairs of shoes.
- Collectively, the rest of all shoe brands in the world equated to 92.96% of all shoes manufactured in 2022.
Shoe production by brand in 2022
|
Brand |
Million pairs |
Percent share |
|
Nike |
780 |
3.26% |
|
Adidas |
419 |
1.75% |
|
Skechers |
160 |
0.67% |
|
Crocs |
115.6 |
0.48% |
|
Vans |
113.5 |
0.47% |
|
Jordan |
60 |
0.25% |
|
PUMA |
35 |
0.15% |
|
Others |
22,216.9 |
92.96% |
Sneaker production costs
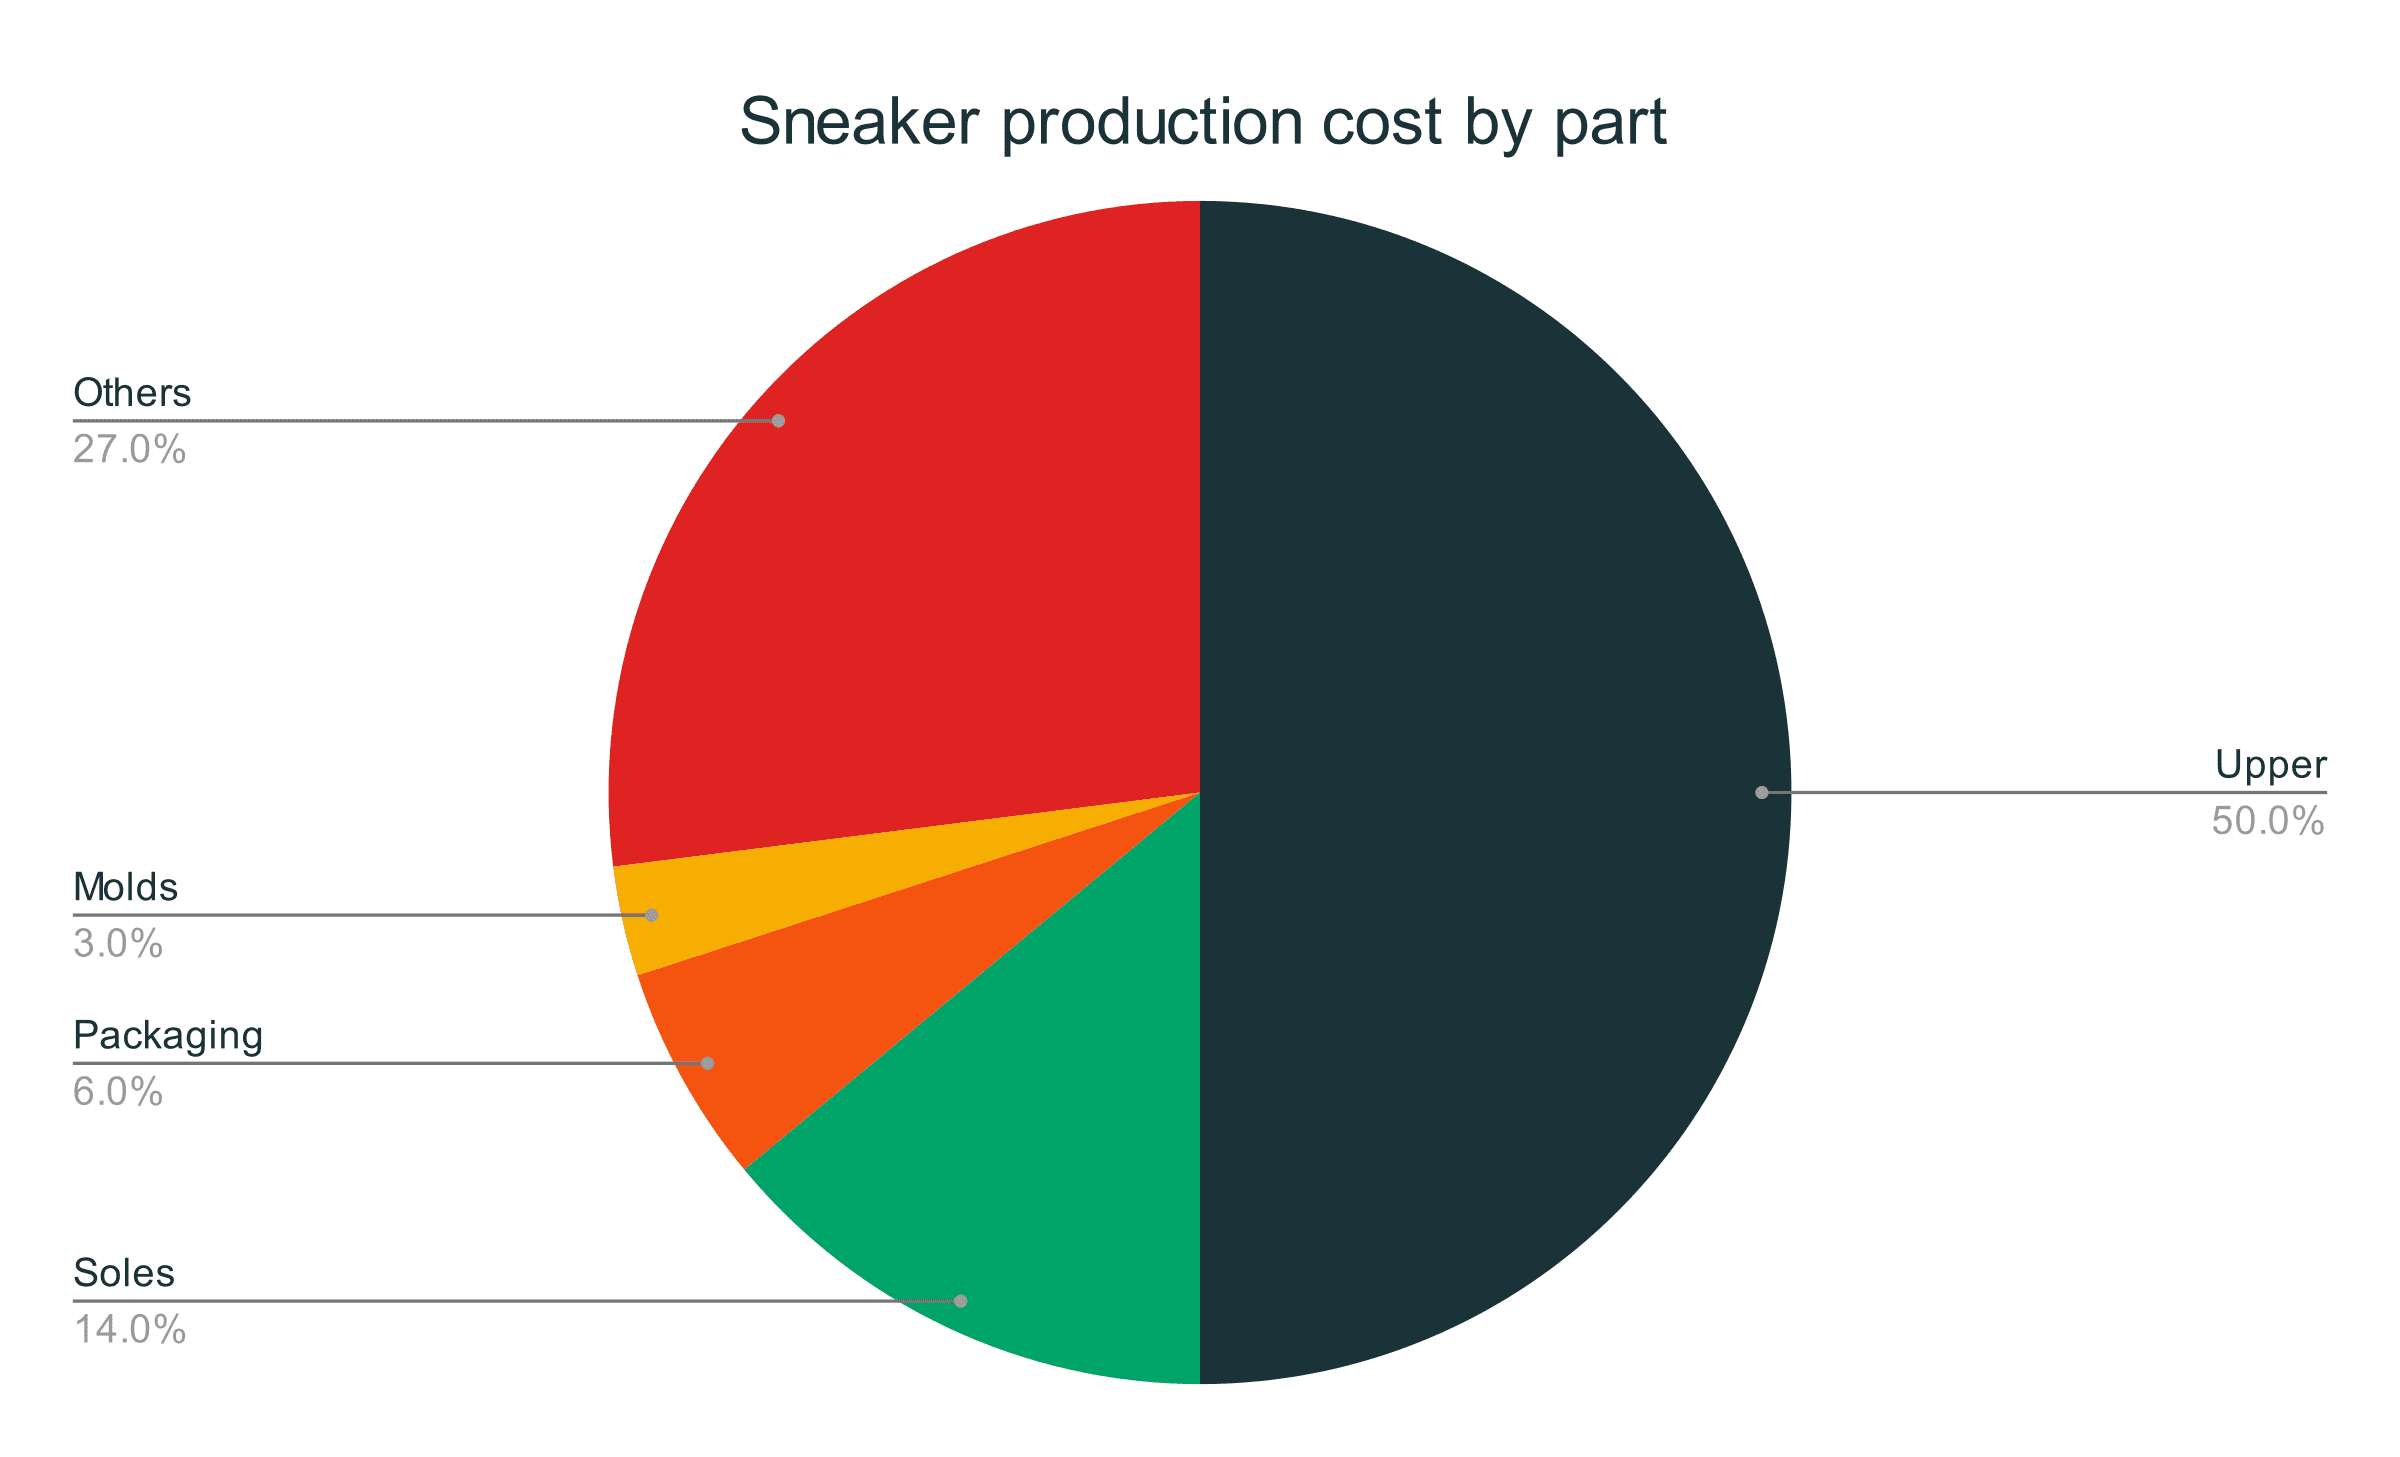
- Diving on the production cost of trainers, the upper gets a 50% portion of all expenses.
- The outsole, on the other hand, gets a 14% share of the total cost.
- Packaging constitutes 6% of all expenses in producing a pair of trainers.
- Additionally, the sneaker moulds take up 3% of all manufacturing expenditures.
- The combined labour, overhead expenses, and other costs amount to 27% of all production expenses.
Sneaker production cost by part
|
Part |
Percent share |
|
Upper |
50% |
|
Soles |
14% |
|
Packaging |
6% |
|
Moulds |
3% |
|
Others (Labour overhead and profit) |
27% |
Adidas vs. Nike production costs
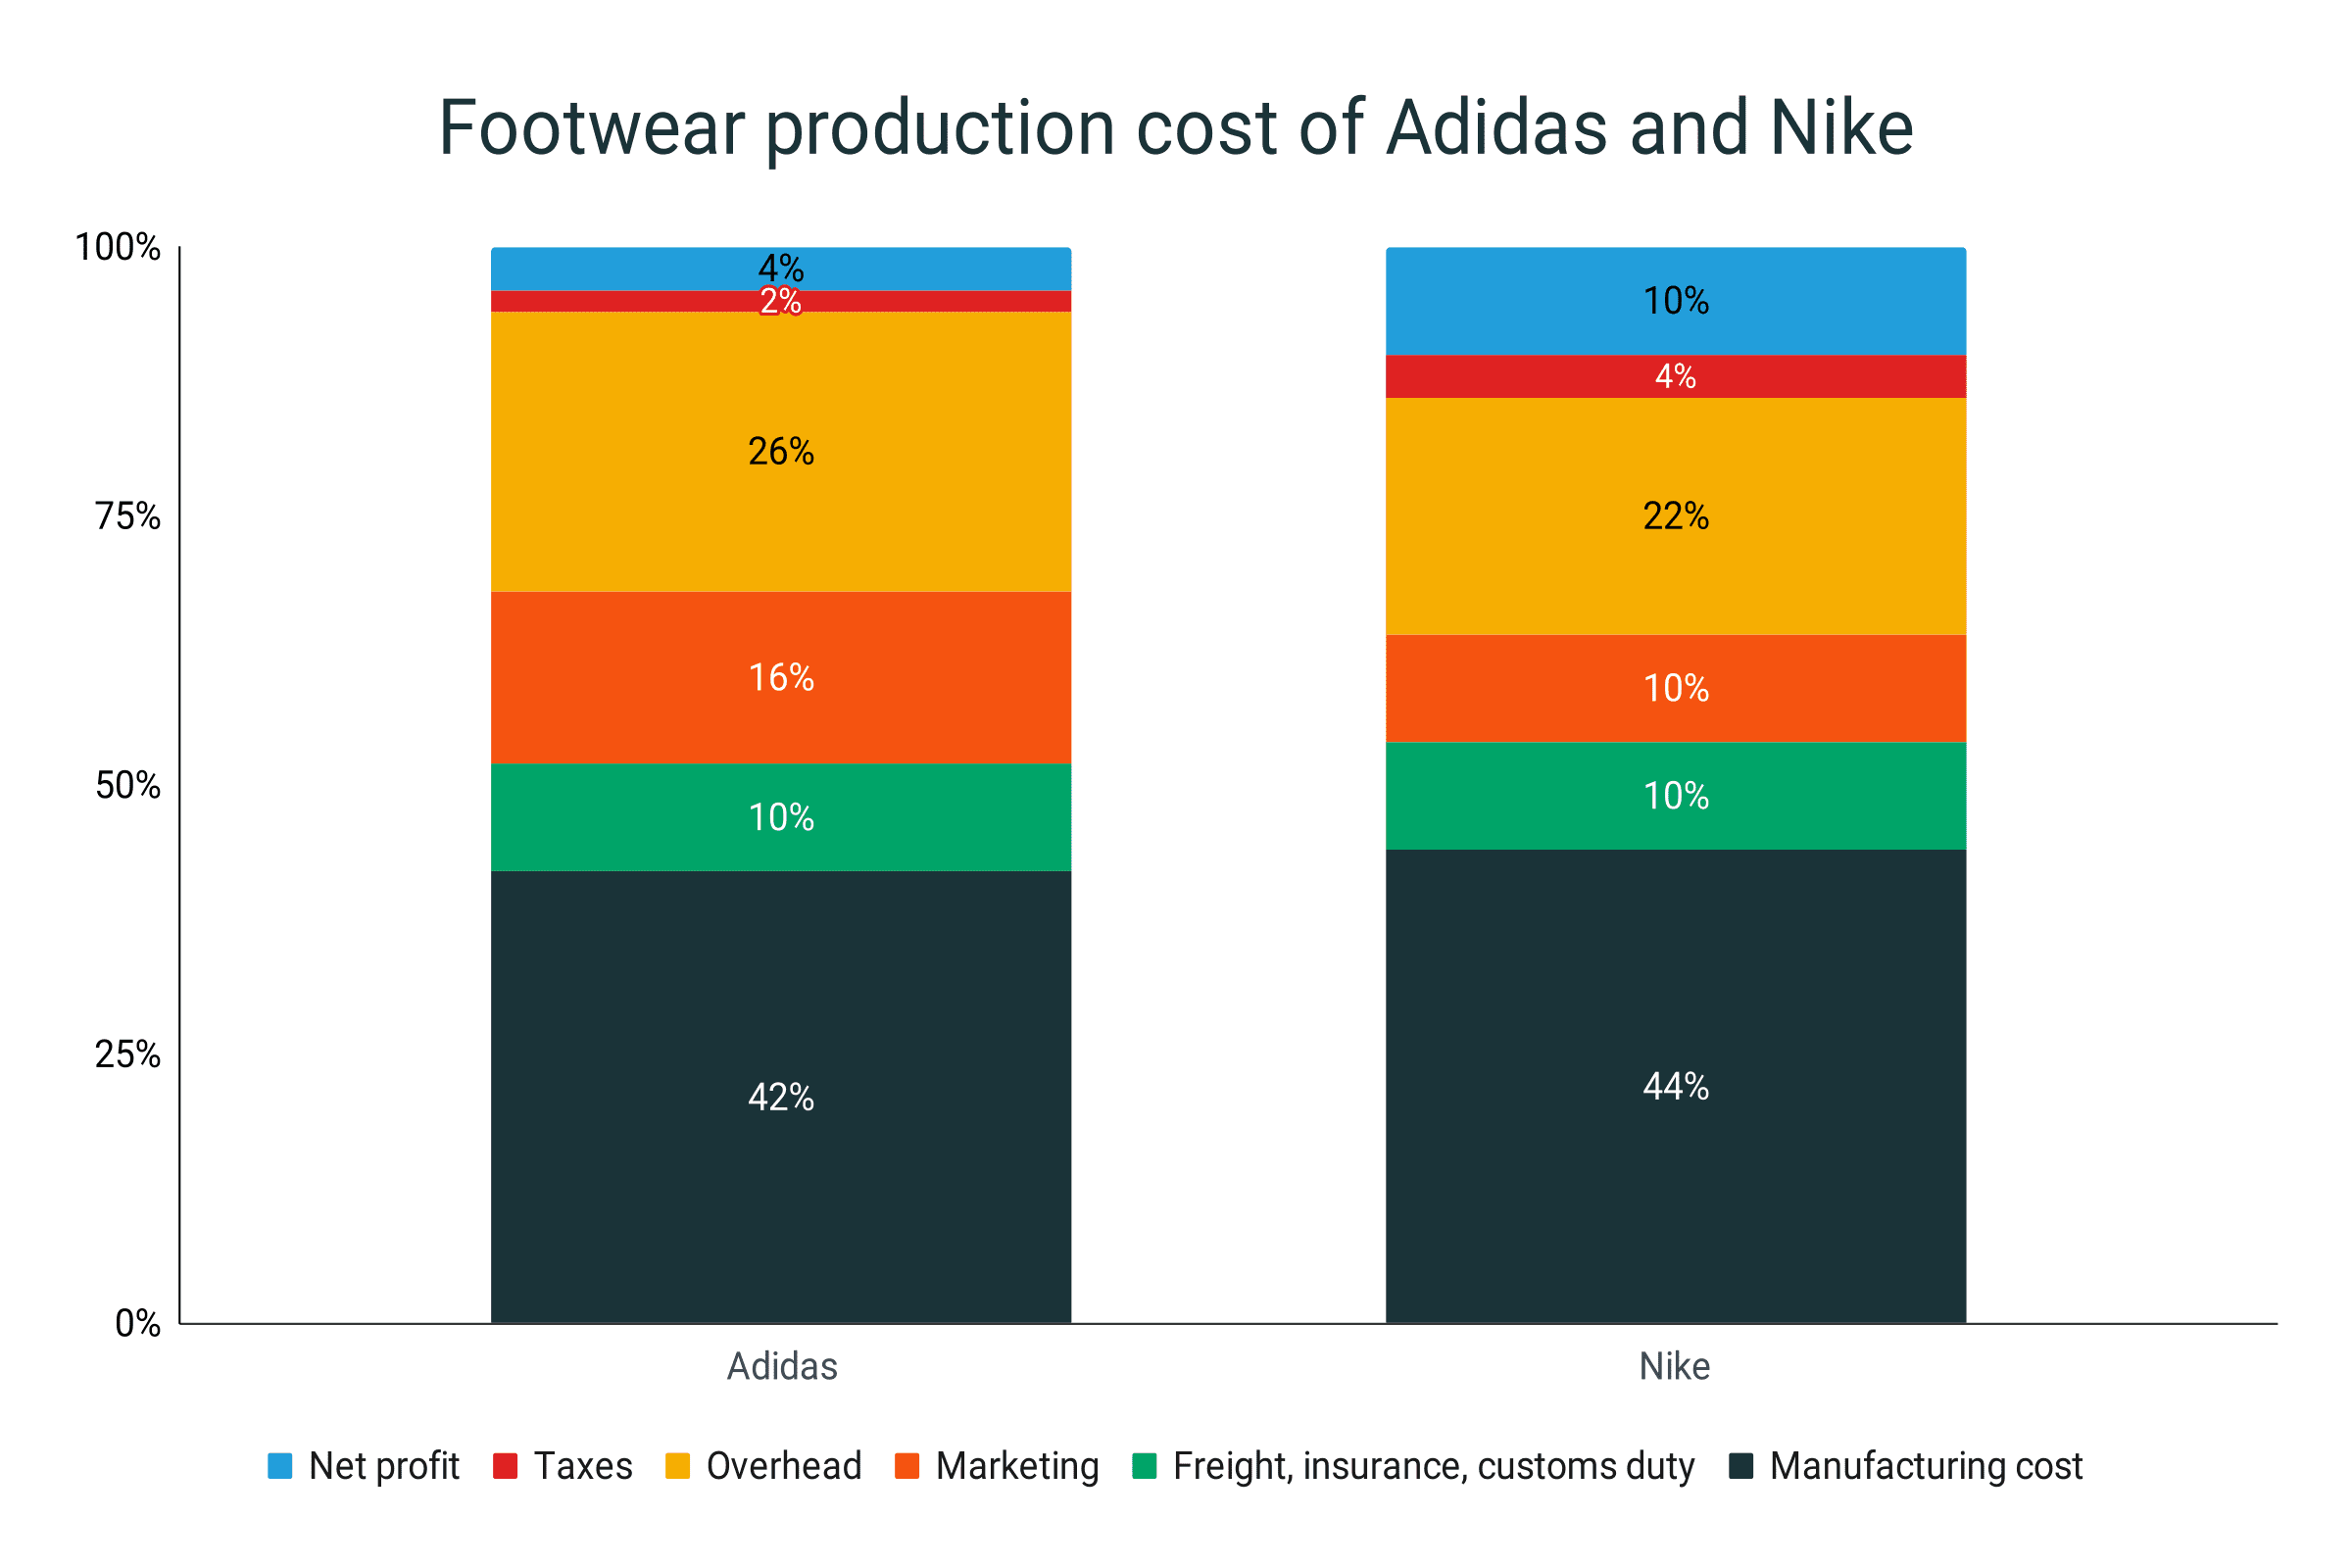
- A standard Adidas shoe allocates 42% of its budget for manufacturing.
- For Nike, on the other hand, 44% of the production cost of one pair of shoes is allotted for manufacturing.
- Both Adidas and Nike also spend the second biggest chunk on overhead costs with 26% and 22% of their production expenses, respectively.
- Nike spends 4% of its production budget on taxes compared to 2% on Adidas.
- But in terms of profit, in an average Nike shoe, 10% of its cost is the brand’s net profit.
- Meanwhile, for each pair of Adidas, the company only gets a net profit of 4%.
Footwear production cost of Adidas and Nike
|
Cost |
Adidas |
Nike |
|
Manufacturing cost |
42% |
44% |
|
Freight, insurance, customs duty |
10% |
10% |
|
Marketing |
16% |
10% |
|
Overhead |
26% |
22% |
|
Taxes |
2% |
4% |
|
Net profit |
4% |
10% |
Footwear production by type
- 1.2 billion sneaker pairs were sold worldwide. This is almost twice the amount of trainers sold in 2012.
- In 2019, 1.1 billion pairs of sports shoes were manufactured.
- It is estimated that around 150 and 200 million football cleats are produced every year.
- Approximately 38 million pairs of children’s shoes are sold each year.
- About two-thirds or 66.7% of all luxury shoes are made for export.
Sources
https://www.statista.com/statistics/227256/leading-10-global-footwear-producers-by-country/
https://www.commonobjective.co/article/the-size-of-the-global-footwear-market
https://www.worldfootwear.com/yearbook/the-world-footwear-2021-Yearbook/226.html
https://www.worldfootwear.com/yearbook/the-world-footwear-2022-Yearbook/230.html
https://www.worldfootwear.com/news/the-world-footwear-2023-yearbook/8981.html
https://www.solereview.com/what-does-it-cost-to-make-a-running-shoe/
https://shoemakersacademy.com/cost-to-make-a-sneaker/
https://parklandmfg.com/the-cost-of-making-a-pair-of-balenciaga-shoes/
https://weartesters.com/cost-breakdown-100-nike-sneaker/
https://finmodelslab.com/blogs/operating-costs/shoe-manufacturing-operating-costs
https://runrepeat.com/footwear-industry-statistics
https://runrepeat.com/average-shoe-cost
https://context.capp.ca/articles/2019/feature-petroleum-products_running-shoes/
http://www.madehow.com/Volume-1/Running-Shoe.html
https://www.investopedia.com/articles/investing/030716/economics-behind-trainers-nke-addyy.asp
https://www.bbc.com/culture/article/20200303-the-nasty-truth-about-trainers
https://designmuseum.nl/en/derde-verdieping/trainers/facts-from-the-sneaker-industry/
https://shoeeffect.com/how-many-adidas-shoes-are-sold-per-year/
https://www.esquire.com/style/news/a49538/nike-sales-numbers/
https://clubleonen.com/the-football-cleat-industry-a-billion-dollar-industry/
https://www.independent.co.uk/life-style/fashion/features/the-timeline-flipflops-2039012.html
https://craftsmanship.net/sidebar/the-global-headquarters-of-luxury-footwear/
